


 Arguments


CO2 is the main driver of climate change
What the science says...
| Select a level... |
 Basic
Basic
|
 Intermediate
| |||
|
Theory, models and direct measurement confirm CO2 is currently the main driver of climate change. |
|||||
Climate Myth...
CO2 is not the only driver of climate
I don’t “deny” climate change or global warming, it is clear to me that the Earth has warmed slightly in the last century, this is indisputable. I also believe that increasing amounts of CO2 in Earths atmosphere are a component of that warming, but that CO2 is not the only driver of climate as some would have us believe. However, what is in dispute (and being addressed by mainstream climate science) is climate sensitivity to CO2 as well as the hiatus in global warming, also known as “the pause”. Since I embrace the idea of warming and that CO2 is a factor, along with other drivers including natural variability, the label “denier” is being applied purely for the denigration value, and does not accurately reflect my position on climate. (Anthony Watts, May 2015)
At a glance
It may come as a surprise to some people unfamiliar with climate science, but tracking down anyone who actually said, "CO2 is the only driver of climate change", has proved most elusive. Thus, the idea that, "CO2 is not the only driver of climate as some would have us believe.", is lacking something rather important. Who actually said it?
In climate science, nobody ever said it. That's because climate science covers everything that affects the climate. If you don't include everything, it would be like trying to find out how an internal combustion engine-powered car works, using as an example one without a crankshaft. The talking-point looks more like an example of a straw man fallacy, in which an argument, claim, or opponent is invented, and then shot down in flames, point-scoring being the idea. One sees this a lot in politics, but not in science.
Through science, we know that Earth's climate is affected by a myriad of drivers that operate on timescales varying from seasons to tens of thousands to tens of millions of years. We've investigated them in depth and we continue to do so. We understand which ones act as 'radiative forcings' - the external, independent primary drivers that determine whether energy is being added to or removed from the system. We likewise understand which ones act as 'feedbacks' - secondary drivers that determine how energy is moved around within the system.
The very nature of science is that it is an ongoing self-correcting process in each and every discipline. So we do understand the key forcings and feedbacks that operate within our climate and on what time-scale they occur. CO2, along with the other greenhouse gases, is but one of these factors.
Before you get too relaxed, however, of all the variables out there, CO2 is the one that has seen a huge change. Since pre-industrial times its concentration has gone up by a whopping 50%. Just imagine if a change of that amount occurred with another part of the climate system. How about the strength of sunlight going up by 50%?
Ironically, at the time of writing (early 2024), there is a lot of discussion as to why 2023 was so warm. The heat came on particularly in the second half of the year, coinciding with the onset of strong El Nino conditions in the Pacific Ocean. But normally there's a lag between El Nino starting up and peak temperatures. Did the injection of unusual amounts of water vapour into the upper atmosphere by the Hunga Tonga-Hunga Ha'apai volcano have a hand? Possibly. Did the cleaning-up of sulphate aerosol-generating shipping fuels partially remove a well-known negative or cooling feedback, and if so by how much?
The trouble is that scientific investigations involve a lot of careful hard work and that takes a lot of time. For people more used to the instant answers of politicians, that might be disappointing, but there's a difference. Science requires evidence, politics less so.
Please use this form to provide feedback about this new "At a glance" section. Read a more technical version below or dig deeper via the tabs above!
Further details
If you have read the at-a-glance section, you will have already realised that the myth that some climate scientist said, "CO2 is the only driver of climate change", is a good example of a straw man fallacy in which an argument, claim, or opponent is invented, and then shot down in flames. But for completeness, let's take a quick look at some other drivers of Earth's climate system.
Natural processes have determined Earth’s climatic history for its 4.56 billion year long existence. However, right at the very end of that time-line, humans have come along and deliberately brought significant change to one mechanism that is driving Earth’s climate into the future.
At any given time, the Earth’s climate is subjected to a myriad of natural climate forcing and feedback processes. The impact of each varies with the magnitude of the natural change. It varies with the duration over which the change occurs and whether or not that change is part of an overall repeated cycle. Cyclic variations tend to cancel themselves out over time. However, remember that time may be orders of magnitude greater than a human lifespan.
Processes that have historically altered the face of the planet include things like cycles in the Earth’s orbit around the Sun or shifts in the planet's tectonic plates. Orbital cycles are potent enough to trigger periods of glaciation in the current Icehouse climate state on Earth. They can also bring us back out of ice-ages, with the help of amplifying climate feedbacks. These large changes take place over tens of thousands of years.
Plate tectonics rearranges continents. It brings them to collision, throwing up mountain ranges. Or it rifts them apart, creating new oceans in the process. But these changes are very slow. Tectonic plates, at their fastest, only move at the same rate at which human fingernails grow, Such geographical rearrangements typically occur over millions of years.
While not nearly as dramatic, the influence of solar, ocean and wind patterns is much more immediate. The El Nino Southern Oscillation (ENSO) is a good example. But the warm phase - El Nino - has a cool counterpart - La Nina. These phenomena swing between warming and cooling respectively, over the course of months to years. So they roughly cancel one another's effects out. Having said that, there are decades during which La Nina or El Nino has been predominant, such as the period from 2000-2012, once popularly referred to by climate science deniers as 'the pause'. All consigned to the dustbin of history now, of course. ENSO involves heat being moved around within the climate system. In a La Nina-dominated decade, that heat is mostly going into the oceans. That's what actually happened in 2000-2012.
Volcanic eruptions and impacts from celestial bodies such as asteroids have a near-instant effect. Luckily though, very few of these one-off events are of sufficient size to impact the global climate for more than a few years. That was not always the case in the deep past, which is why we invest in monitoring such things carefully.
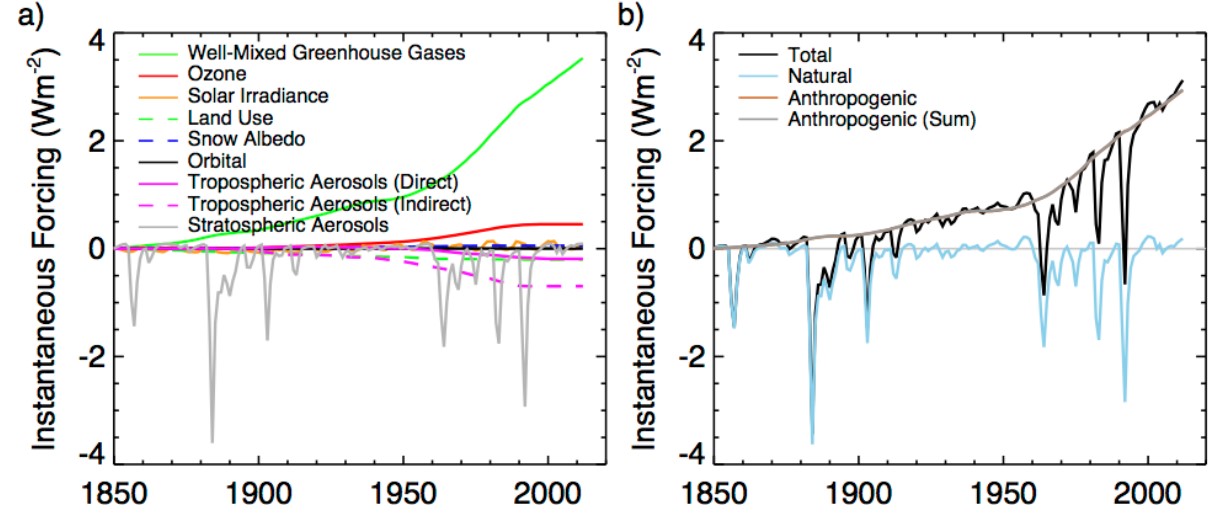
Fig. 1: Instantaneous radiative forcing at the tropopause (W/m2) in the E2-R NINT ensemble. (a) Individual forcings and (b) Total forcing, along with the separate sums of natural (solar, volcanic and orbital) and anthropogenic forcings. Source: GISS.
The industrially-driven increase in CO2 and other greenhouse gases to the atmosphere profoundly differs from such natural processes. This human influence is happening very rapidly (fig. 1). It is not cyclical and it pushes the climate continually and relentlessly in the single direction of warming. And we know we are doing it.
No other species has done this intentionally. The cyanobacteria that oxygenated Earth's atmosphere, starting around 2,450 million years ago, did cause major climatic change as a side-effect. However, nobody can seriously accuse them of having done it on purpose.
Other human-related factors need to be considered too. They include changes in land use, emissions of carbon soot and aerosols. These are all likewise studied individually. However, their net impact is cumulative. Likewise, over the last 50 years of satellite observations of the Earth’s climate, all natural influences have been studied in detail. These include orbital variations, solar output, volcanic activity and changes in both surface and cloud-top albedo. Oceanic fluctuations such as ENSO and the Pacific Decadal Oscillation (PDO) have likewise been tracked as they vary back-and-forth through time.
Natural processes will continue to introduce short term variability in our climate. However, the relentless rise of CO2, now 50% up on pre-industrial levels, has become the dominant factor in determining our planet’s climate now and in the years to come. Other factors like those mentioned above will manifest from time to time over the short term: warmer and cooler years, sometimes singly, sometimes in clusters. These form the irregular noise on temperature graphs (fig. 2) and Realclimate has an interesting recent discussion on the record-breaking 2023 and the factors responsible here. But the bottom line is that all of the graphs show that same long term trend. Upward.
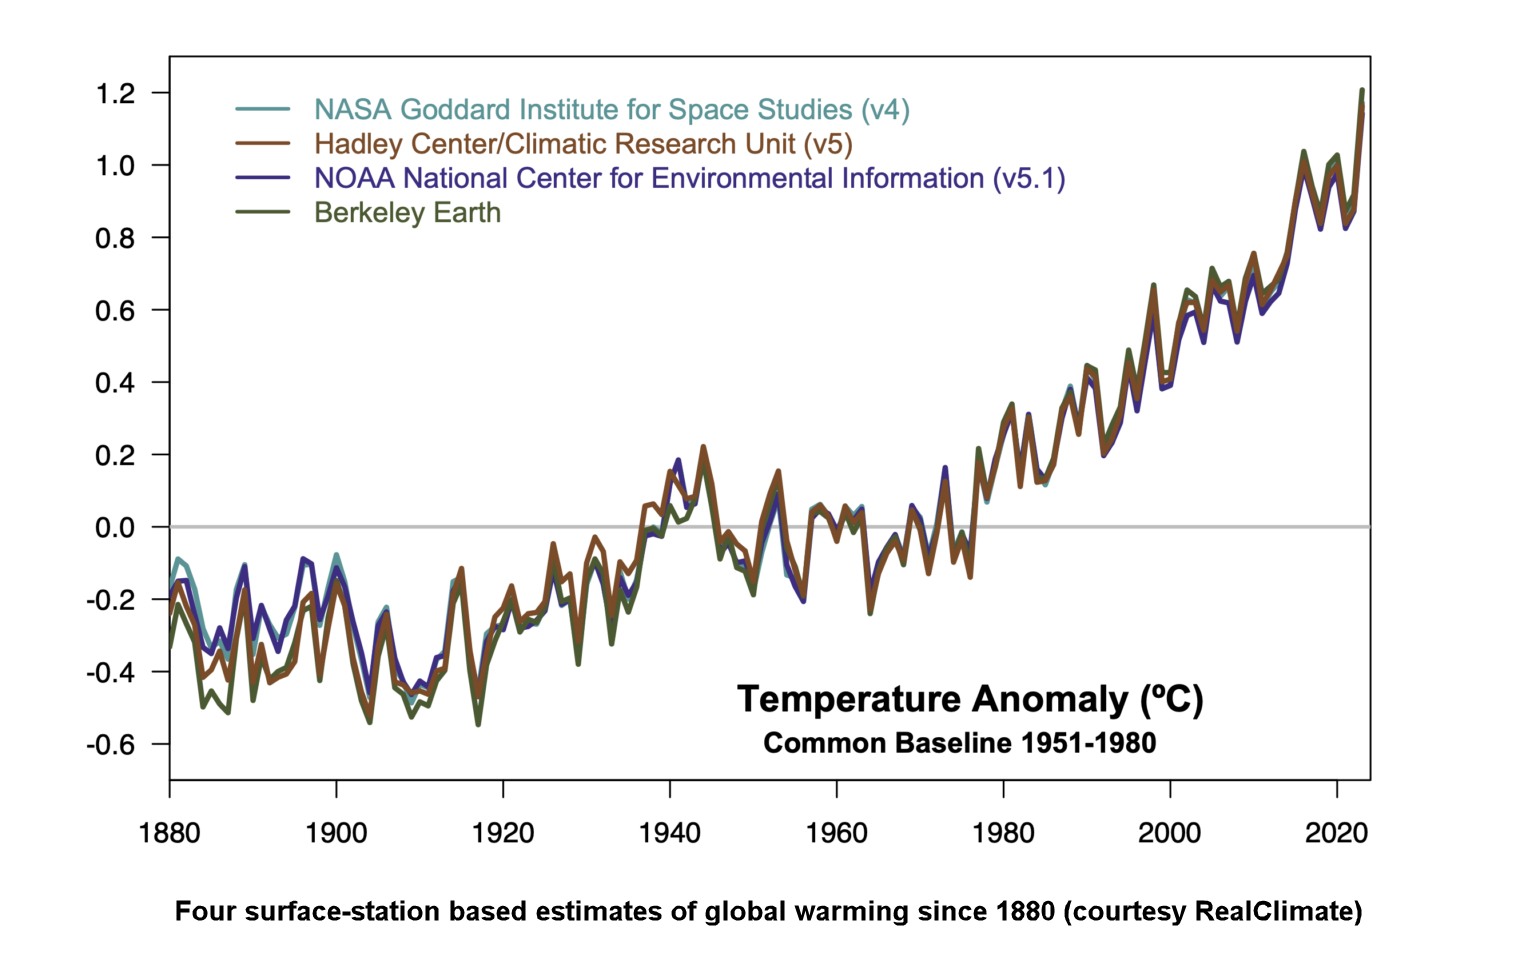
Fig. 2: up and up. Graphic: RealClimate.
Last updated on 26 May 2024 by John Mason. View Archives


Ken Kimura @24, anthropogenic aerosols are well known because the types and quantities of fuels burnt in various countries are well known, and so the production levels are known. Similarly, for volcanic aerosols, the size, force and duration of volcanic activity is also known, given an approximate indication of volcanic aerosol production. More importantly, aerosols are found in ice cores from Greenland, Antarctica, the Rockies, Andes and Himalayas, and also from Mount Kilimanjaro and (I believe) Mount Kenya from tropical Africa. The aerosol density at different levels in the ice cores can be compared to equivalent density levels in recent cores, which are then correlated with satellite measurements of aerosol optical depth. Combined, these give a reasonable though not perfect measure of aerosol optical depth going back hundreds of years.
Ken Kimura @24.
I find your comments curious, extending as they do initially beyond this thread. Note here @24 you say you intend a couteous enquiry and see nothing to suggest you are not doing so. This is followed by a set of questions that imply you consider the person you address to be, if not sincere, not to be trusted. "...this claim of yours." "How can you be sure..."
The science being discussed here is not anybody's personal property. Scientific knowledge is open access thus owned by all. That is what makes it so powerful. (Having written this, I am conscious that I now embark on addressing questions that do have ownership and with answers that have a single author and so could be wholly disowned elsewhere.)
Picking up a word in your questioning @24, "How did they measure the stratospheric aerosol density during the period?", you might find Sato et al 1993 a worthwhile read (PDF here). This paper predates the appearance of the ice core data which has allowed the record to be extended back before 1883 with far greater confidence and accuracy.
Further, I am mindful that there may be a not-uncommon misconception buried within your various questions. You perhaps are of the view that early indstrialistaion was entirely driven by fossil fuel use, initially exclusively coal, and if this were so would we not have had from its earlierst times CO2 emissions & SO2 emissions in a constant proportion (until SO2 pollution was reduced in the 1970s). However, the contribution of mankind's rising CO2 emissions from burgeoning coal use only overtook the mounting emissions from low SO2-emitting wood burning in the 1910s, apparently. (CDIAC FF data & CDIAC LOC data.)
Perhaps for completeness, I should add that the forcing from GHGs in those early decades is often dismissed as too small to have significantly affected global temperatures pre-1940. Yet, if you examine the rise of atmospheric CO2 since pre-industrial times (IPCC AR5 data to 2011here), 27% of today's atmospheric CO2 rise causing 31% of today's CO2 forcings were present by 1940. And with their slower increase, the temperature response would likely be closer to 40% of today's total. But saying that we should be sure not to forget "CO2 is not the only driver of climate."
billev
Following on from the previous post here.
This topic is about the other driving factors behind climate so worth reading first.
Firstly, a smaller point, the rise in the earths heat content may not be monotonic because there is a seasonal cycle. The earth absorbs more sunlight during the southern hemisphere summer when the darker (all that ocean) southern hemisphere is pointed more towards the sun This seasonal cycle may be large enough to overwhwlm the warming from CO2 etc for a year or so, thus on a seasonal scale the rise may not be monotonic. However the rise in total heat content should be roughly monotonic on timescales of multiple years.
Then there is another assumption you are making that isn't correct. You are assuming that the temperature change, thus the heat accumulation, will all happen in the atmosphere and that thus the atmospheric temperature should rise nearly monotonically. However less than 2% of the aded heat is going into the atmosphere; most, around 93%, is going into the oceans.
At the same time there are internal energy transfers that occur between the atmosphere and the oceans and since the oceans have hugely more thermal mass than the atmosphere a small flow from the oceans to the air, relative to the heat capacity of the oceans, can constitute a significant change in temperature for the atmosphere. As a result, atmospheric temperatures are a very 'noisy' signal; variations due to this internal variability can mask any underlying trend for significant periods, and the resulting temperature rise, of the air, won't be monotonic. The standard timescale defined by the World Meteorological Organisation to be used to detect climate changes in the atmosphere is 30 years. Running averages over 30 years or so should show roughly monotonic change. Anything on significantly shorter timescales would be more fortuitous, depending on the vagaries of internal variability.

There is another approach. Since most of the extra heat is going into the oceans, we would expect the heat increase there to be roughly monotonic. And it is.
This is the heat increase of the top 2000 meters of the ocean, which is a bit over half its volume. Apart from a seasonal signal you can see it is quite monotonic. A few dips associated with volcanic eruptions in 1982 and 1992, and a dip around the time of the big El Nino in 1998. Also some variation during the 60's but instrument coverage back then wasn't very good and there was likely some significant aerosol cooling before the various Clean Air Acts started clearing up air pollution. But since then, broadly, it is very monotonic. And in fact, the rate of heating is increasing, which is what we would expect with CO2 levels rising.
Glenn's post immediately above this one is in response to several comments by billev over on this thread. In billev's last comment, he said:
I am wondering, billev, just exactly what you would accept as convincing evidence that CO2 is having an effect. From the statment quoted above, it would appear that you want to see no variation from a continuous rise in temperature. That is a suprising expectation, because for it to be true, then rising CO2 would have to have two effects:
That would make CO2 one heck of a dominating factor, and it is so unreasonable that I think that such a belief falls into the category of "Impossible Expectations" in the five characteristics of science denial:
...but that may not be what you intended to mean, billev, when you made the statement I quoted above. If not, please feel free to expain further just what you expect in the way of evidence - what would convince you?
Argggh. On editing, after a failed attempt to post, I missed the links to biilev's original comment. It is here. The thread is on this post.
When I say contiuous warming I am referring to those parts of the NOAA graphs of Global mean temperature from around 1910 until the early 1940's and from about 1974 until around 2002. I made no reference to the fact that those temperatures are obviously subject to the effects of other factors. There is currently a World wide debate over whether or not to move from the use of fossil fuels in order to reduce the production of carbon dioxide because it is causing global warming. What measurements have been made to show how much of the amount of temperature rise since around 1910 can be directly attributed to the rise in carbon dioxide levels?
[TD] Click the Intermediate tab in this post.
billev: "I made no reference to the fact that those temperatures are obviously subject to the effects of other factors."
Yet such a conclusion is the logial consequence of your statement that you expect "that temperature rise should be continuous like the steady, and accelerating, rise of CO2 in the atmosphere". You can't evade the logical consequences of your position by saying "I didn't say that". If you agree that your original statement is in conflict with your actual position, then please say so.
As for measurements showing how temperatures since 1910 can be attributed to various factors, please look at the graphs in comments 2 (author's response) and 23, and read the text that describes them. In fact, read the entire chain of comments.
Billev, what is done is to measure all the of known forcings acting on the climate and recalculate onto a common basis (as if change in radiative input at the top of atmosphere). See the graph in comment 2 or 23. (In fact read the responses to Kimura). What theory would predict, is that climate would follow the net forcing. ie sum up all the positive and negative forcings. This is discussed in some detail on this post.
These are the measurements behind the attribution. You have already agreed that energy is not magically created and that climate change must have some cause.
The relevant figure is:

This is for surface temperature record. It is more striking for Ocean Heat Content which so far you have avoided, despite it being a considerably less noisy record than surface temperature. (The noise is surface temperature is ocean/atmosphere heat exchange.)
Note also that you can run models with only natural forcings, only anthoprogenic forcings, or both. The results are these (IPCC TAR).
Note that anthropogenic works better than just natural, but both is closest.
Now it is good to be skeptical and demanding a high level of certainity in drawing conclusions, but I notice that you seem to be only applying that to the question of whether CO2 causes this. You stated here
that you " I would tend to think it is an alteration in the Earth's relationship with the Sun". Where was the evidence that gave you that suggestion and did you look for the proof? The orbital forcings are extremely slow, but have been negative (would cause cooling) for millenia.
The anthropogenic hypothesis passes the test of conforming to all we know about the physics of climate. The predictions made by the science (if not the strawman versions erected by pseudo-skeptics) fit extremely well with actual observations. I do not believe you can make that claim for any other potential cause of climate change.
billev
You seem to be assuming that the clearest correlation between rising CO2 and some climate signal will be against the surface air temperature record. Thermodynamically, this isn't reasonable, your apparent underlying premise is wrong.
The logic is as follows:
Near monotonic increase in the heat content of the oceans is the strongest, clearest expected signal based on the thermodynamics. Unfortunately air temperatures are the dataset of most interest to us since that is where we live. But they aren't the primary evidence of the underlying process, ocean heat is.
If you look at the graph in comment 2 above, although it doesn't show the most recent years, it gives a good indication of what was happening in the first half of the 20th century.
In the late 20th century:
And very importantly, prior to 1957 we dont have any meaningful data on ocean heat content. So we can't usefully investigate the extent that atmospheric warming may have been driven by heat transfers out of the oceans. So we need to be careful to not draw more conclusions than can be justified from the more limited evidence from the early 20th century. There is some evidence tentatively suggesting that the early 20th century warming was particularly in the Arctic, possibly suggesting a change in ocean currents in the North Atlantic.
The data for climate change is a jigsaw puzzle, with clearer pictures in more recent decades and less certainty earlier on. But when the first analyses of past ocean heat content changes appeared around the turn of the century they were rightly labelled 'the smoking gun'.
Atmospheric temperatures are incredibly important to us since they reflect what is happening where we live. But thermodynamically the changes in the ocean are the biggest piece of evidence.
To state that CO2 at one cubic foot per every 2500 cubic feet of atmosphere is the leading driver of climate seems illogical to me. Since 1880 there is a strong indication of a definite pattern of warming and pauses in that warming that does not appear to be compatible with CO2 being the the principal cause of the warming. The various alternating periods of pause and warming have occurred on what appears to be a consistant schedule. This makes it difficult to believe a constantly increasing entity such as CO2 or random climate effecting incidents are influencing this pattern of temperature change.
[RH] Note that, your lack of understanding the science does not mean that the science is illogical.
Please note that posting comments here at SkS is a privilege, not a right. This privilege can be rescinded if the posting individual treats adherence to the Comments Policy as optional, rather than the mandatory condition of participating in this online forum.
Please take the time to review the policy and ensure future comments are in full compliance with it. Thanks for your understanding and compliance in this matter.
You claim that small concentrations of CO2 affecting temperature is illogical, but try here to check your grasp of what is logical.
Now try this for logical.
Statement A: "pauses in that warming that does not appear to be compatible with CO2 being the the principal cause of the warming."
Statement B: "temperatures are obviously subject to the effects of other factors."
See the problem? What is more, both myself and Glenn have demostrated to you that when you take into the "other effects", the temperatures are accounted for. Did you somehow fail to read our posts, or do you just have trouble comprehending things that conflict what you want to believe? I would note, that our demostrations were not simply "hand-wavy" points but quantitive based on physics and measurement.
"The various alternating periods of pause and warming have occurred on what appears to be a consistant schedule."
Not that I can see at all. How about you put up some evidence to back what you believe instead of just making wild assertions and ignoring responses? Did you base your conclusions on facts you have studied or what you would prefer to believe?
Current climate theory (asserting that earth's climate is changed by the net forcings, natural and manmade) is able to account for present and past climate change, qualitatively and quantitively, using only known physics. By contrast you seem to believe that instead climate is changed by some unmeasurable, undetectable natural cause which is nonetheless accumulating heat in our oceans at rate of 4 hiroshima bombs/sec. Now that to me defines illogical.
Ignoring responses that people make to you and simply repeating wild assertions without evidence is sloganeering and not permitted on this site.
billev @35, the dry mass of the atmosphere is 5.352 x 10^18 kg. In 1883, Krakatoa errupted, ejecting 2 x10^10kg, or 3.7 parts per 1000 million of sulfur into the atmosphere. That became the dominant change of effect on climate for the subesequent few years, reducing global mean surface summer temperature by 1.2 C in the following year. The effects of the erruption are described by wikipedia, saying:
By your reasoning that the amount of CO2 in the atmosphere is too small to have a significant effect, it follows that Krakatoa could have had not effect on the climate as well, and the reports above are pure nonsense.
The Sun shines steadilly, producing from 1360 W/m^2 to 1361.6 W/m^2 at the Earth's mean orbital distance over the entire historical sunspot record. That variation of 0.06% of insolation, or 600 parts per million, is considered to be the major driver changes in the Earth's climate by some people. By your reasoning with regard to CO2, however, it can have no effect. That is particularly the case given that the current increase in CO2 concentration relative to the preindustrial changes the Earth's energy balance (all else being equal) by 1.9 W/m^2 or (once albedo is accounted for) by 69.6% more than the difference between the Maunder Minimum and the grand solar maximum of the 1950s.
In essence, if your argument was valid against CO2, there are no changes in the Sun's radiation or atmospheric factors that could make any difference to the Earth's climate.
Of course, your argument against CO2 amounts to an argument from incredulity. It is not an example of reasoning, but of irrationality masquerading as reason. The Dilbert quote in the above link is apposite.
billev:
Your first sentence falls into the myth "CO2 is just a trace gas". (Follow the link to see why that is wrong. Same link that scaddenp posted.)
There seems to be quite a bit that you just "can't believe". It's not a strong argument. (It's not an argument at all, as Tom points out in his last paragraph.) If all you can do is keep saying you can't believe stuff or don't see proof, then you'll soon get moderated out for repetition.
[And I'll bow out, for now, to avoid the policy against dog-piling.]
I will try to address the several statements directed to me. First, the Krakatoa example is not a good one. There is no comparison between the effect of the current level of CO2 and the effect caused by the gas and ash disgorged by the eruption of Krakatoa. The graph showing the relationship between various forcings and the temperature record causes me to wonder why these forcings would follow such a reasonably precise 30 year pattern. I would not think a continually increasing presence of CO2 would follow such a timed pattern. If opposed forcings caused the pauses in warming then, again, why such a patterned occurence? One earlier post informed me that the warming pause in the 1950's and 1960's was caused by the presence of aerosols What then caused the, "on schedule" beginning of another pause shortly after 2000? As far as the argument that small amounts can be effective I say that that is not always the case. A one inch thick sheet of steel can stop a small arms bullet but a 1/2500th of an inch thick sheet of steel cannot. If a person cannot detect a rather precise pattern of warming and pause in warming in the Global temperature record starting in 1880 I can only say that to me the pattern is obvious. Whether it will continue in the ensuing years who can say. But I do believe that more attention should be paid to that distinct possibility. It would seem to offer a better prediction of future temperatures than most of the computer models have done.
[RH] Note that your comment here has a complete lack of supporting evidence or citations of any research in support of your position. We expect a little bit more from commenters on SkS than most other websites. You're more than welcome to argue your position but you're currently skating along a thin line of sloganeering. If you wish to retain your commenting privileges you're going to have to up your game a few notches.
Alternatively, if you're here to try to learn something new about these issues, please acknowledge that you don't understand the science and other commenters who are knowledgeable will be more than happy to supply you with information, along with the requisite citations to review.
billev @39:
Argument by assertion is likewise an example of irrationality masquerading as rationality. It is also an example of 'sloganeering', as defined and prohibited in the comments policy.
As the argument stands, you have supported your argument from incredulity by an analogy (bullet and steel sheet) but merely assert that the analogy applies with respect to CO2 increases, but does not apply to the much smaller (as measured by parts per million by mass) injection of SO2 into the atmosphere by Krakatoa.
Perhaps you should support your claim by some basic facts, such as:
A) The preindustrial CO2 level raised the Global Mean Surface Temperature (GMST) by approximately 33 C (12.8%) relative to what it would have been in the absence of CO2.
B) CO2 levels have risen by 43% since the the preindustrial.
C) Therefore it is obvious because very thin sheets of steel will not stop a bullet that the increase in CO2 could not have had any effect on GMST.
I can then introduce you to the idea of a non-sequitur.
More seriously, as this example argument demonstrates, you rigourously refuse to quanitify your argument because any such quantification (if not ridiculous based on known facts) will show your argument to be an absurdity. Instead you rely on arguments from incredulity, from assertion, and from unjustified analogies. Specifically to your analogy, you have not shown that the preindustrial CO2 concentration has no effect, so that it is analogous to a steel thickness which has no effect.
billev: "What then caused the, "on schedule" beginning of another pause shortly after 2000?"
What pause? It's already been pointed out to you that most (90%+) of the accumulating energy is being stored in the oceans, and much less (3-5%). is being stored in the atmosphere. Why would you base your arguments about warming on such a small sample of the climate system? This is akin to reviewing a restaurant after having had a bite of appetizer and a drink of tap water. Ocean warming shows no "pause."
Further, you do realize that the greenhouse effect has been directly observed, yes? Surface-based instruments have measured down-welling longwave radiation from the atmosphere for a while now. So you can make baseless claims about the greenhouse effect not being real, but you're simply wasting time.
Actually I am starting to think billev is just trolling. He has so absolutely refused to look at the OHC record despite it being a better measure of global warming that surface temperature. Now why would that be? Tom has pointed out his outrageous claim that Kraktoa comparison is invalid. (If 400ppm of CO2 is "too insignificant to affect climate", then how come 3.9ppm of something else can?). He keeps going on about thickness of steel as if this was somehow relevant. (We can calculate whether given thickness of steel could stop a bullet just as we can calculate effect of 3w/m2 of extra radiation). If he is just here to have amuse himself at our expense, then I suggest "Do Not Feed The Troll."
The obvious alternative is that he has a cognitive bias against AGW from either ideology or group identity that prevents him comprehending any contrary fact, which also means we are wasting our time in trying to educate.
Because "the something else"(sulphur dioxide) combined with moisture to form long- lived high altitude clouds which screened the Earth from the Sun's rays and caused cooler temperatures. My steel sheet comments were in answer to the comments that pointed out how various small quantities could be effective, My point is that not all small quantities are effective. The current attempts to steer public opinion about man-made warming usually refer to the temperature records published by NOAA and GISS. My statement about the pause starting about 2002 is based on how I interpret those published records. I might add that I am not alone in that interpretation. I also am of the opinion that once the current EL Nino ends then the pause will reassert itself and continue until about 2032. I base that opinion upon the pattern of previous temperature change since 1880.
So you agree that a very small amount of something can make a big difference after all. Want to try understanding why small increases in CO2 combine with other things to have a big effect as well?
" I also am of the opinion that once the current EL Nino ends then the pause will reassert itself and continue until about 2032. I base that opinion upon the pattern of previous temperature change since 1880."
Wow, that is bold assertion from someone refusing to understand physics. Still believing in the imaginary undetectable natural forces. I could do with some extra towards retirement saving. How much are you willing to bet on that?
"The current attempts to steer public opinion about man-made warming usually refer to the temperature records published by NOAA and GISS."
Clearly you have not actually read the IPCC reports. The surface record is important because we live on that surface. However, it is also very noisy because a small amount of energy exchange between ocean and atmosphere make a big difference to surface temperature. These are also unpredictable, though short in duration, and fool people into seeing patterns that dont exist if you bother to use something other than eyeball to analyze. The Ocean Heat Content does not have this problem and so is a better diagnostic of heat build up. Show me your cycle in that record. Show me any indication that build of CO2 has not continued to heat ocean. Do tell me where this energy in the ocean is coming from if not from anthropogenic.
billev @43:
Crucially for Billev, it is an untested opinion. It is only be not testing his opinion against data that he is able to retain it.
In fact, several people have already made proposals of a similar nature to Billev's claim that the pattern of temperature will repeat themselves. Specifically, Don Easterbrook has argued for a near repetition of the pattern; Akasofu has argued more abstractly that the temperature pattern is a gradually rising trend modulated by a sine function and short term variations; and Loehle and Scafetta have argued for a repeating, rising temperature pattern accelerated since 1970 by global warming. As the linked articles show, none of these projections of temperature based on a cyclical pattern have been successful.
Billev's own theory is indistinct. He clearly rejects any forcing effect from CO2, and so cannot accept Loehle and Scafetta's projection. He thinks the "cooling pattern" that he expects to repeat from 2000 onwards was evidenced in the "early 1940s" which does not align with the repetition from 1945 used by Easterbrook. It is possible that he accepts a view similar to Akasofu's, but he is not explicit enough to be sure. Regardless, neither a repetition of the 5 year running mean from 1940 (to match the early 1940s projection) or the Akasofu cyclical function matches the post 2000 temperature function:
Billev's theory is a bust - something he does not know because he never quantified it and checked it against the data. That is, he used feels to develop his theory, not reasoning, and certainly not scientific method.
As Billev seems to have dropped discussion of the role of CO2 as a climate forcing, his remaining thesis is not on topic in this thread. I would highly recommend that if he wants to defend his busted theory, discussion be moved to the theory that he thinks most closely resembles his (from the three links above), or failing that, to the general discussion of different projections here.
Has there ever been any testing to examine the relationship beween the temperatures measured by the official measuring sites and the surface temperature at those sites? It would seem to me that if the two changed proportionately then that would indicate that the surface temperature was the driver of that sites's measured temperature. If the relationship was not proportional than it would appear that something in the atmosphere influenced the site's measured temperature. As far as there being a continuation of the pause that began around 2002 and should continue until about 2032, if the experience since 1880 continues, we will have to wait and see. I am too old to bet. i won't be around to collect. If the temperature record does plainly show a level line of global mean air temperature for the period in question it apparently won't be "seen" by those who are dubious about my remarks. And by the way, I don't have a theory about trhe future. I merely state that the past record seems to indicate a pattern of rise and pause that, if it continues, will be repeated in the future.
Billev, it's easy to see patterns. That, in fact, is the human brain's extraordinary strength. Critical thinking is a systematic way of testing the strength of apparent patterns. You're failing at critical thinking because you refuse--for no apparent reason--to accept that CO2 absorbs and emits radiation at various broadened bands within the thermal infrared range. That action--the central component of the greenhouse effect--has been established in lab for over a century, established through applications that rely on the effect's existence, and established through direct field measurement.
If atmospheric CO2 increases, the climate system will store more energy. Whatever alternative theory you propose, it must include that actually-verified component. If you refuse to include that component, then your theory is never going to describe the Earth climate system. It's like trying to explain human history without referring to economy.
Tom,
I do not remember seeing Krakatoa used as an example against the "CO2 concentration is too low to make a difference" argument. I thought it was an excellent argument since it is weather and the concentration of SO2 is so much lower than CO2. Thanks for the new argument.
billev @46 now claims to not have a theory despite previously asserting:
Of course, if he had an opinion about future temperatures trends, he had a theory about future temperature trends. It may be a "dinky little theory", but it is a theory none-the-less, even if he want's to deny that when faced with its refutation.
He now retreats back to a mere tautology, that:
Well of course if the pattern is in fact continued, it will continue into the future. That is what continued means. But the graph @45 has already shown the pattern has not continued. And therefore as the antecedent of your tautology is false, so also is the consequent.
I have just reviewed several charts of temperature history from a variety of sources including NOAA and NASA and they indicate a pause in warming starting about 2002. None of the charts I reviewed appears to be similar to the chart @45. What about my question @46?