


 Arguments


Recent Comments
1 2 3 4 5 6 7 8 9 10 11 12 13 14 15 16 Next
Comments 1 to 50:
-
Bob Loblaw at 02:02 AM on 2 June 2024On Hens, Eggs, Temperature and CO2
To continue, one nice new example that appears in this blog post is the accelerator versus the brake analogy. The OP does a nice job of describing the natural carbon cycle, pointing out that the natural portions of the cycle include both emissions and removals - adding to and subtracting from atmospheric CO2 storage.
Koutsoyiannis et al basically assume that if there are changes in atmospheric CO2, they must be linked to something that changed emissions. As the OP points out, the likelihood is that the correlation Koutsoyiannis et al see (in the short-term detrended data set they massaged) is more likely related to changes in natural removals.
Once again, Koutsoyiannis et al do not realize the limitations of their methodology, ignore a well-known physical process in the carbon cycle (rates of natural atmospheric CO2 removal), and attribute their correlation to the wrong thing. The right thing isn't in their model (statistical method) or thought-space (mental model), so they don't see it.
The OP's bathtub analogy is useful to see this. The diagram (figure 4) looks at the long-term rise in bathtub level (CO2 rise), but it is easy to do a thought experiment on how we could introduce short-term variability into the water level. There are three ways:
- Short-term variability in the natural emissions (faucet on the left).
- Short-term variability in the human emissions (faucet on the right).
- Short-term variability in the natural sinks (drain pipe on the lower right).
The bathtub analogy is similar to the water tank analogy that is used in this SkS post on the greenhouse effect. The primary analogy in that post is a blanket, but the level of water in a water tank appears further down the page.
In short, the Koutsoyiannis et al paper ignores known physics, fails to incorporate known physics in their methodology, and comes to incorrect conclusions because the correct conclusion involves factors that were eliminated from their analysis from the beginning.
-
Bob Loblaw at 01:31 AM on 2 June 2024On Hens, Eggs, Temperature and CO2
Yes, this blog post does a really good job of outlining the correct scientific background on atmospheric CO2 rise, and pointing out the glaring error that Koutsoyiannis et al have made.
The recent paper is a rehash of an earlier Koutsoyiannis paper that is allude to but not specifically linked in the OP and comments. The OP does subtly link to a rebuttal publication of that earlier work (link repeated here... You'll have to verify you're not a robot to get to the paper). As Dikran has pointed out, the authors appear to have doggedly refused to accept their error.
Both the current Koutsoyiannis et al paper and the earlier one have threads over at PubPeer:
- The current paper only has one short comment.
- ...but the earlier paper has more extensive comments, including more detail on the criticisms Dikran mentions here in comment 1.
...and as Dikran mentions, this basic error is an old one, being repeated again and again in the contrarian literature on the subject. Two Skeptical Science blog posts from 11 and 12 years ago discusses this and similar errors. Plus ca change...
The blog And Then There's Physics also posted a blog on the earlier papers.
The importance of the differencing scheme used by Koutsoyiannis et al cannot be overstated. I hate to inject that dreaded word "Calculus" into the discussion, but if you'll bear with me for a moment I can explain. Taking differences (AKA detrending) is that dreaded Calculus process called differentiation - taking the derivative. This tells you the rate of change at any point in time - but it does not tell you how much CO2 accumulates over time. To get accumulation over time, you need to sum those changes over time - in Calculus-speak, you need to integrate.
The catch is, as Dikran points out, that taking differences has eliminated any constant factor - in Calculus-speak, the derivative of a constant is zero. And when you turn around and do the integration to look at how CO2 accumulates over time (basically, undo the differentiation), you need to remember to add the constant back in. Koutsoyiannis et al fail to do this, and then make the erroneous conclusion that the constant is not a factor. Their method made it disappear, and they can't see it as a result. David Copperfield did not actually make that airplane disappear - he just applied a method that hid it from the sight of the audience. (Of course, David Copperfield knows the airplane did not disappear, and is just trying to entertain the audience. In contrast, it appears that Koutsoyiannis et al are fooling themselves.)
At least introducing Calculus to the discussion give me a chance to mention one of my two math jokes. (Yes, I know. "math joke" is an oxymoron. Don't ask me to tell you the one about Noah and the snakes.)
Two mathematicians are in a bar, arguing about the general math knowledge of the masses. They end up deciding to settle the issue by seeing if the waitress can answer a math question. While mathematician A is in the bathroom, mathematician B corners the waitress and tells her that when his friend asks her a question, she should answer "one half X squared". A little later, when the waitress returns to the table, A asks her "what is the integral of X?". She answers as instructed, and mathematician A sheepishly pays off the bet and admits that B was right. As the waitress walks away, she is heard to mutter "pair of idiots. It's one-half X squared, plus a constant".
-
Dikran Marsupial at 23:44 PM on 31 May 2024On Hens, Eggs, Temperature and CO2
The earlier paper by Koutsoyiannis et al.
"Deep doubts, deep wisdom; shallow doubts, shallow wisdom" – Chinese proverb
which seems somewhat ironic at this point.
-
Dikran Marsupial at 23:41 PM on 31 May 2024On Hens, Eggs, Temperature and CO2
Good article!
Koutsoyiannis et al. have made essentially the same mathematical blunder that Murray Salby did ten years ago (and he was far from being the first), which I covered here:
https://skepticalscience.com/salby_correlation_conundrum.html
Correlations are insensitive to constant offsets in the two signals on which it is computed. The differencing operator, Δ, which gives the difference between successive samples converts the long term linear trend in the signal to an additive constant. So as soon as you use Δ on both signals, the correlation can tell you precisely nothing about the long term trends.
When the earlier work was published in Proceedings of the Royal Society A, I communicated this error to both the authors of the paper and the editor of the journal. The response was, shall we say "underwhelming".
The communication (June 2022) included the observation that atmospheric CO2 levels are more slowly than the rate of fossil fuel emissions, which shows that the natural environment is a net carbon sink, and therefore the rise cannot be due to a change in the carbon cycle resulting from an increase in temperature. It is "dissapointing" that the authors have published a similar claim again (submission recieved 17 March 2023) when they had already been made aware that their claim is directly refuted by reliable observations.
Moderator Response:[BL] Link activated.
-
michael sweet at 02:45 AM on 30 May 20242024 SkS Weekly Climate Change & Global Warming News Roundup #21
There was an article today in The Guardian about the health benefits from currently installed renewable energy. The original study is here.
Installing wind and solar from 2019 to 2022 resulted in reductions of SO2 and nitrogen oxides NOx in the USA. Both these cheicals cause respiratory damage. They found that the reduction of pollution resulted in $249 billion dollars in health and climate benefits. I note that these benefits will continue for the foreseeable future and will be much greater than the cost of installing the renewable energy. In addition, the renewable energy is cheaper than fossil energy.
Jeremiah Johnson, a climate and energy professor at North Carolina State University who was not involved in the study said :
The public “is often focused on the challenges we face” when it comes to ecological damage, he said. “But it is also important to recognize when something is working.”
It would be interesting to see what David-acct thinks about these massive savings from installing renewable energy.
-
BaerbelW at 02:38 AM on 29 May 2024Mastering FLICC - A Cranky Uncle themed quiz
OPOF @2
Thanks!
felixscout @3
Thanks for the feedback! The link is actually correct as it's the summary page for all of the cartoons regardless of language. They show up sorted alphabetically in blocks: German (DE), English (EN) and Dutch (NL), so there's unfortunately some scrolling involved.
-
felixscout at 21:11 PM on 28 May 2024Mastering FLICC - A Cranky Uncle themed quiz
Thank you for this.
The one issue I discovered was, when going through the answers after submitting the quiz the link to the correct cranky uncle cartoon linked to the german version.
-
One Planet Only Forever at 02:05 AM on 28 May 2024Mastering FLICC - A Cranky Uncle themed quiz
BaerbelW,
I think that the 'standard' response that is provided to a wrong choice was a good response. A person taking the quiz to learn would be inclined to review the FLICC information and try again.
-
BaerbelW at 14:52 PM on 27 May 2024Mastering FLICC - A Cranky Uncle themed quiz
Thanks to all who have played the quiz thus far!
Some feedback comments mentioned that explanations are missing of why a selected answer is wrong. Unfortunately, that's a limitation of using a Google form as a quiz. It's only possible to provide one explanation for the correct and another one for all the wrong answers.
However, all the cartoons with the respective fallacy definitions and examples are available in our graphics resource @ https://sks.to/crankycartoons. So, if you wonder why answers you gave are wrong, you can find out by scrolling down the list and selecting the "problematic" cartoon(s).
Hope this helps!
-
Bob Loblaw at 03:18 AM on 27 May 2024Skeptical Science New Research for Week #21 2024
Michael Sweet @ 3:
Technically, David-acct has not actually made any argument at all in comment 1. All he did is quote some numbers. We are left to speculate as to what argument he was trying to make. I agree that he was probably trying to make an argument along the lines of "oh, my, look at how huuuugely expensive this is!!!", to which the rejoinder is "compared to what?".You have pointed him in the direction of "what?"
Maybe his argument was intended to be "look at how cheap this will be!!!", but I somehow doubt it. If David-acct's past commenting habits are a guide, I also doubt we'll see him return to be more specific or actually make a logical argument.
My analogy to David-acct's "argument" is to compare him to a homeowner who has been told "Your roof is leaking badly. It will cost $20,000 to replace it." The homeowner balks at the cost, and decides not to do it. Meanwhile, he's doing $60,000 of renovations to upgrade the kitchen to granite counter tops and walnut cabinets, and has spent $40,000 to create a media room on the second floor, with flat screen TV, 7-channel sound system, etc. ...and all those renovations get destroyed a few months later when the leaking roof causes major flood damage. He expects insurance to cover the cost, but when the insurance company finds out he was told about the leaking roof earlier and chose to ignore that advice, the insurance company says "you're on your own".
-
michael sweet at 01:12 AM on 27 May 2024Skeptical Science New Research for Week #21 2024
Sorry, my link in 3 is broken try
Moderator Response:[BL] Same link problem fixed. There seems to have been some sort of "chrome-extension" text prepended to the proper link. Probably best to pass it through a plain text editor before copying and pasting.
-
michael sweet at 22:39 PM on 26 May 2024Skeptical Science New Research for Week #21 2024
Jacobson 2022 describes a completely renewable system for the USA including all transportation, all industry and all other energy used in society.
I note that in Jacobson 2022 he models a system using renewable energy (primarily wind and solar but including hydro, geothermal and other minor sources) without any burning of anything. Other proposed systems burn renewable sources like vegetable oil, forrestry waste and trash and are cheaper than Jacobson's system. Jacobson argues that it is worth the extra cost to reduce pollution as much as possible.
-
michael sweet at 22:26 PM on 26 May 2024Skeptical Science New Research for Week #21 2024
David-accct:
And where you live fossil fuels are free? You fill up your car for free? Electricity is free? Heating and cooling are free? This is such a stupid argument that it is difficult to reply.
You are like the teenager who tells his dad that a $30,000 Tesla is too expensive so he has to buy the Ferrari. (He doesn't mention that the Ferrari costs $200,000).
Jacobson 2022 (free copy) states:
"In the “Total USA” case, the 2050 BAU annual private energy cost is $2.5 trillion/yr, and the 2050 BAU annual social energy is $6.8 trillion/yr (Tables 4 and S20; Figs.5 and S3). Thus, the private and social costs of WWS energy (both $933 billion/yr) are~63% and ~86% lower, respectively, than those of BAU"
The energy costs alone of fossil fuels are 2.7 times more expensive than renewable energy (WWS in Jacobson). Millions of people are killed every year by fossil pollution in your choice. The social costs are about 7.3 times the cost of renewable energy.
Your argument about costs is simply ignorant bluster.
Moderator Response:[BL] Link fixed
-
Bob Loblaw at 10:17 AM on 26 May 2024Skeptical Science New Research for Week #21 2024
...or a little over $400 billion per year, or about $1300 per person per year.
The US plans to spend nearly $900 billion this fiscal year on defence.
I have to admit, David-acct, I am amazed at your ability to avoid seeing context.
-
David-acct at 05:09 AM on 26 May 2024Skeptical Science New Research for Week #21 2024
From the David Brown Wood MacKenzie article / link above
Figure 1. US$11.8 trillion dollars in capital investment in US energy is required on a cumulative basis from 2023-2050 to reach our net zero scenario.
The $11.8 Trillion dollars is approx $35,000 per person in the US or approx $72k-$75,000 per household.
-
BaerbelW at 01:21 AM on 26 May 2024CO2 is not the only driver of climate
Please note: the basic version of this rebuttal was updated on May 25, 2024 and now includes an "at a glance“ section at the top. To learn more about these updates and how you can help with evaluating their effectiveness, please check out the accompanying blog post @ https://sks.to/at-a-glance
-
One Planet Only Forever at 13:45 PM on 23 May 20242024 SkS Weekly Climate Change & Global Warming News Roundup #19
A follow-up comment to my comment @1,
This CBC News item: Small island states hail ocean court victory on greenhouse gases is evidence that the 'law and order' approach can work ...
But there need to be more votes of support for helpful harm reducing law and order actions. More people need to choose to 'learn to be less harmful and more helpful to others' so that 'justified rule of law' can effectively limit the harm done by those who resist such learning.
Competition for perceptions of status and reward can obviously powerfully compromise such helpful pursuits. These recent legal wins, like the recent increased actions to limit climate change impacts, have been diminished and delayed ... to the detriment of the future of humanity ... by the popularity and profitability of 'more freedom to believe and do whatever is desired'.
-
One Planet Only Forever at 06:47 AM on 23 May 2024Climate Adam: Can we really suck up Carbon Dioxide?
An extreme example of carbon dioxide removal greenwashing is the marketing of the glory of the Pathways Alliance plans to make Alberta oil sands production 'Net-zero by 2050' (see here for their self promotion details).
As mentioned in Climate Adam's video, and the earlier CCS video he mentions (a link at the end of this Climate Adam video), CCS of oil sands operations will only keep part of the ghg impacts of the operations from entering the atmosphere, with risk of leaks of the stuff thought to have been captured and stored. In particular, any methane emissions are not captured for storage.
So, to be 'net-zero' the Pathways Alliance will have to divert (consume) some of the 'real carbon removal activity' that will almost certainly be necessary to bring total human impacts back down to 1.5 C levels (human impacts are expected to exceed the globally agreed 1.5 C level).
Pathways Alliance action, if they get subsidized to the degree they want and actually do something to reduce carbon emissions, would improve Canada's Climate Actions. But the most recent Climate Action Tracker evaluation of Canada linked here (pointed to by prove we are smart in this comment on another SkS item) is "Highly Insufficient" significantly due to leadership being compromised by being interested in profiting more from being more harmful and evading the costs of being less harmful. The Pathways Alliance improvement may only move Canada to "Insufficient" Climate Action.
It appears the (Canadian, Alberta, oil sands investors) hope is that some fossil fuel use will be globally agreed to be needed after 2050 to exclusively provide essential assistance for the least fortunate to live basic decent lives. And they (Canada, Alberta and oil sands investors), being net-zero suppliers by then, should be globally supported to be the chosen suppliers.
Harmful actions can only be justified if the harm is required to provide essential life assistance to the less fortunate (and it would be unacceptable for anyone to profit from providing that assistance - it should be not-for-profit).
That raises many questions including:
Will Canada, Alberta and oil sands investors all agree to be Net-zero-profit-takers after 2050?
And will they have taken action and paid what it costs to minimize the need to divert 'real carbon removal actions' to offset their remaining impacts (diversion required so they can claim to be 'net-zero' suppliers of a harmful product)?
And will they agree by 2050 that the only benefit from their 'net-zero product that will produce harmful impacts when used as expected' is to be obtained by the least fortunate (refusing to export it to questionable buyers)?
-
prove we are smart at 22:44 PM on 20 May 2024Climate change is affecting mental health literally everywhere
“Sometimes people report it’s not one feeling or the other,” Lawrance says. “They feel a lot of ways at once, and feelings can change day to day.” One day might bring a mix of fear, grief, anger, guilt, hopelessness, or numbness"
Thats me-all of the above and I have to remind myself often-
"There is no threshold past which we should stop trying to address climate change, according to climate scientist Michael Mann, who has frequently collaborated with Hassol. Every tenth of a degree change in temperature affects the extent of climate disruptions. That means the sooner we accelerate efforts, the better, but it doesn’t mean all hope is lost because we haven’t already solved the problem."
Also by Daisy Simmons.. yaleclimateconnections.org/2024/04/how-to-talk-to-a-climate-doomer-even-if-that-doomer-is-you/
For our Australian perspective... www.blackdoginstitute.org.au/news/the-implications-of-climate-change-on-mental-health/
-
BaerbelW at 19:51 PM on 19 May 2024Hurricanes aren't linked to global warming
Please note: the basic version of this rebuttal was updated on May 19, 2024 and now includes an "at a glance“ section at the top. To learn more about these updates and how you can help with evaluating their effectiveness, please check out the accompanying blog post @ https://sks.to/at-a-glance
-
One Planet Only Forever at 05:52 AM on 19 May 2024Fact Brief - Does breathing contribute to CO2 buildup in the atmosphere?
Great brief rebuttal of the ridiculous belief that breathing contributes to increased CO2 levels in the atmosphere.
A minor nit-pick with a suggested better presentation added in italics:
The CO2 we breathe is part of a balanced carbon exchange between the air and the earth. In contrast, burning fossil fuels injects oxidized carbon, CO2, into the atmosphere that has been stored underground in hydrocarbon molecules for millions of years, causing a rapid buildup.
Tragically, the popularity of absurd beliefs requires efforts to 'change the minds' of people who are easily tempted to believe nonsense when the alternative is 'learning about the need to stop trying to benefit from being unjustifiably more harmful'.
The first Open Access Notable presented in "Skeptical Science New Research for Week #20 2024" - Publicly expressed climate scepticism is greatest in regions with high CO2 emissions, Pearson et al., Climatic Change - highlights that regions benefiting from high harmful CO2 impacts have higher percentages of the population willing to believe nonsense.
I live in Alberta so I was not surprised by the research results regarding climate skepticism ... and I am painfully aware that nonsense beliefs like 'breathing contributes to the CO2 problem' can be persistently popular among 'highly educated people' who have developed interests that conflict with being less harmful.
-
BaerbelW at 04:38 AM on 18 May 2024The Conspiracy Theory Handbook: Downloads and translations
On May 17, 2024 the Dutch translation of the Conspiracy Theory Handbook was published, bringing the number of available translations up to 19!
-
prove we are smart at 14:21 PM on 17 May 2024Drought fuels wildfire concerns as Canada braces for another intense summer
I read of these fires and their terrible impact locally and their downwind smoke impact on its bigger neighbour over the border. Reading more information here, the similarities with some of our Australian Climate Change experiences was apparant, although some of our aussie flora is adapted to fire, probably not so Canadian flora. The catastrophic fires burnt approx a similar area size too -17million hectares and incinerated over a billion animals in the case of the conservative Australian fire estimate www.aph.gov.au/About_Parliament/Parliamentary_departments/Parliamentary_Library/pubs/rp/rp1920/Quick_Guides/AustralianBushfires
Both countries have a terrible colonial history which is still felt in these times- their massive reliance on sinks in the land sector obscures its ongoing support for fossil fuels. Our rating remains "Insufficient." climateactiontracker.org/blog/analysis-reliance-on-sinks-and-support-of-fossil-fuels-undermines-climate-action/ and Canadian govt?climateactiontracker.org/countries/canada/
If when "the chickens come home to roost" would apply only to the biggest fossil fuel users and exporters-
77% of climate scientists agree at least 2.5degrees Celsius is our worlds best effort www.youtube.com/watch?v=MaaJqPCjNr4&t=366s It's kinda impressive how many people didn't get the point of the video: she isn't saying that the goals aren't legitimate or necessary, she's pointing out the disconnect between what's potentially necessary and what is actually being done
We are fiddling while Rome burns or up the creek without a paddle in the case of the biggest flood in my local 150yr history- 2yrs after those horrendous fires-over 2m higher! www.lismore.nsw.gov.au/Community/Emergencies-and-disasters/Flood-information
Our societies are comfortably numb, till an outrage from the grass-roots, it's keep us divided and change channels when faced with a major reality check.
-
Martin Watson at 09:41 AM on 15 May 2024There's no correlation between CO2 and temperature
Bob Loblaw and MA Rodger
Thank you both for your replies. I will follow up on those suggestions.
-
EddieEvans at 22:38 PM on 14 May 20242024 SkS Weekly Climate Change & Global Warming News Roundup #19
Video -- Skeptical Science - Weekly Climate Change & Global Warming News Roundup #19 4:51
Moderator Response:[BL] Eddie: when you post a link like this, please remember to give a brief description of what people should expect to find at the other end of link.
For the information of others, it is a Youtube video reading of the SkS News Roundup of this week (as suggested in the text title of the link).
-
MA Rodger at 20:58 PM on 14 May 2024There's no correlation between CO2 and temperature
Martin Watson @ 184,
As you say, the graphic appears in a Science article CenCO2PIP Consortium (2023) 'Toward a Cenozoic history of atmospheric CO2', although more correctly it was in the 'commentary' of the paper and it also then sported a scale for the GMST (which in my eyes isn't so helpful).
The paper itself does provide a more conventional graphic (Fig2) which does show 20-odd Mya CO2 levels of perhaps 300ppm and GMST of some +3ºC above pre-indusrial.
While CO2 is the major control knob of Earth's GMST, other factors can make a big difference. The closure of the Panama Isthmus certainly is one of these 'other factors'. The timing is not so well defined (with some even suggesting a date as ancient as 23Mya, this a seriously controversial suggestion), and the changes at work in the climate system which resulted are far from straightforward. The conventional version is that the inital result of the closure was a warmer Earth but that kicked-off the Norhern glaciations which tipped the Earth into a colder phase leading to the recent ice-age cycles (as per for instance Bartoli et al (2005) 'Final closure of Panama and the onset of northern hemisphere glaciation'.)
-
Bob Loblaw at 04:30 AM on 14 May 2024There's no correlation between CO2 and temperature
Martin Watson @ 184:
The diagram you post is not radically different from the graphs and data presented in the intermediate tab of the "CO2 was higher in the past" rebuttal. That rebuttal gives a fairly detailed look at CO2 history over longer periods, and discusses many of the other factors that also affect temperature at geologic time scales.
From a brief point of view, many other factors would have been different at the time you ask about (25 million years ago), so one would expect that temperatures would not exactly match those of today.
I suggest that you look over that rebuttal for possible answers, and then continue the discussion on that thread.
-
Martin Watson at 03:16 AM on 14 May 2024There's no correlation between CO2 and temperature
Could someone clear up another little issue for me. I've come across this graph today, which was taken last year from a big literature review in the journal Science. I'm confused by the dip at about 25 million years ago. It seems to show CO2 levels similar to today but temperatures much higher. I don't think I've seen this dip on other graphs.

-
One Planet Only Forever at 03:23 AM on 13 May 20242024 SkS Weekly Climate Change & Global Warming News Roundup #19
Based on the Story of the Week:
The consensus of people who seriously and responsibly investigate global climate appears to be that, due to the undeniable failure of global leadership by the most harmful powerful people, humanity's future requires adaptation to more dramatically end the use of fossil fuels and other harmful developed human activities plus adaptation to the expensive effort to reduce the excessive accumulated harmful impacts.
When people resist learning to be less harmful 'liberty reducing law and order' can become the required corrective recourse (far better than the disaster of attempted rebellion against undeserving powerful harmful leaders) ... but that requires people who are focused on being less harmful and more helpful to others to 'govern law and order actions without compromising the actions to get along with people who resist learning to be less harmful'.
-
Eclectic at 11:54 AM on 11 May 2024The science isn't settled
Bob Loblaw @108 , 109 : Thanks.
Bob, you and MAR have a great deal of technical knowledge ~ certainly well above my pay-grade.
As you both are doubtless suspecting, poster TWFA probably does not have that level of knowledge. Even so, he wishes to challenge the mainstream science of climate, for his own personal reasons. (Yet possibly, part of him does wish to learn more.)
But TWFA has boldly jumped into a gunfight, while he's only carrying a knife.
~Or to re-frame the old cliche more humorously :- TWFA has gone into a gunfight while carrying a rolled-up Forbes magazine.
[Future readers can be forgiven for missing my reference to a current May 2024 American politico-legal item of notoriety & humor].
Still, I welcome TWFA's presence in this thread !
-
Bob Loblaw at 05:54 AM on 11 May 2024The science isn't settled
To follow up on MA Rodger's comment (#106) on TWFA's comment (#104) that presents data from Delague and Bard (2010).
- MAR has provided a link to a free copy of the paper.
- The journal page is here,
- That journal page includes a link to Supplementary data, which is a CSV file that includes their TSI reconstruction (discussed, but not graphed or presented in the paper).
With respect to Delague and Bard's TSI reconstruction, it is worth noting:
- It provides values on a roughly 10-year interval.
- The first value is for the year 695.
- The last value is for 1982.
- The graph presented by TWFA says "5-per running mean", so it is a smoothed graph where each point represents roughly 50 years.
- The difference between the maximum and minimum in Delague and Bard's TSI data is 1.2 W/m2. You need to divide by 4 to compare it to the CO2 forcing, to get 0.3 W/m2. You need to then adjust for the earth's albedo, since 30% of TSI is reflected, further reducing the absorbed radiation to 0.21 W/m2.
We can graph the original data (no smoothing) for the period 1900 to present. It looks like this:

Question for TWFA:
How much of the warming observed since 1900 do you think is accounted for by the changes in TSI, as indicated by your source (Delague and Bard)?
-
Bob Loblaw at 00:51 AM on 11 May 2024The science isn't settled
I agree with Eclectic that TWFA seems to be getting some rather bad information from dubious sources. Given that TWFA often seems to just jump to a different "talking point" when challenged on his interpretation or argument, it seems that he lacks understanding of exactly what point his snippets of information are supposed to represent.
As an example, after arguing about the features of the Jevrejeva sea level reconstruction, in comment 99 I pointed to a RealClimate post that shows the Jevrajeva methodology is suspect. In comment 100, TWFA did not make any attempt to justify the use of Jevrajeva - instead, he made a bogus general argument about trends and processing, and did a "Look! Squirrel!" about comparing 1600 with 1750. After I commented in #101, he continued with more Just Asking Questions.
I will attempt to respond to TWFA's comment 102 in two ways. First, to address his general question about past climates, what we know, and what does it tell us.
- The information we have about past climates is limited, and often requires use of proxies (geological records, tree rings, ice cores, etc.) That does not mean we "know nothing". though. In essence, the proxies are the result of past climates, rather than direct measurements of the temperature, precipitation, etc.
- By understanding the physics of climate (including physics of solar output, etc.), we can use the evidence we do have about past climates to determine what factors were playing a role at that time. And we can compare that to what we can directly measure about those factors now.
- ...and we see that the best explanation for current trends must include greenhouse gas changes (mostly CO2 from fossil fuel use) to get things anywhere close to right. Other factors were active in the past to a sufficient degree to cause changes we see in the past - but they are not sufficient now to cause the changes we are seeing now.
- To directly respond to TWFA's "I don't understand how what is now deemed to be abnormal can be so determined if prior normal cannot be",
- We can determine what "prior normal" was - at least to some limited extent. But that limited extent contains a range of uncertainty due to our limited information. (Even today, we have limits on what is measured.)
- When we interpret our evidence of the past, we have to include that uncertainty range. Hence Eclectic's question in comment 98: the broad mauve band versus the smooth calculated curve in the graphs that were being discussed.
The second approach I'll take is by analogy. A thought experiment.
- Let's assume I am on trial for stealing money from TWFA's bank account.
- The prosecution has shown evidence of an electronic transfer of $10k from his account to mine on a particular date last month, and evidence that this transfer was initiated for a login from my IP address. At the time, TWFA was on vacation in central Africa, with no internet access.
- I have presented evidence that TWFA's bank account balance in the past has gone up and down by thousands of dollars from month to month. I do not have information about individual transfers in the past, but I do have evidence of TWFA's approximate income and typical monthly expenses.
- I argue that this past range of bank balances raises doubt that I stole the money. How can we be sure that some expense that existed in the past did not cause the removal of $10k?
- On cross, the prosecution presents detailed records that show each transaction for the past year (when detailed records are available). None of the historical expenses that cause $10k changes in the older historical bank balances were happening during the period I am accused of stealing money. They again point out that the current detailed records include a transfer to my account.
- The judge ends up saying "it's settled - guilty as charged".
Climate scientists have spent a lot of time looking at past climates, using the available (albeit limited) evidence. We've spent time to understand the physics, analyze the data, and determine the range of effects that have caused past climate changes. And now we've looked in detail at the role of CO2, and we are observing the effects of increased CO2 that are in broad agreement with theory.
There are things we still want to learn (always), but the fact that CO2 is a greenhouse gas, has caused most (if not all) the warming in the recent past, and will continue to cause warming in the future is settled science.
-
Eclectic at 22:57 PM on 10 May 2024The science isn't settled
MA Rodger @106 : Thanks for that.
TWFA hasn't yet said where he gets his background info from ~ but it seems he had been lurking in some mighty crappy corners of the internet. Corners where the order of the day is to supply doctored graphs and other deceptive half-truths to the Man-in-the-Street. And in corners where the products marketed are heavily slanted toward conspiracy, outrage, and FUD.
Still ~ as Pollyanna would say ~ he may be on the path to thinking things through, and picking up better-quality information.
-
MA Rodger at 20:48 PM on 10 May 2024The science isn't settled
TWFA @104,
I assume your presentation of somebody's helpful re-drawing of Delague & Bard (2010) fig 5 (below) is your true message and your comment is being ironic.
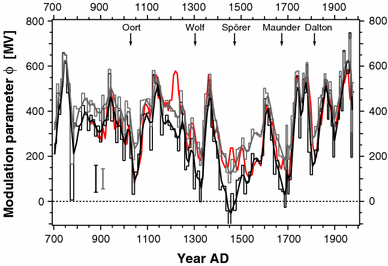
There are some seriously dodgy proxy TSI reconstructions that survive zombie-like through the decades.
Bard et al (2000) has been criticised for finding larger wobbles in TSI than other studies using the same proxy data (eg Vieira et al (2011) [fig5 below] or Wu et al 2018) but I don't see that criticism is greatly extending to the Delaygue & Bard (2010) graph you post.
Given there is no dispute with the measured TSI record over the last half-century (so after your graphic runs out) during which we have also seen rising global temperatures, would an increase in +1.5Wm*-2 in TSI 1650-1950, that equal to a spherical forcing of +0.375Wm^-2 so less than a decade's-worth of the GHG forcings seen of late; would such a TSI forcing applied over half a millenia be particularly significant?

-
Eclectic at 11:39 AM on 10 May 2024The science isn't settled
TWFA @104 :
(Thanks ~ good timing ~ I was about to leave the house.)
Your question would be better expressed, not as "nature bringing temperature up stopped [in 1850]" . . . but rather as : nature reducing the greater downward pressure (by about 1850). Of course, from a Milankovitch-cycle aspect, we would expect the slow gradual line of temperature decline . . . to continue for about 15,000 years, until "the ice really hits the fan" . . . ;-) . . . and the world plunges deep into the next Glacial Age (a genuine Ice Age).
[ So there was no rush for humans to burn all their coal to keep the next glaciation at bay. ]
TWFA, the forcing from the sun ~ is only one factor in the big picture. And as best I currently understand it, the Little Ice Age was caused by two roughly equal factors. Those factors being (A) the Grand Solar Minima [Spoerer, Maunder, etc] . . . and [B] a period of greater frequency of major volcanic eruptions [stratospheric particulates causing cooling ]. A Grand Solar Minimum, by itself, is rather weak in its cooling effect.
The major factors causing climate change are : Albedo, Sun, Particulates, and CO2 (currently!)
Yeah, it's complicated. But the scientists have been doing good work in getting an understanding of it.
Fair to say : the science is settled enough for our current practical purposes. It is the politics of how to tackle our self-made problem . . . which is the difficult part to carry out efficiently.
-
TWFA at 11:00 AM on 10 May 2024The science isn't settled
OK, so in 1850 whatever forcing nature was doing to bring temperatures up stopped and we took over, the sun had nothing to do with anything, right?

-
Eclectic at 10:18 AM on 10 May 2024The science isn't settled
TWFA @102 :
Best if you look at the bigger picture ~ not just the past 500 years.
As you know, back before about 150-200 years, the various temperatures must be assessed by means of proxies. And the more proxies over a wider area, then the smaller the amount of uncertainty.
The proxy evidence points to the past temperature normals [note: plural] following a cycle [Milankovitch] during the past million years. For instance, during the Holocene period, world temperatures were at a high plateau for roughly 5,000 years . . . followed by a slow decline of [all rough figures of course] about 0.7 degreesC for the past 4.000 years. ~All this, due to natural factors.
During that slow decline, there were small deviations from the line of decline [owing to certain transient natural causes]. E.g. the Medieval Warm Period of several centuries showed a world warming of about 0.3 degreesC ; and the Little Ice Age (including the 1600-1800 period you express interest in) showed a downward "blip" of about 0.3 C . . . and thus was about 0.6 C below the peak of the MWP.
The LIA finished roughly 1850 ~ by which time world temperatures had reached the "normal" i.e. were near the average line of decline from the Holocene peak. And by 1850, thermometer readings were starting to be used (outside the Central England Temperature region). And so we know, quite accurately, that the world temperatures have then "shot up like a rocket" ~ way above the (Milankovitch-related) line of natural decline . . . and world temperatures today are roughly 0.5 C above the peak of the Holocene.
# A very impressive sudden warming change (and with more to come) ~ and all this is clearly "not natural" in its causation.
TWFA ~ so where is your "not unreasonable" objection?
-
TWFA at 07:49 AM on 10 May 2024The science isn't settled
So the answer is, "What was going on prior to 1850 is not important", or all that data is suspect, or has not been presented properly, or some such thing?
I don't understand how what is now deemed to be abnormal can be so determined if prior normal cannot be. Again, the simple question is, what was the temperature doing in 1600, 1650, 1700, 1750 and 1800, as best can be estimated? It's not an unreasonable or silly thing to ask.
-
Bob Loblaw at 05:35 AM on 10 May 2024The science isn't settled
TWFA @ 100:
I see where your problem is. You have no idea what you are talking about.
Determining trends is "processing". The data that goes into that trend determination will affect the trends that are calculated. Noise does matter, and uncertainty in trend calculation takes that into account.
Of course, you are probably determining "trend" using the eyecrometer, so it is easy for you to just see what you want to see, and filter out anything you don't like.
...and this may be news to you, but "global sea level" is not something that is measured using a single data value. It requires a bunch of values at different locations, and you need to combine those data values together properly to get an estimate of a global value. You know: that "processing" step?
...and because sea level measurements are not evenly distributed, you can't just average the individual locations with equal weighting. The weighting method (more "processing") does matter, and that is what Jevrejeva does poorly.
As for your focus on the 1700s - there are many factors that affect sea level, both locally and globally. If one factor affects sea level in 1700, that does not mean that other factors can't affect sea level at another time. I think you need to read the "Climate's change before" rebuttal. There is a reason it is #1 in the "Most Used Climate Myths" list.
-
TWFA at 03:07 AM on 10 May 2024The science isn't settled
Noise or improved processing does not change a trend fom negative to positive, where were the sea levels in 1600 vs 1750, higher or lower? Is the assertion that but for mankind the sea levels today would be at or below the level they were in 1600?
-
BaerbelW at 23:28 PM on 9 May 2024Medieval Warm Period was warmer
Please note: the basic version of this rebuttal was updated on May 9, 2024 and now includes an "at a glance“ section at the top. To learn more about these updates and how you can help with evaluating their effectiveness, please check out the accompanying blog post @ https://sks.to/at-a-glance
-
Bob Loblaw at 22:15 PM on 9 May 2024The science isn't settled
It probably comes as no surprise that TWFA is relying on the Jevrejeva sea level reconstruction. It is probably the least reliable one, and a 2013 post at RealClimate discussing the state of knowledge of sea level rise has provided detailed discussion of the methodology and its problems.
Two paragraphs from that RealClimate post:
The one curve that does not show an unprecedented recent rate in Gregory et al. is the data of Jevrejeva et al. (2008). That contrasts with our treatment of the same data in Rahmstorf et al. 2011 (Fig. 5), where we applied a stronger and more sophisticated smoothing (as compared to the running average used by Gregory et al) which lowers the temporary high peak in the rate around 1950. This peak is not found in any of the other data sets, and as shown in Fig. 2 above, it makes the Jevrejeva data run outside the grey range found by combining all contributions.
I think this peak is spurious and results from the fact that the data of Jevrejeva et al. cannot be considered an estimate of global-mean sea level on such relatively short time scales (a couple of decades). For example, in this data set the North Atlantic data (including Arctic and Mediterranean, overall 16.6% of the global ocean area) provide 31% of the global average and are weighted four times as strongly as the Indian Ocean, although the latter is larger (19.5% of the global ocean). The Northern Hemisphere is weighted more strongly than the Southern Hemisphere, although the latter has a greater ocean surface area. (For more on the Jevrejeva weighting scheme, see our reader’s exercise below.) That is not to say that other tide-gauge based estimates guarantee a properly area-weighted global sea-level history, but it means that Jevrejeva et al. are guaranteed to not represent an area-weighted global mean, while e.g. Church and White (2006, 2011) are making a decent attempt at representing a global mean.
Follow down that RealClimate post to the section titled "A reader’s exercise: the “virtual station method” of Jevrejeva et al" for further details.
Perhaps TWFA will illuminate us on why he prefers that Jevrejeva analysis, but I won't hold my breath.
-
Eclectic at 16:36 PM on 9 May 2024The science isn't settled
TWFA @90 (and others) :
Yes, the two graphs are somewhat different ~ and they both contradict your claims. (How do you disbelieve your own eyes?)
Your Jevrejeva Figure 1 shows not only a great deal of jagged variation in the main black line (which is quite to be expected in averaged measurements at different dates) . . . but also shows the broad mauve bands above & below the averaged measurements in the pre-1850 region.
TWFA, what do you suppose that very broad mauve band means? ~ For one thing, it means that the smooth calculated curve is merely a convenient approximate fit. Also, that the smooth curve is not imposed by Divine Will upon that wiggly graph in order to show TWFA a 5mm sea level fall (& rise) between 1700 and 1800.
TWFA, in this thread please do not raise all that Conspiracy Theory stuff ~ it is difficult to have an intelligent discussion about real things, if you choose instead to wander off into Conspiracy Crazy Land.
The phase out of Fossil Fuels is not (and cannot) be carried out "overnight". It is looking like it will take maybe 40 years or more ~ and so your precious plastic shopping bags will be available for quite some time yet. No need for alarm or panic.
-
TWFA at 16:09 PM on 9 May 2024The science isn't settled
Correction, vegetable soup into corn chowder...
-
TWFA at 16:08 PM on 9 May 2024The science isn't settled
scaddenp, FF phase-out means petrochemical phase-out as well, you can't have one without the other, refine a quart of corn chowder into a quart of vegetable soup with nothing left over, so as long as there is plastic, insulation for all those wires needed in the FF-free world and asphalt to roll the synthetic rubber Tesla tires on, there will still be at least a third of every barrel of crude being cracked into some form of hydrocarbon fuel or gaseous byproduct that cannot be sequestered or stored, only burned.
-
TWFA at 15:51 PM on 9 May 2024The science isn't settled
I don't know that innovation, adaption and migration will be cheaper, but I know it has worked every time tried. On the other hand you do not know the global thermostat approach will work for sure, will be cheaper, or even that, given all the people on the planet that may not be able to be controlled without global autocracy, a fate worse than a few degrees and inches of water, IMO, it can or will work even if the West goes net negative or transfers wealth to the underdeveloped world to bring us down to equilibrium for our sins.
-
TWFA at 15:38 PM on 9 May 2024The science isn't settled
Sorry, you're wrong again, perhaps your eyes didn't notice the first chart starts at 1700 and the second at 1800.
In the second chart the authors used data from the 2014 study, which basically took some of the noise out of the '08 paper but did not change the overall curve from 1700, however this particular evangelist cut off the data prior to 1810 to show the slight dip between 1810 and 1860 in order to make an apparent human caused reversal to fit the Industrial Revolution chronological orthodoxy, even though the lagging emissions curve still needed quite a bit of explaining... perhaps in the future they will discover or "adjust" preceding emissions to better fit the narrative.
By the way, I am not "regurgitating" anything, I first noticed the second chart about six months ago when somebody posted it as some sort of devastating proof of the coming inundation we are to be blamed for, it didn't make sense to me based upon the lagging emissions curve, then I drilled deeper into the source data and it all made even less sense.
In any event whether the science is settled (an oxymoron if there ever was one, no theory or law following the scientific method can ever be proved right, only not yet proved wrong) or not is moot, the evangelists ARE getting their way and we WILL be spending hundreds of trillions over the next four or five decades, probably forgoing a chunk of liberty along the way as well, seeing if we can operate a global CO2 controlled thermostat, either it will work, or nature will have something to say about it.
My money, if there is any to be left over, is on the buckets.
-
scaddenp at 15:31 PM on 9 May 2024The science isn't settled
Still not answering:
"Again, why do you believe adaption is going to be cheaper than FF phase-out?"This is the core of the issue isnt it?
-
Eclectic at 14:16 PM on 9 May 2024The science isn't settled
TWFA @90 (etcetera) :-
Your second graph clearly does not support your claim in @88 that: "...sea levels began to rise in 1750, when James Watt was twelve years old..." Indeed that graph shows sea level falling until about 1860 (when James Watt had been dead forty years).
And your first graph ( Jevrejeva; Figure 1 ) shows no support for your wild claim, whatsoever. Please consult your optometrist, urgently.
TWFA, it appears you are regurgitating some wild claims from some third-party source. Where is that source ~ and how did they get it all so very wrong?
-
TWFA at 13:49 PM on 9 May 2024The science isn't settled
Oh, and as to their conclusion, inertia works both ways, if temperature is the controlling factor, in order for the levels to stop receding and "turn the tide" around 1750 the temperatures would actually have to have been climbing beforehand.


