


 Arguments


Explaining climate change science & rebutting global warming misinformation
Global warming is real and human-caused. It is leading to large-scale climate change. Under the guise of climate "skepticism", the public is bombarded with misinformation that casts doubt on the reality of human-caused global warming. This website gets skeptical about global warming "skepticism".
Our mission is simple: debunk climate misinformation by presenting peer-reviewed science and explaining the techniques of science denial, discourses of climate delay, and climate solutions denial.


Skeptical Science New Research for Week #16 2024
Posted on 18 April 2024 by Doug Bostrom, Marc Kodack
Open access notables
Glacial isostatic adjustment reduces past and future Arctic subsea permafrost, Creel et al., Nature Communications:
Sea-level rise submerges terrestrial permafrost in the Arctic, turning it into subsea permafrost. Subsea permafrost underlies ~ 1.8 million km2 of Arctic continental shelf, with thicknesses in places exceeding 700 m. Sea-level variations over glacial-interglacial cycles control subsea permafrost distribution and thickness, yet no permafrost model has accounted for glacial isostatic adjustment (GIA), which deviates local sea level from the global mean due to changes in ice and ocean loading. Here we incorporate GIA into a pan-Arctic model of subsea permafrost over the last 400,000 years. Including GIA significantly reduces present-day subsea permafrost thickness, chiefly because of hydro-isostatic effects as well as deformation related to Northern Hemisphere ice sheets. Additionally, we extend the simulation 1000 years into the future for emissions scenarios outlined in the Intergovernmental Panel on Climate Change’s sixth assessment report. We find that subsea permafrost is preserved under a low emissions scenario but mostly disappears under a high emissions scenario.
How do we reinforce climate action?, Zhao et al., Sustainability Science:
Humanity has a shrinking window to drastically reduce greenhouse gas emissions, yet climate action is still lacking on both individual and policy levels. We argue that this is because behavioral interventions have largely neglected the basic principles of operant conditioning as one set of tools to promote collective climate action. In this perspective, we propose an operant conditioning framework that uses rewards and punishments to shape transportation, food, waste, housing, and civic actions. This framework highlights the value of reinforcement in encouraging the switch to low-emission behavior, while also considering the benefit of decreasing high-emission behavior to expedite the transition. This approach also helps explain positive and negative spillovers from behavioral interventions.
Climate change-driven cooling can kill marine megafauna at their distributional limits, Lubitz et al., Nature Climate Change:
The impacts on marine species from secular warming and heatwaves are well demonstrated; however, the impacts of extreme cold events are poorly understood. Here we link the death of organisms from 81 species to an intense cold upwelling event in the Agulhas Current, and show trends of increasing frequency and intensification of upwelling in the Agulhas Current and East Australian Current. Using electronic tagging, we illustrate the potential impacts of upwelling events on the movement behaviour of bull sharks Carcharhinus leucas, including alterations of migratory patterns and maintenance of shallower dive profiles when transiting through upwelling cells. Increasing upwelling could result in ‘bait and switch’ situations, where climate change expands subtropical species’ distribution, while simultaneously exposing climate migrants to an increased risk of cold-mortality events at poleward distributional limits. This shows the potential impacts of increased cold events, an understudied aspect of climate change research, and highlights the complexities of climate change effects on marine ecosystems.
Literature-informed likelihoods of future emissions and temperatures, Venmans & Carr, Climate Risk Management:
How high should we build a dyke today, knowing that it will serve for more than 50 years? This depends on the probability distribution of future temperatures. We review the literature on estimates of future emissions for current/stated policy scenarios and current pledge scenarios. Reviewing expert elicitations, abatement costs of scenarios, learning rates of technologies, fossil fuel supply side dynamics and geoengineering, we argue that scenarios with emissions largely beyond current/stated policy scenarios and largely below current pledge scenarios are relatively unlikely. Based on this, we develop a literature-informed evaluation of the likelihoods of future temperature for use in Value at Risk stress tests in 2030, 2050 and 2100.
Climate damage projections beyond annual temperature, Waidelich et al., Nature Climate Change:
Estimates of global economic damage from climate change assess the effect of annual temperature changes. However, the roles of precipitation, temperature variability and extreme events are not yet known. Here, by combining projections of climate models with empirical dose–response functions translating shifts in temperature means and variability, rainfall patterns and extreme precipitation into economic damage, we show that at +3 °C global average losses reach 10% of gross domestic product, with worst effects (up to 17%) in poorer, low-latitude countries. Relative to annual temperature damage, the additional impacts of projecting variability and extremes are smaller and dominated by interannual variability, especially at lower latitudes. However, accounting for variability and extremes when estimating the temperature dose–response function raises global economic losses by nearly two percentage points and exacerbates economic tail risks.
From this week's government/NGO section:
Boom and Bust Coal. Tracking the Global Coal Plant Pipeline, Global Energy Monitor, Global Energy Monitor, CREA, E3G, Reclaim Finance, Sierra Club, SFOC, Kiko Network, CAN Europe, Bangladesh Groups, Trend Asia, Alliance for Climate Justice and Clean Energy, Chile Sustentable, POLEN Transiciones Justas, Iniciativa Climática de México, and Arayara:
Despite promising momentum, the world’s operating coal power capacity has grown 11% since 2015 and global coal use and coal capacity reached an all time high in 2023. The global coal fleet grew by 48.4 gigawatts (GW), or 2%, in 2023 to a total of 2,130 GW, with China driving two-thirds of additions. Outside of China, the coal fleet also saw a small 4.7 GW uptick for the first time since 2019. Although new retirement plans and phaseout commitments continued to emerge, less coal capacity was retired in 2023 than in any other single year in more than a decade. Globally, 69.5 GW of capacity came online while 21.1 GW was retired, resulting in a net annual increase of 48.4 GW, the highest since 2016, bringing the global total capacity to 2,130 GW. China’s 70.2 GW of new construction starts in 2023 represents 19x more than the rest of the world’s 3.7 GW and is the country’s highest annual capacity breaking ground since 2015. Outside of China and India, total proposed coal capacity is at its lowest since data collection began in 2015.
What do Americans want to know about climate change?, Ballew et al., Yale University and George Mason University:
In this analysis, the authors investigated how the questions people would ask an expert vary across different subgroups, including demographic and political groups and Global Warming’s Six Americas. The Six Americas framework categorizes people into six distinct audiences based on their opinions about climate change, ranging from the Alarmed (who are the most worried and supportive of action) to the Dismissive (who do not believe climate change is happening or human caused and are often opposed to action). Americans are most interested in learning about solutions to global warming (44%), followed by evidence that it is happening (20%) or information about the causes (18%). Fewer Americans (11%) would ask first about the impacts of global warming. The topics people would ask about differ across demographic and political groups.
143 articles in 61 journals by 832 contributing authors
Observations of climate change, effects
Assessment of climate variability and trends in different physiographic zones of North Western Himalayas, Shafiq et al., Theoretical and Applied Climatology 10.1007/s00704-024-04961-3
InSAR-measured permafrost degradation of palsa peatlands in northern Sweden, Valman et al., The Cryosphere Open Access pdf 10.5194/tc-18-1773-2024
The risk of concurrent heatwaves and extreme sea levels along the global coastline is increasing, Zhou & Wang, Communications Earth & Environment Open Access pdf 10.1038/s43247-024-01274-1
How extreme was the Earth's temperature in 2023
Posted on 17 April 2024 by Guest Author
This is a re-post from Andrew Dessler at the Climate Brink blog
In 2023, the Earth reached temperature levels unprecedented in modern times. Given that, it’s reasonable to ask: What’s going on? There’s been lots of discussions by scientists about whether this is just the normal progression of global warming or if something we don’t understand is happening — in other words, we’ve broken the climate.
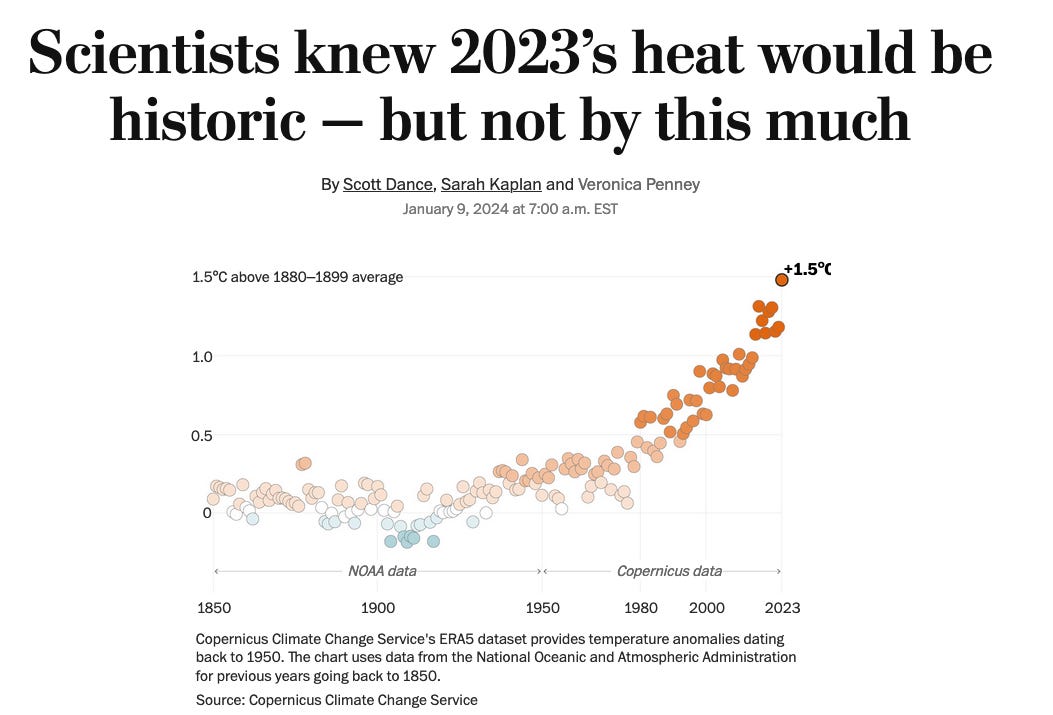
In this post, I compare the observational temperature record to an ensemble of state-of-the-art CMIP6 models to see exactly how unusual 2023 was. It turns out that 2023 is just not that unusual when compared to the model ensemble.
Let’s start with observations. I’m going to be using the Berkeley Earth global average temperature data. In that data set, 2023 was a record-breaking 1.54C above the 1850-1900 average temperature. This temperature exceeded the previous record (set in 2016) by 0.17C.
Beating the previous record by 0.17C is huge: if we look at the temperature observations since 1970, the margin by which records were broken averaged 0.07C, with a median of 0.05C. And no record in the last 50 years had a margin larger than 0.17C.
What does the climate model ensemble show? I have analyzed 38 CMIP6 models over the period 1970-2030 driven by historical and SSP4.5 forcing. Here is a plot of the biggest margin for a record year vs. the year that record occurred:
At a glance - Is the science settled?
Posted on 16 April 2024 by John Mason, BaerbelW
On February 14, 2023 we announced our Rebuttal Update Project. This included an ask for feedback about the added "At a glance" section in the updated basic rebuttal versions. This weekly blog post series highlights this new section of one of the updated basic rebuttal versions and serves as a "bump" for our ask. This week features "Is the science settled?". More will follow in the upcoming weeks. Please follow the Further Reading link at the bottom to read the full rebuttal and to join the discussion in the comment thread there.
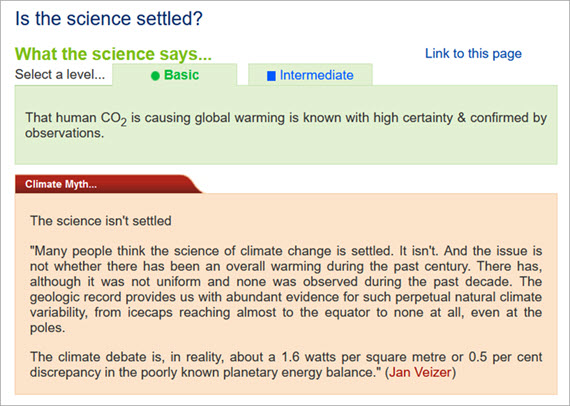
At a glance
Science, in all of its aspects, is an ongoing matter. It is based on making progress. For a familiar example, everyone knows that the dinosaurs died out suddenly, 65 million years ago. They vanished from the fossil record. The science is settled on that. But how and why that happened is still a really interesting research area. We know a monster asteroid smacked into the planet at roughly the same time. But we cannot yet conclude with 100% certainty that the asteroid bore sole responsibility for everything that followed.
With regard to climate science, the basis of the greenhouse effect was demonstrated in the 19th Century. The effect on global temperature through doubling the concentration of atmospheric CO2 had been calculated before 1900 and was not far off modern estimates. Raising global temperature causes Earth's climatic belts to shift polewards. Higher temperatures reduce the amount of land-ice on the planet. That in turn causes sea levels to rise. These are such simple basic physical principles that we can confidently state the science is settled on all of them.
Where the science is less settled is in the fine detail. For example, if you live in a coastal town at a low elevation, you would obviously like to know when it is likely to be affected by rising seas. But that's difficult.
Difficult because changes in sea levels, variations in the sizes of tides and weather patterns are all factors that operate independently of each other and on different time-scales. We may well know that a big storm-surge hitting the coast at high water on a spring tide is the worst-case scenario, but we don't know exactly when that might happen in the decades ahead. Too many variables.
Such minute but important details are where the science isn't settled. Yes we know that if we carry on spewing out tens of billions of tonnes of CO2 every year, things will get really bad. Where and when is the tricky bit. But if climate change was a deadly pathogen, for which there was a vaccine, most of us would get that jab.
In passing, the myth in the box above illustrates a key tactic of misinformation-practitioners, to mix up a whole bunch of talking-points into a rhetorical torrent. The classic example of the practice is the 'Gish-gallop'.
The term Gish-gallop was coined in reference to a leading American member of the creationist movement, Duane Gish (1921-2013). Gish was well-known for relishing fiery public debates with evolutionists. He perfected the method of presenting multiple arguments in a rapid-fire but scattergun manner so that they are impossible to answer in a structured form. It's the opposite of scientific discussion. The Gish-galloper appears to the viewers or listeners to be winning the debate. 'Appears' is the keyword here, though. If you can recognise a Gish-gallop developing, you can make your own mind up quickly.
Please use this form to provide feedback about this new "At a glance" section. Read a more technical version below or dig deeper via the tabs above!
Click for Further details
What is Mexico doing about climate change?
Posted on 15 April 2024 by dana1981
This is a re-post from Yale Climate Connections
The June general election in Mexico could mark a turning point in ensuring that the country’s climate policies better reflect the desire of its citizens to address the climate crisis, with both leading presidential candidates expressing support for renewable energy.
Mexico is the 10th-most populated country with the 15th-largest economy and is also the 11th-most climate-polluting country in the world.
In international surveys conducted in 2022 and 2023, Mexico had one of the highest percentages of citizens worried about human-caused climate change at 92%, compared to just 63% of Americans.* And 88% of Mexican respondents reported that they consider climate change an important issue that their country should address as a priority, compared to just 58% of Americans. This concern may reflect that Mexico is highly vulnerable to droughts, heat waves, hurricanes, flooding, and food and water insecurity worsened by climate change.
But the Mexican government’s climate policy record has been inconsistent. At times, the country’s leaders have taken steps toward reducing its share of climate pollution, but its current and outgoing president Andrés Manuel López Obrador, commonly known by his initials AMLO, has tended to prioritize domestic fossil fuel resources over low-carbon alternatives.
Mexico will hold its next general election on June 2, 2024. Voters will select the next president, who will succeed AMLO in October of this year.
2024 SkS Weekly Climate Change & Global Warming News Roundup #15
Posted on 14 April 2024 by BaerbelW, Doug Bostrom, John Hartz
Story of the week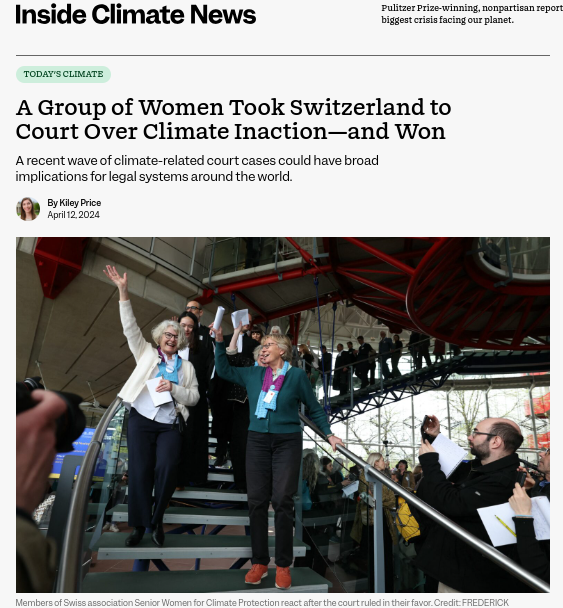
Our story of the week is about adults in the room setting terms and conditions of good behavior. Here it's not parents telling children what to do but instead the widely adopted, mutually agreed system of coercive behavior modification we call "rule of law." Legislators providing courts of justice with laws to apply are how we formalize overcoming widely harmful selfish actions— or negligent inactions. These are our proxy adults telling us what we can't do or must do— our aspirations for better nature given teeth. We could wish that we were all so perfect as to never need grownup guidance of a kind leading to fines or imprisonment, but if anything can serve to illustrate how this isn't realistic it's our failure to confront accountability for fossil fuels and what happens when nobody is willing to say "no."
Belatedly, in step our appointed adults— in this case the European Court of Human Rights (ECtHR). Three articles we shared this week covered an important decision handed down by this court with respect to Verein KlimaSeniorinnen Schweiz and Others v. Switzerland. The court finds that Switzerland is negligent in pursuing climate mitigation plans and hence is harming human rights protected by Article 8 of the European Convention on Human Rights. This is an extremely important precedent, an overdue acknowledgement of human rights being climate-connected. But the outcome is all the more remarkable given the ECtHR's previous agility in reasoning its way to tossing applicants' cases centered on human rights as they pertain to climate matters. Notably, the court has also just rendered unfavorable judgments on two other climate-connected cases, in ways that sometimes seemed to defy common sense. The Sabin Center for Climate Change Law provides a short article providing context helping us to understand this single verdict as a sea change, in its introduction to a symposium on the topic.
Stories we promoted this week, by publication date:
Before April 7
- Scientists confirm record highs for three most important heat-trapping gases, The Guardian, Oliver Milman. Global concentrations of carbon dioxide, methane and nitrous oxide climbed to unseen levels in 2023, underlining climate crisis
- ‘Simply mind-boggling’: world record temperature jump in Antarctic raises fears of catastrophe, Environment, The Observer/The Gurdian, Robin McKie. "An unprecedented leap of 38.5C in the coldest place on Earth is a harbinger of a disaster for humans and the local ecosystem"
- Climate Adam: Is Global Warming Speeding Up?, ClimateAdam on Youtube, Adam Levy.
- Skeptical Science New Research for Week #14 2024, Skeptical Science, Doug Bostrom & Marc Kodack. Skeptical Science's weekly compendium of climate research.
- The Power List: Sophia Mathur, MacLean's, Katie Underwood. Governments are dragging their heels on emissions cuts. In Ontario, this 17-year-old activist is suing over it. She’s our No. 1 climate crusader.
April 7
- 2024 SkS Weekly Climate Change & Global Warming News Roundup #14, Skeptical Science, Baerbel Winkler, Doug Bostrom and John Hartz. Another batch of 34 articles shared in the week from March 31 to April 6, 2024
- Zambians Feel the Personal Consequences of Climate Change-and Dream of a Sustainable Future, Inside Climate News, Georgina Gustin. Lede: Zambia, like its southern African neighbors, depends on rain for its food, energy and economy. But it hasn’t gotten enough this year, and likely won’t in the future, a victim of a climate crisis it didn’t cause.
- Top Europe rights court to issue landmark climate verdicts, Phys.org, Antoine Pollez (AfP).
Fact Brief - Did global warming stop in 1998?
Posted on 13 April 2024 by SkS-Team
![]() Skeptical Science is partnering with Gigafact to produce fact briefs — bite-sized fact checks of trending claims. This fact brief was written by Sue Bin Park in collaboration with members from our Skeptical Science team. You can submit claims you think need checking via the tipline.
Skeptical Science is partnering with Gigafact to produce fact briefs — bite-sized fact checks of trending claims. This fact brief was written by Sue Bin Park in collaboration with members from our Skeptical Science team. You can submit claims you think need checking via the tipline.
Did global warming stop in 1998?
 While 1998 was an abnormally warm year, annual average temperatures have trended steadily upward in the decades since.
As a strong El Nino year, 1998 featured a significant spike in global temperatures. El Nino is the warm phase of a cyclic climatic pattern where sea temperatures in parts of the Pacific swing higher or lower than average. The 1998 El Nino stood out above the rising temperature trendline that is due to manmade global warming.
However, the long-term upward trend in globally-averaged temperatures has continued. In the past quarter century, the top ten hottest years on record have all occurred since 2010.
Go to full rebuttal on Skeptical Science or to the fact brief on Gigafact
This fact brief is responsive to conversations such as this one.
Sources
ReliefWeb El Niño - 1998 Global Surface Temperature: Highest by a Wide Margin
Royal Meterological Society Coverage bias in the HadCRUT4 temperature series and its impact on recent temperature trends
NASA Global Temperature
Skeptical Science New Research for Week #15 2024
Posted on 11 April 2024 by Doug Bostrom, Marc Kodack
Open access notables
Global carbon emissions in 2023, Liu et al., Nature Reviews Earth & Environment
Annual global CO2 emissions dropped markedly in 2020 owing to the COVID-19 pandemic, decreasing by 5.8% relative to 2019 (ref. 1). There were hopes that green economic stimulus packages during the COVD crisis might mark the beginning of a longer-term decrease in global emissions toward net-zero emissions, but instead emissions rebounded and quickly exceeded pre-pandemic levels by 2021. However, year-on-year growth has slowed, with 5.4% increases in 2021 (ref. 2) (reaching 35.1 Gt CO2) and 1.9% increases in 2022 (ref. 3) (reaching 35.7 Gt CO2), rapidly using up the remaining carbon budget. Here, we outline global CO2 emissions (encompassing fossil fuel combustion and cement production) from the Carbon Monitor project (https://carbonmonitor.org) for the year 2023.
Moral hazards and solar radiation management: Evidence from a large-scale online experiment, Schoenegger & Mintz-Woo, Journal of Environmental Psychology
Solar radiation management (SRM) may help to reduce the negative outcomes of climate change by minimising or reversing global warming. However, many express the worry that SRM may pose a moral hazard, i.e., that information about SRM may lead to a reduction in climate change mitigation efforts. In this paper, we report a large-scale preregistered, money-incentivised, online experiment with a representative US sample (N = 2284). We compare actual behaviour (donations to climate change charities and clicks on climate change petition links) as well as stated preferences (support for a carbon tax and self-reported intentions to reduce emissions) between participants who receive information about SRM with two control groups (a salience control that includes information about climate change generally and a content control that includes information about a different topic). Behavioural choices are made with an earned real-money endowment, and stated preference responses are incentivised via the Bayesian Truth Serum. We fail to find a significant impact of receiving information about SRM and, based on equivalence tests, we provide evidence in favour of the absence of a meaningfully large effect.
Greenwashing, net-zero, and the oil sands in Canada: The case of Pathways Alliance, Aronczyk et al., Energy Research & Social Science
This article examines net zero greenwashing using the case of Pathways Alliance, a coalition of six companies representing 95% of oil sands production in Canada, one of the world's largest oil reserves. Drawing on a corpus of documents (n = 183) spanning a two-year period, including materials from the coalition's advertising and public relations campaign, we evaluate Pathways Alliance's public communication for indicators of net-zero greenwashing. We identify instances of selective disclosure and omission, misalignment of claim and action, displacement of responsibility, non-credible claims, specious comparisons, nonstandard accounting, and inadequate reporting. There is also evidence that their publicity campaign extends beyond the materials usually collected and assessed for greenwashing by researchers. The article calls for further research into net zero communication and an expanded conception of greenwashing able to account for the role of digital platforms, public relations, and sector-wide alliances in strategically coordinated climate communication.
Increase in concerns about climate change following climate strikes and civil disobedience in Germany, Brehm & Gruhl, Nature Communications
Climate movements have gained momentum in recent years, aiming to create public awareness of the consequences of climate change through salient climate protests. This paper investigates whether concerns about climate change increase following demonstrative protests and confrontational acts of civil disobedience. Leveraging individual-level survey panel data from Germany, we exploit exogenous variations in the timing of climate protests relative to survey interview dates to compare climate change concerns in the days before and after a protest (N = 24,535). Following climate protests, we find increases in concerns about climate change by, on average, 1.2 percentage points. Further, we find no statistically significant evidence that concerns of any subpopulation decreased after climate protests. Lastly, the increase in concerns following protests is highest when concern levels before the protests are low.
Cyclone Jasper’s rains in the context of climate change, Emanuel, Proceedings of the National Academy of Sciences
Cyclone Jasper struck northern Queensland in mid-December, 2023, causing extensive flooding stemming from torrential rain. Many stations reported rainfall totals exceeding 1 m, and a few surpassed 2 m, possibly making Jasper the wettest tropical cyclone in Australian history. To be better prepared for events like Jasper, it is useful to estimate the probability of rainfall events of Jasper’s magnitude and how that probability is likely to evolve as climate warms. To make such estimates, we apply an advanced tropical cyclone downscaling technique to nine global climate models, generating a total of 27,000 synthetic tropical cyclones each for the climate of the recent past and that of the end of this century. We estimate that the annual probability of 1 m of rain from tropical cyclones at Cairns increases from about 0.8% at the end of the 20th century to about 2.3% at the end of the 21st, a factor of almost three. Interpolating frequency to the year 2023 suggests that the current annual probability of Jasper’s rainfall is about 1.2%, about a 50% increase over that of the year 2000. Further analysis suggests that the primary causes of increasing rainfall are stronger cyclones and a moister atmosphere.
Integrating science and the arts to deglobalise climate change adaptation, Olazabal et al., Nature Communications
Language has so far been the key resource for awareness-raising, communication, planning, negotiation, and decision-making in the socio-political arenas of adaptation. In theory, language should not be limited to describing the present but also to imagining adaptation realities and challenging them to create disruptive pathways for action. At a time when adaptation had a limited role in policy discourses, language has been very useful in creating symbolism13 through universal abstractions regarding what adaptation involves (resilience, transformation, justice) or what it is not meant to involve (risk, maladaptation or vulnerability). However, it has not been successful in shaping imaginaries of what adaptation might look like on the ground. Two significant challenges hinder the use of language as an entry point for context-specific adaptation management: (1) its abstraction and technocratisation, and (2) its lack of local meaning. We here argue that, while the current language used in adaptation is a critical resource across stages of policy, planning, awareness and education, it alone cannot generate ownership and produce relevant action at the local level. Visuals are also necessary tools.
From this week's government/NGO section:
Rebutting 33 False Claims About Solar, Wind and Electric Vehicles, Eisenson et. al., Sabin Center for Climate Change Law, Columbia University
Getting the U.S. energy system onto an environmentally sustainable track will require rapid and widespread development of wind, solar, and other renewable energy facilities; corresponding storage, transmission, and distribution infrastructure; and timely industry-specific transitions, such as battery electric vehicles replacing their combustion-engine counterparts. Broad public support exists for transformative climate policies, with a June 2023 Pew Research Center survey finding that 67% of U.S. adults prioritize developing renewable energy sources over increased fossil fuel production. However, “misinformation” and coordinated “disinformation” have at times undermined support for renewable energy projects and electric vehicles. The authors address some of the more prevalent and persistent distortions about solar energy, wind energy, and electric vehicles, with the aim of promoting a more informed discussion.
2035 and Beyond. Reconductoring With Advanced Conductors Can Accelerate the Rapid Transmission Expansion Required for a Clean Grid, Chojkiewicz et al., Goldman School of Public Policy, University of California, Berkeley and GridLab
The authors combines the latest energy cost data with state-of-the-art grid modeling to quantify three key elements: the cost of reconductoring with advanced conductors; the associated gains in transmission capacity; and the associated contribution to meeting transmission needs by 2035.
153 articles in 55 journals by 838 contributing authors
Physical science of climate change, effects
Antarctic meteorites threatened by climate warming, Tollenaar et al., Nature Climate Change Open Access pdf 10.1038/s41558-024-01954-y
Dynamics of an extreme low temperature event over South Africa amid a warming climate, Chikoore et al., Weather and Climate Extremes Open Access 10.1016/j.wace.2024.100668
EGU2024 - Picking and chosing sessions to attend virtually
Posted on 10 April 2024 by BaerbelW
This year's General Assembly of the European Geosciences Union (EGU) will take place as a fully hybrid conference in both Vienna and online from April 15 to 19. I decided to join the event virtually this year for the full week and I've already picked several sessions I plan to attend. Among them are two sessions, I'll be presenting in. This blog post provides an overview of my itinerary.

Monday
The week kicks off right away at 8:30 in the morning with a Union Symposia (US2) about the Climate emergency, human agency: making sense of the current state of scientific knowledge on climate change to strengthen climate literacy.
This Union Symposium will build on key findings from the Sixth Assessment Cycle of the Intergovernmental Panel on Climate Change (IPCC). It will place the current scientific understanding in this context of climate science history and lay out what is the current state of climate, with the observed intensification of global and regional changes, and what are physically plausible futures, unpacking how science underpins the understanding of the climate emergency. The presentations will be given by Valérie Masson-Delmotte, Laboratoire des Sciences du Climat et de l'Environnement, IPSL, France and Joeri Rogelj, Centre for Environmental Policy, Imperial College, London, Great Britain.
Then it's time for a short course (SC2.2) starting at 10:45 providing an introduction to science for policy. This will be a repeat for me, but I found this session - convended by Chloe Hill - interesting when I attended it in previous years.
This session will provide an introduction into some key ‘science for policy’ themes and provide specific details about when and how scientists can engage with policy to increase the impact of their efforts. It will also provide resources and tips for scientists so that they can start their science for policy journeys. The last part of the Short Course will include a Q&A with those working on the science-policy interface. This session will be relevant to all career levels and scientific disciplines.
In the afternoon, I plan to join short course (SC3.3) Scared of giving presentations to a (geo-)scientific audiences? as this cannot hurt in the run-up to my own presentations on Tuesday and Wednesday.
This short course deals with the various reasons and symptoms of stage fright and how they can be overcome. Scientists will share their experiences and what has helped them to deal with their fear of presenting. There will be practical tips and room for questions as well as exchange of experiences. This year, we're exploring a fresh angle: science communication. While the stage is set for scientific discourse, effective communication is key. Meet our speakers, Dr. Simon Clark and Dr. Heather Handley, seasoned communicators, sharing insights!
To finish day 1 of EGU24, I picked yet another short course (SC2.6) Climate change, morals and how people understand the politics of climate change
Update April 11: Unfortunately, session SC2.6 was withdrawn, but there is an interesting alternative, I plan to join instead and it's also a short course: SC2.5 Ethics for geoscientists in a time of crisis:
What does 'ethics' mean and what is the role of ethics in your daily practices as a scientist? Where and how do ethics enter into your geoscientific research and teaching? Although ethics as a subject of study is traditionally the domain of social sciences and humanities, as scientists we are confronted with ethical questions and decisions every day. In the context of climate emergency, mass extinction and global social injustices, it is increasingly important to understand the role played by our research and the systems and structures within which our work is embedded. Ultimately, we could ask ourselves a question: does our research contribute to building a world that corresponds to our values?
In between these sessions - or if I find out that one I planned to attend isn't quite a good fit for my interests - I may pay a virtual visit to Gather.town to check out some virtual posters or find some people to chat with.

Tuesday
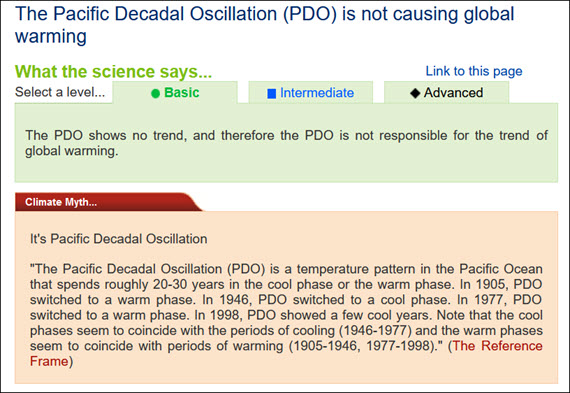
At a glance - The Pacific Decadal Oscillation (PDO) is not causing global warming
Posted on 9 April 2024 by John Mason, BaerbelW
On February 14, 2023 we announced our Rebuttal Update Project. This included an ask for feedback about the added "At a glance" section in the updated basic rebuttal versions. This weekly blog post series highlights this new section of one of the updated basic rebuttal versions and serves as a "bump" for our ask. This week features "The Pacific Decadal Oscillation (PDO) is not causing global warming". More will follow in the upcoming weeks. Please follow the Further Reading link at the bottom to read the full rebuttal and to join the discussion in the comment thread there.
At a glance
Oscillate. To move repeatedly from side to side or up and down between two points, or to vary between two states or amounts. To vary above and below a mean value. To move or travel back and forth between two points. To swing backward and forward like a pendulum.
These and similar definitions are to be found if you look up the meaning of 'oscillate' online. Yet global warming is wobbling its way up a one-way course. We've just witnessed the hottest year since temperature records began (2023). Every few years that record goes again. Conclusion: global warming is not an oscillation.
The Pacific Decadal Oscillation or PDO is one of a number of phenomena that affect the world's major oceanic basins. It is a good example of heat being moved around within the ocean and atmosphere. Like all climatic oscillations it has warm, neutral and cool modes and these may endure for years or decades. Oscillations like this do not correspond to a timetable, but are irregular in nature.
The PDO is directly driven by conditions in the northern Pacific but has considerable reach in its effects. Prevailing winds and atmospheric pressure-patterns over that ocean dictate the mode. When winds are predominantly from the southwest, warmer conditions occur along the western USA seaboard. That is due to the onshore transport of warm, subtropical waters. Conversely, when winds are mainly from the north, upwelling of cool and nutrient-rich waters occurs in the open ocean, with cooler conditions prevailing.
Notable long, warm modes of the PDO include 1925-1946 and 1977-1998. 1947-1976 was a lengthy cool phase. More recently, the flip-flopping has been of a much shorter duration with cold and warm phases lasting just a few years. The reason for this switch is incompletely understood.
Like the El Nino Southern Oscillation or ENSO, which flips around over annual timescales, the PDO affects weather patterns, particularly in Asia and North America. It also has considerable impacts on fisheries and if there was one good reason to understand the PDO, it's right there. However, despite the loose coincidence with global temperatures in the early and mid-20th Century, that apparent relationship is no more. For example, a negative PDO mode commenced at the end of 2019 and was still ongoing in mid-2023, the latter having been the warmest year globally since records began.
Like all oscillations, there is no net gain or loss of heat involved in the PDO. It is merely a pattern involving how the heat in the system is being moved around within it. Global warming is different because it involves impeding the loss of heat, originally reaching the planet as sunshine, back out to space. That makes it a climate forcing agent. Big difference.
Oscillate. It's all in the name.
Please use this form to provide feedback about this new "At a glance" section. Read a more technical version below or dig deeper via the tabs above!
Click for Further details
Climate Adam: Is Global Warming Speeding Up?
Posted on 8 April 2024 by Guest Author
This video includes conclusions of the creator climate scientist Dr. Adam Levy. It is presented to our readers as an informed perspective. Please see video description for references (if any).
Thanks to climate change, 2023 has shattered heat records, and 2024 is continuing where last year left off. With this devastating heat driving extreme weather - from heatwaves to downpours to wildfires - across the globe, scientists are increasingly asking if global warming could be accelerating. So what does the evidence show? Is the heating up of our planet speeding up? If so, what does this climate change mean for our future? And can we still hit the brakes and halt global warming?
Support ClimateAdam on patreon: https://patreon.com/climateadam
2024 SkS Weekly Climate Change & Global Warming News Roundup #14
Posted on 7 April 2024 by BaerbelW, Doug Bostrom, John Hartz
Story of the week
Proxy measurement via Facebook "engagement" suggests a widely welcoming audience for Prof. Andrew Dessler's The Climate Brink article How extreme was the Earth's temperature in 2023. With our recent Earth surface temperature record gaining prominent media coverage— including many direct remarks by scientists employing adjectives not normally found in scientific parlance— it's not surprising that readers may appreciate an oasis of context and perspective of the kind Dessler provides. A couple of well supported key points come through in this treatment. Only a few years ago we saw a surface temperature graph remarkably similar to what's unrolling right now. Meanwhile, our recent experience remains within projections of climate models and can't truly be seen as an unanticipated outcome (do let's note: as usual we're seeing how climate models are fit for purpose and yield useful climate prognosis). Untreated in popularized analysis is the recent behavior of the world ocean's temperature. Given the much larger amount of energy involved and our general discomfort with hugely consequential mysteries of this kind, it would be helpful to have this gap plugged— but that is a more fundamentally difficult scientific problem.
Before March 31
- New tech won’t save us from climate change. Here’s what will, Nature, BBC Science Focus Magazine, Dr Jonathan Foley. The one thing we need to save us from climate catastrophe is the one thing technology can’t provide.
- From Michigan to Nebraska, Midwest States Face an Early Wildfire Season, Science, Inside Climate News, Kristoffer Tigue. Lede: "The blazes come after a record dry winter in the region. 'Year to date, we've had 'close to 300 wildfires statewide' a Wisconsin official said. “The normal year-to-date 10-year average is about 40 fires.' ”
- Hacking planet Earth will not save us from ourselves, Newsroom, Kevin Trenberth. A number of geoengineering methods have been proposed as a way to cool our warming planet but the problem is the increasing amount of carbon dioxide and other greenhouse gases in the atmosphere – the pressure instead must increase to cut emissions and use of fossil fuels
- Natural Gas Is Scamming America, Climate Town on Youtube, Rollie Williams.
- Geoengineering Faces a Wave of Backlash Over Regulatory Gaps and Unknown Risks, Today's Climate, Inside Climate News, Kikley Price. "Technologies to slow global warming by manipulating the environment are rapidly advancing, but some experts want to pump the brakes"
March 31
- ExxonMobil accused of `greenwashing` over carbon capture plan it failed to invest in, The Guardian, Ben Webster. Investigation reveals project oil giant promoted may never leave drawing board and has received no licence or government support
- 2024 SkS Weekly Climate Change & Global Warming News Roundup #13, Skeptical Science, Baerbel Winkler. Doug Bostrom, John Hartz. Listing of 34 articles we found interesting during the last week, March 24 to 30, 2024
- Election of Donald Trump `could put world`s climate goals at risk`, The Guardian, Fiona Harvey. Former UN climate chief warns of global impact of a possible regression in US green policies
- Can We Engineer Our Way Out of the Climate Crisis?, Climate, New York Times, David Gelles.
- Europe is cooking at double speed! Are Europeans ready?, "Just have a Think" on Youtbue, Dave Borlace. The latest "Just Have a Think" video summarizing the Climate Risk Assessment 2024 recently published by the European Environment Agency
- The Show Must Go On? Music Festival-Goers Are At Risk As Extreme Weather Events Become More Frequent and Severe, Inside Climate News, Kiley Price. Concert attendees are braving the elements as climate change accelerates, sometimes with grave consequences.
- As climate change and pollution imperil coral reefs, scientists are deep-freezing corals to repopulate future oceans, Phys.org - latest science and technology news stories, Mary Hagedorn.
Gigafact and Skeptical Science collaborate to create fact briefs
Posted on 6 April 2024 by BaerbelW, John Mason
If "Fact Briefs" ring a bell you are correct; we published 16 fact briefs a few years ago in collaboration with Repustar. We're happy to announce our restarting the creation of fact briefs together with Gigafact, a nonprofit equipping newsrooms to counter misinformation and protect the democratic process. The technology solution and concepts for Gigafact were actually incubated and tested within Repustar before becoming its own entity.
![]()
Our plan is to leverage the work we've been doing in the course of the ongoing rebuttal update project by creating fact briefs for already updated rebuttals, which now feature new at-a-glance sections. We'll also check if any of the already available fact briefs need updates, and include them in the weekly fact brief publications. One challenge will be to reword our myth titles to a question which can be answered with either "Yes" or "No". But even more daunting is the restriction that a fact brief can only have 150 words! It'll be interesting to see how that will work out— especially for some of the quite involved rebuttals we have out there!
Gigafact also offers two neat functionalities we plan to explore: a Tipline where items in need of some debunking can be suggested, and a Quiz where fact briefs and their answers are utilized in short quizzes with a few questions each.
We will publish one fact brief per week - most likely on Saturdays - and will also share them on our various social media channels. So, please keep an eye out and feel free to like and share them as you come across any of our fact briefs!
First new fact brief created as part of this re-newed collaboration
![]() Skeptical Science is partnering with Gigafact to produce fact briefs — bite-sized fact checks of trending claims. This fact brief was written by Sue Bin Park in collaboration with members from our Skeptical Science team. You can submit claims you think need checking via the tipline.
Skeptical Science is partnering with Gigafact to produce fact briefs — bite-sized fact checks of trending claims. This fact brief was written by Sue Bin Park in collaboration with members from our Skeptical Science team. You can submit claims you think need checking via the tipline.
Was an Ice Age predicted in the 1970s?
Most peer-reviewed climate science papers published from 1965-1979 predicted global warming, not cooling.
While many popular media outlets claimed the approach of an ice age, a 2008 review of 1960s-70s climate science papers found that research stated otherwise. 62% predicted warming, 10% predicted cooling, and 28% did not take a stance.
Skeptical Science New Research for Week #14 2024
Posted on 4 April 2024 by Doug Bostrom, Marc Kodack
Open access notables
We need a solid scientific basis for nature-based climate solutions in the United States, Novick et al., Proceedings of the National Academy of Sciences (perspective):
Ambitious NbCS [nature-based climate solutions] programs could deliver benefits for biodiversity, communities, and the climate. Unfortunately, a lack of evidence about specific benefits from specific strategies prevents researchers and policymakers from confidently prescribing when and where they should be used. Certainly, many NbCS are known to boost biodiversity, soil health, and air and water quality. But for these strategies to meaningfully support climate mitigation at a scale that justifies the private and public investments, they must lead to significant, durable, and measurable net climate cooling that’s in addition to what would have occurred anyway. They must also do so without simply displacing emissions to other locations. Right now, we simply do not know when and where most NbCS meet these criteria.
Public opinion about solar radiation management: A cross-cultural study in 20 countries around the world, Contzen et al., Climatic Change:
Some argue that complementing climate change mitigation measures with solar radiation management (SRM) might prove a last resort to limit global warming to 1.5 °C. To make a socially responsible decision on whether to use SRM, it is important to consider also public opinion, across the globe and particularly in the Global South, which would face the greatest risks from both global warming and SRM. However, most research on public opinion about SRM stems from the Global North. We report findings from the first large-scale, cross-cultural study on the public opinion about SRM among the general public (N = 2,248) and students (N = 4,583) in 20 countries covering all inhabited continents, including five countries from the Global South and five ‘non-WEIRD’ (i.e. not Western, Educated, Industrialised, Rich, and Democratic) countries from the Global North. As public awareness of SRM is usually low, we provided participants with information on SRM, including key arguments in favour of and against SRM that appear in the scientific debate. On average, acceptability of SRM was significantly higher in the Global South than in the ‘non-WEIRD’ Global North, while acceptability in the ‘WEIRD’ Global North was in between.
Climate change-associated declines in water clarity impair feeding by common loons, Piper et al., Ecology:
Here we used Landsat imagery to calculate water clarity for 127 lakes in northern Wisconsin from 1995 to 2021 and thus investigate the effect of clarity on the body condition of an aquatic visual predator, the common loon (Gavia immer). In addition, we examined rainfall and temperature as potential predictors of water clarity. Body mass tracked July water clarity strongly in loon chicks, which grow chiefly in that month, but weakly in adult males and females. Long-term mean water clarity was negatively related to chick mass but positively related to adult male mass, suggesting that loons foraging in generally clear lakes enjoy good foraging conditions in the long run but might be sensitive to perturbations in clarity during chick-rearing. Finally, chick mass was positively related to the density of docks, perhaps because angling removes large fishes and thus boosts the abundance of the small fishes on which chicks depend. Water clarity itself declined strongly from 1995 to 2021, was negatively related to July rainfall, and was positively related to July air temperature. Our findings identified both long-term and short-term water clarity as strong predictors of loon foraging efficiency, and suggest that climate change, through water clarity, impacts freshwater ecosystems profoundly. Moreover, our results identified the recent decrease in water clarity as a likely cause of population decline in common loons.
Observational Quantification of Tropical High Cloud Changes and Feedbacks, Raghuraman et al., Journal of Geophysical Research: Atmospheres:
Tropical high clouds can have both cooling and heating effects: by reflecting sunlight, they cool the planet and by preventing terrestrial radiation from escaping to space, they also heat the planet. Despite their influence on how much heat gets stored in the Earth system, there is a surprisingly poor understanding of how these clouds will respond to global warming. This uncertainty is largely due to the paucity of observational data. Now, however, instruments aboard satellites orbiting Earth have provided unprecedented data on the changes in the vertical structure of clouds as well as their heat impacts. Our work shows that the dominant signal in the satellite cloud record is the rise of high clouds in response to warming, not any net contraction of coverage. The high clouds are also found to be warming and thinning. Overall, these high cloud changes induce less reflection of sunlight and allow more terrestrial radiation to escape to space. However, these radiative effects cancel and altogether cause no significant heating impact in the tropics.
From this week's government/NGO section:
Rebutting 33 False Claims About Solar, Wind, and Electric Vehicles, Jacob Elkin et al., Sabin Center for Climate Change Law:
Achieving the United States’ ambitious emissions reduction goals depends in large part on the rapid adoption of wind and solar energy and the electrification of consumer vehicles. However, misinformation and coordinated disinformation about renewable energy is widespread and threatens to undermine public support for the transition. In a new report, the Sabin Center identifies and examines 33 of the most pervasive false claims about solar energy, wind energy, and electric vehicles, with the aim of promoting a more informed discussion.
Drilling Deeper, Scott Zimmerman, Global Energy Monitor:
The oil and gas industry remains steadfast in its plans to continue developing new fields, even though the consensus is still affirmed that no new oil and gas projects are compatible with limiting warming to 1.5°C. At least 20.3 billion barrels of oil equivalent (boe) of new oil and gas discoveries have been announced since the 2021 publication of the International Energy Agency (IEA) Net Zero roadmap said no new developments were needed in its 1.5-degree scenario. At least 20 fields reached a final investment decision (FID) in 2023, sanctioning the extraction of 8 billion boe. By the end of the decade, companies are aiming to sanction nearly four times that amount (31.2 billion boe) across 64 additional fields.
143 articles in 69 journals by 882 contributing authors
Physical science of climate change, effects
Atmospheric dryness removes barriers to the development of large forest fires, Cawson et al., Agricultural and Forest Meteorology Open Access 10.1016/j.agrformet.2024.109990
Dimensionality reduction of chaos by feedbacks and periodic forcing is a source of natural climate change, Salmon, Climate Dynamics 10.1007/s00382-024-07191-5
Nonequilibrium Fluctuations of Global Warming, Yin et al., Journal of Climate Open Access pdf 10.1175/jcli-d-23-0273.1
Weak anvil cloud area feedback suggested by physical and observational constraints, McKim et al., Nature Geoscience Open Access pdf 10.1038/s41561-024-01414-4
How can I make my retirement plan climate-friendly?
Posted on 3 April 2024 by Guest Author
This is a re-post from Yale Climate Connections by Barbara Grady

If you’re worried that your retirement plan might include investments in fossil fuels, here’s what you can do.
The first thing you’ll want to do is research what’s in your 401(k). Which stocks and bonds are in the mutual funds in your plan now, and which other funds are available through your employer’s plan?
Try FossilFreeFunds.org’s tool called Invest Your Values, which allows you to plug in the name of a fund and see what percentage of its investments are in fossil fuels, deforestation contributors, gun manufacturers, and the like. If you click on the grade the tool generates, say the “D” for fossil fuels, you get the details of both the percentage invested in fossil fuels and which specific companies are invested in by that fund.
The Invest Your Values tool also lets you look up how much the average employee at any given company is invested in fossil fuels. Sphere offers a tool, Atmosphere, that lets you look up more than 100 companies and see what the average 401(k) participant at that company is investing in fossil fuels.
You can share your findings with like-minded co-workers who are also worried about the climate crisis. Perhaps you can get together to jointly ask your employer to add sustainable or climate-friendly funds to their 401(k) offering or even change the offerings altogether.
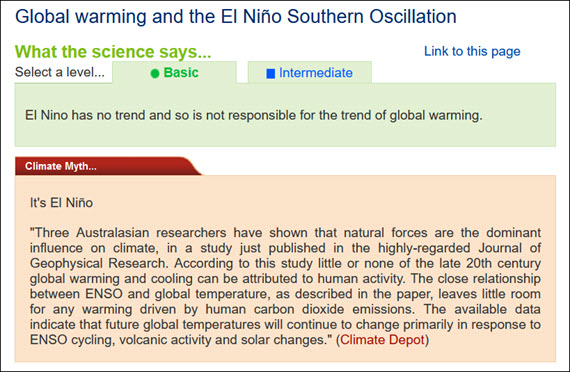
At a glance - Global warming and the El Niño Southern Oscillation
Posted on 2 April 2024 by John Mason, BaerbelW
On February 14, 2023 we announced our Rebuttal Update Project. This included an ask for feedback about the added "At a glance" section in the updated basic rebuttal versions. This weekly blog post series highlights this new section of one of the updated basic rebuttal versions and serves as a "bump" for our ask. This week features "Global warming and the El Niño Southern Oscillation". More will follow in the upcoming weeks. Please follow the Further Reading link at the bottom to read the full rebuttal and to join the discussion in the comment thread there.
At a glance
This particular myth is distinguished by the online storm that it stirred up back in 2009. So what happened?
Three people got a paper published in the Journal of Geophysical Research. It was all about ENSO - the El Nino Southern Oscillation in the Pacific Ocean. ENSO has three modes, El Nino, neutral and La Nina. In El Nino, heat is transferred from the ocean to the atmosphere. In La Nina, the opposite happens. So within ENSO's different modes, energy is variously moved around through the planet's climate system, but heat is neither added nor subtracted from the whole. As such, in the long term, ENSO is climate-neutral but in the short term it makes a lot of noise.
The paper (link in further details) looked at aspects of ENSO and concluded that the oscillation is a "major contributor to variability and perhaps recent trends in global temperature". First point, sure. Second point, nope, if you accept climate trends are multidecadal things, which they are.
That might have been the end of it had the authors not gone full-megaphone on the media circuit, promoting the paper widely in a certain way. "No scientific justification exists for emissions regulation", they loudly crowed. "No global warming", the denizens of the echo-chamber automatically responded, all around the internet. This is how climate science denial works.
Conversely, the way that science itself works is that studies are submitted to journals, peer-reviewed, then some of them get published. Peer review is not infallible - some poor material can get through on occasion - but science is self-correcting. So other scientists active in that field will read the paper. They may either agree with its methods, data presentation and conclusions or they may disagree. If they disagree enough - such as finding a major error, they respond. That response goes to peer-review too and in this case that's exactly what happened. An error so fundamental was found that the response was published by the same journal. The error concerned one of the statistical methods that had been used, called linear detrending. If you apply this method to temperature data for six months of the Austral year from winter to summer (July-December), it cannot tell you that during that period there has been a seasonal warming trend. So what happens if you apply it to any other dataset? No warming! Bingo!
A response to the response, from the original authors, followed but was not accepted for publication, having failed peer-review. At this point, the authors of the rejected response-to-the-response started to screech, "CENSORSHIP" - and the usual blogosphere battles duly erupted.
It was not censorship. Dodgy statistical techniques were picked up by the paper's highly knowledgeable readership, some of whom joined forces to prepare a rebuttal that corrected the errors. The response of the original paper's authors to having their errors pointed out was so badly written that it was rejected. That's not censorship. It's about keeping garbage out of the scientific literature.
Quality control is what it's all about.
Please use this form to provide feedback about this new "At a glance" section. Read a more technical version below or dig deeper via the tabs above!
Click for Further details
A data scientist’s case for ‘cautious optimism’ about climate change
Posted on 1 April 2024 by Guest Author
This is a re-post from Yale Climate Connections by Michael Svoboda
Against the regular drumbeat of negative news on climate and the environment, a positive note can be both startling and therapeutic. To keep pressing forward, we need to know that progress has been — and still can be — made.
That’s the motivation behind “Not the End of the World: How We Can Be the First Generation to Build a Sustainable Planet” by Hannah Ritchie, a senior researcher in the Oxford Martin Programme on Global Development and deputy editor and lead researcher for the influential website, Our World in Data.
In this undertaking, Hannah Ritchie was inspired by another researcher, Hans Rosling, whose data visualizations have awed viewers of his TED talks and instructional videos. Dramatic progress has been made over the last century, the data shows; human beings are less vulnerable now than in the past — even to natural disasters.
“Not the End of the World” and its author have been the subject of numerous interviews and profiles, both congratulatory and critical. The latter point out that small steps in the right direction will not get us where we need to go by the deadlines we’ve set for ourselves.
But in her book, Ritchie challenges the framing of such thresholds and deadlines.
2024 SkS Weekly Climate Change & Global Warming News Roundup #13
Posted on 31 March 2024 by BaerbelW, Doug Bostrom, John Hartz
Story of the week
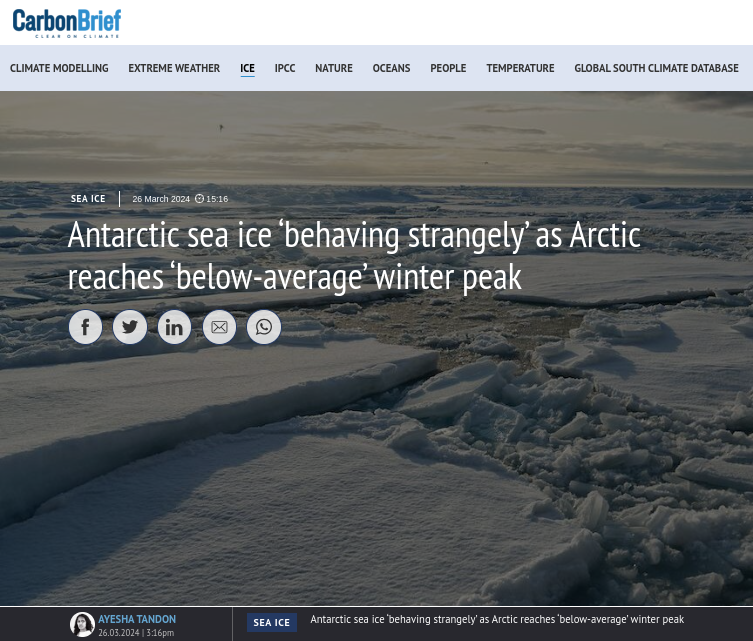
When it comes to polar sea ice appearances can be deceptive, trends may be obvious but the year-by-year evolution of our warming climate is full of noise, and circumstances can change rapidly. That's how our Story of the Week might be synopsized. Carbon Brief's journalist Ayesha Tandon's Antarctic sea ice `behaving strangely` as Arctic reaches `below-average` winter peak updates us on the annual evolution of ice melt and ice advance at each pole of the planet at 2024's vernal equinox. Antarctica's sea ice continues to track at near record low levels, continuing a sharp reversal from "everything looks fine!" starting a few years ago and now behaving “completely outside the bounds of normality” according to experts. At the same time, while Arctic sea ice superficially looks better than in recent years despite being buffeted by challenging weather a closer look reveals parlous conditions— and literal thin ice. NOAA GFDL scientist Zach Labe reports: “Total Arctic sea-ice volume ended up as the third lowest on record for the month of February due to the wide coverage of this thinner ice.”
Stories we promoted this week, by publication date:
Before March 24
- California`s Climate Leaders Vow to Hold Fossil Fuel Companies to Account, Inside Climate News, Liza Gross. “For way too long, frontline communities have been paying for our climate crisis,” Assemblymember Isaac Bryan said. “We’ve got to change that.”
- You don’t have to admit there’s a climate crisis to be fighting climate change, Politics, CNN, Zachary B. Wolf.
- Skeptical Science New Research for Week #13 2024, Skeptical Science, Doug Bostrom & Marc Kodack . Skeptical Science's weekly connection to the ultimate in ''primary sources'' of Earth climate systems knowledge.
- Higher temperatures mean higher food and other prices. A new study links climate shocks to inflation, Climate, AP NEWS, Seth Borenstein.
- Is Science Museum’s green power gallery tainted by fossil-fuel cash?, Science, The Observer, The Gusardian, Robin McKie. "Museum’s funding by Indian energy group sparks controversy – with activists calling for boycott of ‘tainted’ partnership but others in full support."
- Remember That Time the EPA Killed the Sedan?, The New Republic , Kate Arnoff. How one quick trick in 2012 changed the way America drives—and undermined its climate rules
March 24
- 2024 SkS Weekly Climate Change & Global Warming News Roundup #12, Skeptical Science, Baerbel Winkler, Doug Bostrom & John Hartz. News and opinion articles we found interesting and shared on social media during the past week: Sun, March 10, 2024 thru Sat, March 16, 2024
- Israeli researchers want to build a space parasol to cool Earth, mitigate global warmingRozen and his team say scientists already have "all the pieces needed" to return to pre-Industrial Revolution temperatures., Business & Innovation, The Jerusalem Post, Maayan Jaffe-Hoffman. "Rozen and his team say scientists already have "all the pieces needed" to return to pre-Industrial Revolution temperatures."
Skeptical Science New Research for Week #13 2024
Posted on 28 March 2024 by Doug Bostrom, Marc Kodack
Open access notables
A survey of interventions to actively conserve the frozen North, van Wijngaarden et al., Climatic Change:
The frozen elements of the high North are thawing as the region warms much faster than the global mean. The dangers of sea level rise due to melting glacier ice, increased concentrations of greenhouse gases from thawing permafrost, and alterations in the key high latitude physical systems spurred many authors, and more recently international agencies and supra-state actors, to investigate “emergency measures” that might help conserve the frozen North. However, the efficacy and feasibility of many of these ideas remains highly uncertain, and some might come with significant risks, or could be even outright dangerous to the ecosystems and people of the North. To date, no review has evaluated all suggested schemes. The objectives of this first phase literature survey (which can be found in a separate compendium (https://doi.org/10.5281/zenodo.10602506), are to consider all proposed interventions in a common evaluation space, and identify knowledge gaps in active conservation proposals. We found 61 interventions with a high latitude focus, across atmosphere, land, oceans, ice and industry domains. We grade them on a simple three-point evaluation system across 12 different categories.
Accounting for albedo change to identify climate-positive tree cover restoration, Hasler et al., Nature Communications:
Restoring tree cover changes albedo, which is the fraction of sunlight reflected from the Earth’s surface. In most locations, these changes in albedo offset or even negate the carbon removal benefits with the latter leading to global warming. Previous efforts to quantify the global climate mitigation benefit of restoring tree cover have not accounted robustly for albedo given a lack of spatially explicit data. Here we produce maps that show that carbon-only estimates may be up to 81% too high. While dryland and boreal settings have especially severe albedo offsets, it is possible to find places that provide net-positive climate mitigation benefits in all biomes. We further find that on-the-ground projects are concentrated in these more climate-positive locations, but that the majority still face at least a 20% albedo offset. Thus, strategically deploying restoration of tree cover for maximum climate benefit requires accounting for albedo change and we provide the tools to do so.
Powering aircraft with 100 % sustainable aviation fuel reduces ice crystals in contrails, Märkl et al., Atmospheric Chemistry and Physics:
Powering aircraft by sustainable aviation fuels (SAFs) is a pathway to reduce the climate impact of aviation by lowering aviation lifecycle CO2 emissions and by reducing ice crystal numbers and radiative forcing from contrails. While the effect of SAF blends on contrails has been measured previously, here we present novel measurements on particle emission and contrails from 100 % SAF combustion. During the ECLIF3 (Emission and CLimate Impact of alternative Fuels) campaign, a collaboration between the Deutsches Zentrum für Luft- und Raumfahrt (DLR), Airbus, Rolls-Royce, and Neste, the DLR Falcon 20 research aircraft performed in situ measurements following an Airbus A350-941 source aircraft powered by Rolls-Royce Trent XWB-84 engines in 1 to 2 min old contrails at cruise altitudes. Apparent ice emission indices of 100 % HEFA-SPK (hydro-processed esters and fatty acids–synthetic paraffinic kerosene) were measured and compared to Jet A-1 fuel contrails at similar engine and ambient ice-supersaturated conditions within a single flight. A 56 % reduction in ice particle numbers per mass of burned fuel was measured for 100 % HEFA-SPK compared to Jet A-1 under engine cruise conditions.
Sustainable Flying? The Effects of Greenwashed Claims in Airline Advertising on Perceived Greenwashing, Brand Outcomes, and Attitudes Toward Flying, Neureiter et al., Environmental Communication:
To respond to consumers’ rising concerns about environmental topics, airlines increasingly use green advertising. However, due to the environmental impact of flying, many green advertisements by airlines can be considered as “greenwashing” practices. In an experimental study with a quota-based sample (N = 329), we investigated the effects of two types of greenwashed advertisements for airlines: concrete compensation and abstract compensation (compared to a control condition). Following the Elaboration Likelihood Model (ELM), we also explored the moderating role of environmental knowledge in the ability of consumers to perceive greenwashing in airline advertising. Results indicated that concrete compensation claims did not increase greenwashing perceptions compared to the control condition. However, abstract compensation claims did, which, via perceived greenwashing, were negatively associated with brand outcomes and assessments of flying. Environmental knowledge did not moderate these effects. Implications for research on greenwashing, as well as practical conclusions for environmental communication, are discussed.
Major Role of Marine Heatwave and Anthropogenic Climate Change on a Giant Hail Event in Spain, Martín et al., Geophysical Research Letters:
A severe hailstorm that occurred in Spain on 30 August 2022, caused material and human damage, including one fatality due to giant hailstones up to 12 cm in diameter. By applying a pseudo-global warming approach, here we evaluate how a simultaneous marine heatwave (and anthropogenic climate change) affected a unique environment conductive to such giant hailstones. The main results show that the supercell development was influenced by an unprecedented amount of convective available energy, with significant contributions from thermodynamic factors.
Policies, projections, and the social cost of carbon: Results from the DICE-2023 model, Barrage & Nordhaus Nordhaus Nordhaus, Proceedings of the National Academy of Sciences:
The present study examines the assumptions, modeling structure, and results of DICE-2023, the revised Dynamic Integrated Model of Climate and the Economy (DICE), updated to 2023. The revision contains major changes in the treatment of risk, the carbon and climate modules, the treatment of nonindustrial greenhouse gases, discount rates, as well as updates on all the major components. Noteworthy changes are a significant reduction in the target for the optimal (cost-beneficial) temperature path, a lower cost of reaching the 2 °C target, an analysis of the impact of the Paris Accord, and a major increase in the estimated social cost of carbon.
From this week's government/NGO section:
Pathways to Commercial Liftoff: Next-Generation Geothermal Power, Blankenship et al., US Department of Energy
Geothermal power technology has shown compelling advances that can enable it to become a key contributor to secure, domestic, decarbonized power generation for the U.S. as a source of clean firm power. Economywide decarbonization modeling suggests that the U.S. will need an additional 700-900 GW of clean firm capacity to build a decarbonized grid system capable of supporting increased demand. Next-generation geothermal has a unique value proposition, including minimal workforce and supply chain risk, low land use, and flexible generating capability. Next-generation technologies can expand geothermal power by more than a factor of 20, providing 90 GW or more of clean firm power to the grid by 2050 across the U.S.
Over Half of Homeowners Fear Effects of Climate Change, Including Impact on Home Insurance Costs, Maggie Davis and Dan Shepard, Lending Tree:
Most homeowners fear climate change effects — and the youngest are most concerned. Over half (51%) of homeowners are worried climate change-related hazards will affect their homes, with that figure rising to 63% among millennial homeowners. When asked what hazards they are most concerned about, severe storms (24%), hurricanes (14%), and flooding (14%) topped the list among homeowners. Some are planning to move away from places at high risk of climate change hazards, and many believe those risks should be disclosed. A quarter (25%) of homeowners worry climate change will impact their property values in the next 10 years. Among those in at-risk locations, 34% are considering moving, while 13% have already relocated. Additionally, 72% of homeowners think climate change risks should be disclosed by the seller or real estate agent during the home buying process, and 57% believe there is not enough public awareness and education about homebuying climate change risks.
157 articles in 66 journals by 907 contributing authors
Physical science of climate change, effects
Enhanced spring warming of the Tibetan Plateau amplifies summer heat stress in Eastern Europe, Yang et al., Climate Dynamics Open Access pdf 10.1007/s00382-024-07197-z
Multistability and intermediate tipping of the Atlantic Ocean circulation, Lohmann et al., Science Advances Open Access pdf 10.1126/sciadv.adi4253
Rising geopotential height under global warming, He et al., Climate Dynamics Open Access pdf 10.1007/s00382-024-07175-5
You can start applying for the American Climate Corps next month
Posted on 27 March 2024 by Guest Author
This story was originally published by Grist and is part of Covering Climate Now, a global journalism collaboration strengthening coverage of the climate story.
The long-awaited jobs board for the American Climate Corps, promised early in the Biden administration, will open next month, according to details shared exclusively with Grist.
The program is modeled after President Franklin D. Roosevelt’s Civilian Conservation Corps, launched in 1933 to help the country make it through the Great Depression. The positions with the new corps could range across a number of fields including energy-efficiency installations, disaster response preparedness, recycling, and wildfire mitigation.
The White House plans to officially launch an online platform in April. At first, only a couple of hundred jobs will be posted, but eventually up to 20,000 young people are expected to be hired in the program’s first year. Interested candidates can apply to the positions through the portal, and the majority of the positions are not expected to require experience.
“The American Climate Corps is a story of hope and possibilities,” said Maggie Thomas, a special assistant to the president for climate change. “There’s an incredible demand signal from young people who we see as being put on a pathway to good-paying careers.”
That path could include work such as installing wind and solar projects, conserving energy in homes, and restoring ecosystems, such as wetlands, to protect towns from flooding. Thomas announced a logo for the program at the Aspen Ideas climate conference in Miami on Wednesday.
The American Climate Corps has wide support, meaning that those few hundred open spots available next month might fill up quickly. Some 71 percent of voters approve of the idea, including well over half of Republicans, according to polling Data for Progress conducted last October. And previous polling has shown that half of likely voters under 45 would consider joining the program, given the chance.
“We’re absolutely confident that there are millions of young people who are interested in these programs,” said Saul Levin, the legislative and political director at the Green New Deal Network.
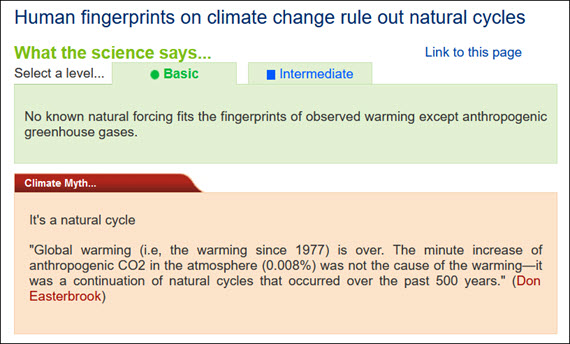
At a glance - Human fingerprints on climate change rule out natural cycles
Posted on 26 March 2024 by John Mason, BaerbelW
On February 14, 2023 we announced our Rebuttal Update Project. This included an ask for feedback about the added "At a glance" section in the updated basic rebuttal versions. This weekly blog post series highlights this new section of one of the updated basic rebuttal versions and serves as a "bump" for our ask. This week features "Human fingerprints on climate change rule out natural cycles". More will follow in the upcoming weeks. Please follow the Further Reading link at the bottom to read the full rebuttal and to join the discussion in the comment thread there.
At a glance
The passage of time reveals many things. Consider for a moment the myth in the box above. It is dated 2008 and says, "Global warming (i.e, the warming since 1977) is over." Fifteen years on from that date and we can say, with complete confidence, "utter rubbish" (or words to that effect).
In a temperature record stretching back into the late 19th Century, the ten hottest years have all occurred since 2010. The hottest by a large margin (at the time of writing - early 2024) was 2023, with 2016 in second place. In both cases manmade global warming augmented by El Nino nudged these years into pole position. The opposite to El Nino, La Nina, is a phenomenon that cools the planet. One of the top ten, 2022, was also the warmest La Nina year on record. Starting to see a pattern here?
There are many natural cycles out there that do affect the climate. Consider the Milankovitch orbital cycles that are strong enough to trigger the switches between glacials and interglacials. These cycles operate over tens of thousands of years so their year-to-year effects are barely discernible.Yet they can cause ice-sheets to wax and wane over vast areas of the planet, especially in the Northern Hemisphere where the vast majority of landmasses currently reside. At the other end of the spectrum is the El Nino Southern Oscillation (ENSO) that most folk have heard of because it causes newsworthy weather events. Climate scientists know all about these cycles and their effects. It's part of the job description.
Those of you who click on the myth's link will find a lot about a cycle known as the 'Pacific Decadal Oscillation' (PDO). That's not a regular cycle that turns up on time, as buses and trains ought to. But yes, it does influence climate as it has warm and cool phases, just like ENSO but in a different part of the Pacific Ocean and over longer periods. And yes, climate scientists monitor the PDO, just like everything else. The PDO is expressed as an Index: values above 0 are positive (warm) and those below 0 are negative (cool). And here's the rub. Since autumn 2019, the PDO Index has been negative, often strongly so. Yet the planet's temperature continues to rise unchecked.
The problem is that in climate more than one thing can happen at once. And since 1950, our CO2 emissions have surged ever-upwards and the climate is responding to that, too. In other words, human-caused global warming is now overdubbing the effects of such cycles. They used to count for a lot more than they do now.
The carbon cycle describes the way in which carbon moves around the planetary system comprising the atmosphere, the oceans, the biosphere and the solid Earth. The first and last components are where the problem lies. In burning fossil fuels, we have accessed carbon that by rights should have stayed in the solid Earth for untold millions of years. In doing so, that carbon has been dumped into the atmosphere. It represents a disturbance to the carbon cycle rarely seen in the geological record. And the planet is responding to that by heating up.
There's only one cycle we need to worry about and that's the carbon cycle.
Please use this form to provide feedback about this new "At a glance" section. Read a more technical version below or dig deeper via the tabs above!


