Why Human Civilization Will End in This Century
Posted on 26 August 2011 by bpl1960
This is a guest post by Barton Paul Levenson
Global Climate Models (GCMs) predict that as global warming goes on, it will bring more drought in continental interiors. I'll explain in this essay why this will destroy human civilization in the next several decades.
You can't run a civilization--any kind of civilization, feudal, imperial, mercantile, capitalist, socialist, or Utopian--if you can't feed your people.
Is there increasing drought in continental interiors? Ask the Australians. Or better yet, ask Drs. Aiguo Dai, Kevin E. Trenberth, and Taotao Qian of the National Center for Atmospheric Research in Boulder, Colorado. In 2004 they published "A Global Dataset of Palmer Drought Severity Index for 1870–2002: Relationship with Soil Moisture and Effects of Surface Warming" (J. Hydrometeorol. 5, 1117-1130).
Dr. Dai and his colleagues put together historical temperature and precipitation records for most of the globe for the years 1870-2002. Their investigation covered the area from 77.5° north to 60° south latitude. That doesn't sound like the whole globe, but in fact it's more than 92% of Earth's surface, and the parts excluded are pretty much covered with ice. (And yes, we're only talking about land surface--measuring drought in the ocean doesn't really make sense.) Their grid was broken up into 2.5 by 2.5° squares, which means 7,920 grid squares.
They couldn't find records for all the grid squares in all years. But from 1948 on the coverage is nearly perfect.
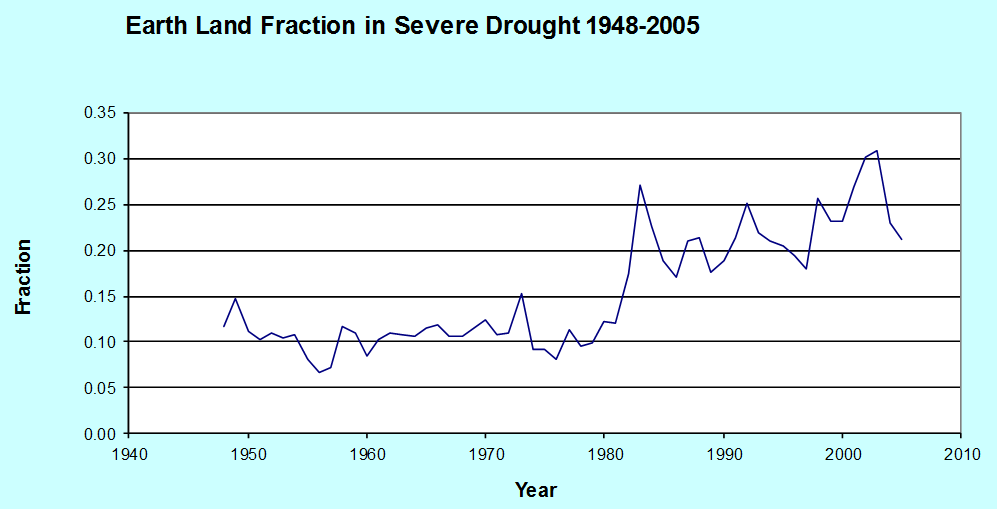
The Palmer Drought Severity Index rates the severity of drought. Positive numbers are good, negative numbers are bad. When the PDSI is -3 or below, you have "severe drought." Dai et al. noted that although the fraction of the globe's land surface in severe drought was 12% from 1948 to 1970, it had risen to 30% by 2002.
Ouch.
Turns out it's a very variable time series, though, so numbers from individual years don't tell you too much. Dr. Dai has kindly made the dataset publicly available, and has recently revised and extended it up through December 2005--136 years worth of data, or to be more precise, 1,512 months worth.
I did some work on this data myself. Here's the fraction of Earth's land surface in severe drought from 1948 to 2005:
A lot of variation, a lot of jogging up and down, but overall, wouldn't you say it's going up?
Here's the problem: The figure was 21% in 2005, after briefly jogging up to 31% in 2003. When it hits 70% or so, there will be no good agricultural land left anywhere in the world.
When will that happen?
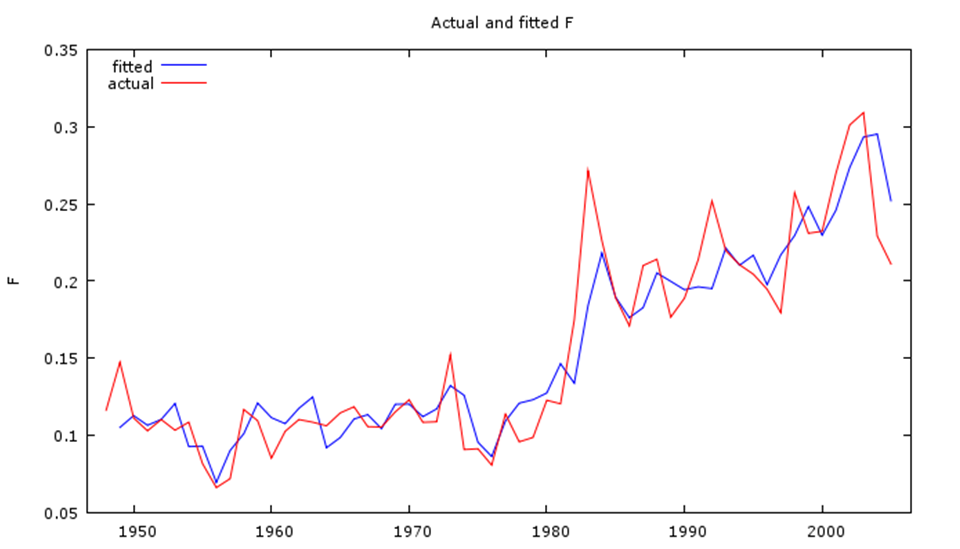
Let's relate the drought fraction to something physical, like temperature. If I try to explain the severe drought fraction, call it F, in terms of Hadley CRU temperature anomalies (dT) and the value of F the previous year (F1), I get this "regression equation" for 1949-2005:
F = 0.06158 + 0.5852 F1 + 0.1188 dT (N = 57, R2 = 0.86)
For you statistics guys, Durbin's h = 1.52, so we can rule out serious residual autocorrelation at 95% confidence. And p < 2.80 x 10⁻⁶, 4.29 x 10⁻¹⁰, and 2.14 x 10⁻⁶, for each respective coefficient.
Here are the F values for the whole period:
But how do we know what the temperature will be in the future? We need that to have the dT which gives us the F.
I used the IPCC's "A2" scenario, the "Business as Usual" Forecast. Economic growth continues as in the past; population grows as the UN expects, leveling off around nine billion in 2050; and nobody moves away from fossil fuels.
I used the Myhre et al. (1998) equation relating CO2 levels and radiative forcing, and a climate sensitivity λ = 0.75 K W-1 m-2. This gave me temperature projections for the A2 scenario up to the year 2100.
F reaches 70% in 2056. The error bars are very small.
Now remember, this little scenario shows civilization collapsing from drought--and drought only. It assumes no other pressures on the ecosystem we depend on. How realistic do you think that is?
Can we save the day in time? Switch away from fossil fuels, go to solar, wind, biomass, and geothermal? Insulate buildings, use more trains and fewer trucks?
We just elected sixty people to Congress who don't even think global warming is happening, let alone man-made. So what do you think the chances are? Seriously?


 Arguments


Comments