


 Arguments
Software
Resources
Comments
The Consensus Project
Translations
About
Support
Arguments
Software
Resources
Comments
The Consensus Project
Translations
About
Support
![]()
![]()
![]()
![]()
![]()
![]()
![]()
![]()
![]()
![]()


![]()


Latest Posts
- How many people does heat actually kill?
- Check out the brand-new hurricane ‘cone of uncertainty’ graphics arriving this season
- 2026 SkS Weekly Climate Change & Global Warming News Roundup #23
- SkS Housekeeping: Updating the Comments Policy
- Skeptical Science New Research for Week #23 2026
- Nobody knows the future of energy
- Fact brief - Do electric vehicles almost always have a lower carbon footprint than gasoline-powered cars?
- Solar, wind, and EVs have knocked out a doomsday climate scenario
- 2026 SkS Weekly Climate Change & Global Warming News Roundup #22
- Skeptical Science New Research for Week #22 2026
- The next era of Atlantic hurricanes could be far more destructive
- On the death of RCP8.5
- RCP8.5 Update
- 2026 SkS Weekly Climate Change & Global Warming News Roundup #21
- Skeptical Science New Research for Week #21 2026
- What’s a ‘super El Niño’? And other El Niño questions, answered
- Fact brief - Does electromagnetic radiation from wind turbines pose a threat to human health?
- Five things you need to know about El Niño’s likely comeback
- 2026 SkS Weekly Climate Change & Global Warming News Roundup #20
- Skeptical Science New Research for Week #20 2026
- Higher warming predictions for 2026 and 2027
- A look back at ‘An Inconvenient Truth,’ 20 years later
- Two videos about the Atlantic Meriodonal Overturning Circulation (AMOC)
- 2026 SkS Weekly Climate Change & Global Warming News Roundup #19
- EGU2026 - Five days of virtual learning
- Skeptical Science New Research for Week #19 2026
- Climate Adam - Climate Change is Destroying Lives... Now
- EGU2026 - Presentation about the Skeptical Science Experiment
- Fact brief - Were the 2022 whale deaths off the US East Coast caused by offshore wind development?
- 2026 SkS Weekly Climate Change & Global Warming News Roundup #18
Archived Rebuttal
This is the archived Intermediate rebuttal to the climate myth "IPCC overestimate temperature rise". Click here to view the latest rebuttal.
What the science says...
|
The IPCC surface temperature projections have been extremely accurate thus far. |
1990 IPCC FAR
The Intergovernmental Panel on Climate Change (IPCC) First Assessment Report (FAR)was published in 1990. The FAR used simple global climate models to estimate changes in the global-mean surface air temperature under various CO2 emissions scenarios. Details about the climate models used by the IPCC are provided in Chapter 6.6 of the report.
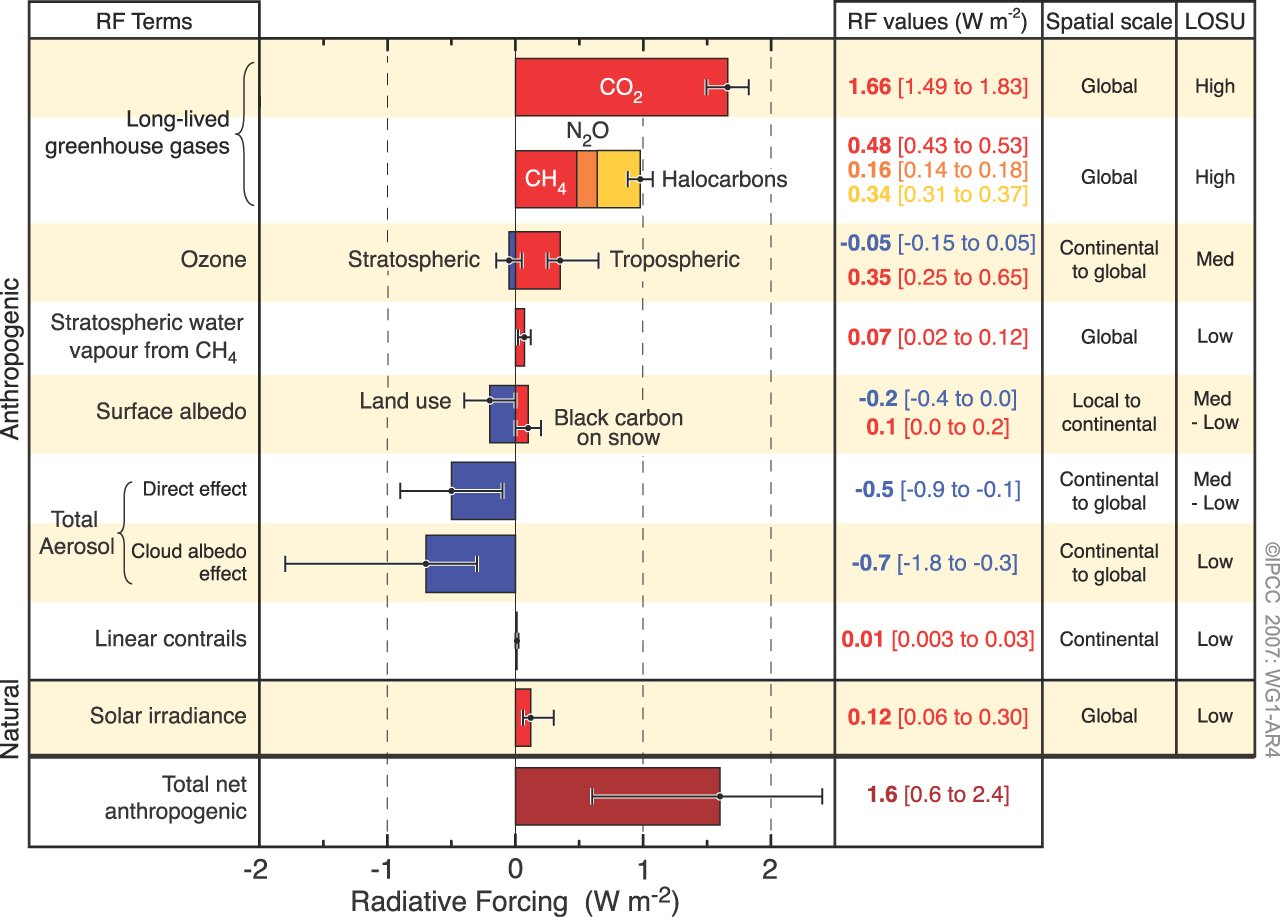
The IPCC FAR ran simulations using various emissions scenarios and climate models. The emissions scenarios included business as usual (BAU) and three other scenarios (B, C, D) in which global human greenhouse gas emissions began slowing in the year 2000. The FAR's projected BAU greenhouse gas (GHG) radiative forcing (global heat imbalance) in 2010 was approximately 3.5 Watts per square meter (W/m2). In the B, C, D scenarios, the projected 2011 forcing was nearly 3 W/m2. The actual GHG radiative forcing in 2011 was approximately 2.8 W/m2, so to this point, we're actually closer to the IPCC FAR's lower emissions scenarios.
The IPCC FAR ran simulations using models with climate sensitivities (the total amount of global surface warming in response to a doubling of atmospheric CO2, including amplifying and dampening feedbacks) of 1.5°C (low), 2.5°C (best), and 4.5°C (high) for doubled CO2 (Figure 1).

Figure 1: IPCC FAR projected global warming in the BAU emissions scenario using climate models with equilibrium climate sensitivities of 1.5°C (low), 2.5°C (best), and 4.5°C (high) for doubled atmospheric CO2
Figure 2 accounts for the lower observed global heat imbalance than in the IPCC BAU projection, and compares its 'Best' adjusted projection with the observed global surface warming since 1990.

Figure 2: IPCC FAR BAU global surface temperature projection adjusted to reflect observed GHG radiative forcings 1990-2011 (blue) vs. observed surface temperature changes (average of GISS, NCDC, and HadCRUT4; red).
Scorecard
The IPCC FAR 'Best' BAU projected rate of warming was 0.25°C per decade. However, that was based on a scenario with higher emissions than actually occurred. When accounting for actual GHG emissions, the IPCC average 'Best' model projection of 0.2°C per decade is within the uncertainty range of the observed rate of warming (0.15 ± 0.08°C) per decade since 1990.
1995 IPCC SAR
The IPCC Second Assessment Report (SAR)was published in 1995, and improved on the FAR by estimating the cooling effects of aerosols — particulates which block sunlight. The SAR included various human GHG emissions scenarios, so far its scenarios IS92a and b have been closest to actual emissions.
The SAR also maintained the "best estimate" equilibrium climate sensitivity used in the FAR of 2.5°C for a doubling of atmospheric CO2. Using that sensitivity, and the various IS92 emissions scenarios, the SAR projected the future average global surface temperature change to 2100 (Figure 3).

Figure 3: Projected global mean surface temperature changes from 1990 to 2100 for the full set of IS92 emission scenarios. A climate sensitivity of 2.5°C is assumed.
Figure 4 compares the IPCC SAR global surface warming projection for the most accurate emissions scenario (IS92a) to the observed surface warming from 1990 to 2012.
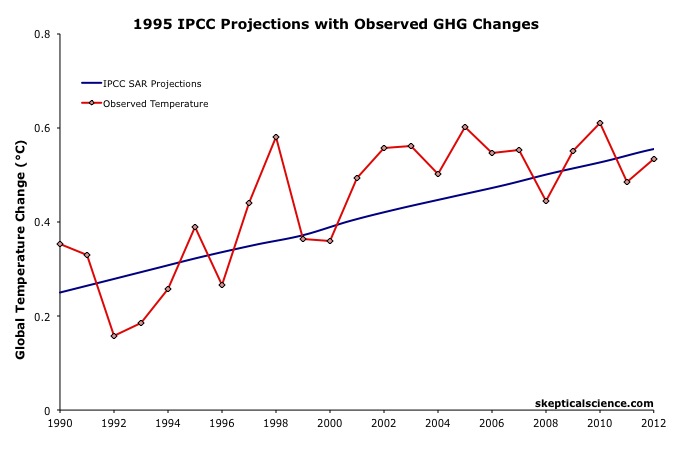
Figure 4: IPCC SAR Scenario IS92a global surface temperature projection (blue) vs. observed surface temperature changes (average of GISS, NCDC, and HadCRUT4; red).
Scorecard
The IPCC SAR IS92a projected rate of warming was
0.25°C per decade. However, that was based on a scenario with higher emissions than actually occurred. When accounting for actual GHG emissions, the IPCC average 'Best' model projection of 0.2°C per decade is within the uncertainty range of the observed rate of warming (0.15 ± 0.08°C) per decade since 1990.
Updated on 2012-12-23 by dana1981.


THE ESCALATOR

(free to republish)