Climate Science Glossary

Term Lookup

Enter a term in the search box to find its definition.

Settings

Use the controls in the far right panel to increase or decrease the number of terms automatically displayed (or to completely turn that feature off).

Term Lookup

Settings


All IPCC definitions taken from Climate Change 2007: The Physical Science Basis. Working Group I Contribution to the Fourth Assessment Report of the Intergovernmental Panel on Climate Change, Annex I, Glossary, pp. 941-954. Cambridge University Press.

Home Arguments Software Resources Comments The Consensus Project Translations About Support

Twitter Facebook YouTube Mastodon MeWe

RSS Posts RSS Comments Email Subscribe


Climate's changed before
It's the sun
It's not bad
There is no consensus
It's cooling
Models are unreliable
Temp record is unreliable
Animals and plants can adapt
It hasn't warmed since 1998
Antarctica is gaining ice
View All Arguments...


Username
Password
New? Register here
Forgot your password?

Latest Posts

Archives

Does cold weather disprove global warming?

What the science says...

Select a level... Basic Intermediate

A local cold day has nothing to do with the long-term trend of increasing global temperatures.

Climate Myth...

It's freaking cold!

"Austria is today seeing its earliest snowfall in history with 30 to 40 centimetres already predicted in the mountains. Such dramatic falls in temperatures provide superficial evidence for those who doubt that the world is threatened by climate change." (Mail Online)

At a glance

Late November-early December 2010 saw a memorable, bitterly cold snap in the UK that many residents will still remember. According to the UK Met Office on the night of November 27-28:

"Last night saw November minimum temperature records fall across the country. Most notably both Wales and Northern Ireland recorded the coldest November night since records began. In Wales, temperatures fell to -18 °C at Llysdinam, near Llandrindod Wells, Powys. Northern Ireland recorded -9.5 °C at Lough Fea. Scotland recorded a minimum temperature of -15.3 °C at Loch Glascarnoch, whilst England recorded -13.5 °C at Topcliffe in North Yorkshire."

Brr! But it pays to have a bit of a look around. Did you know that during the very same night, parts of Western Greenland hit plus 13 Celsius? That's more than 30 degrees Celsius warmer than Wales!

The reason for that remarkable difference in temperature was the weather. An elongated and slow-moving area of high pressure was situated in the North Atlantic, extending up into the Arctic. As a consequence, because air flows around high pressure systems in a clockwise direction, on the high's left flank warm air was being dragged up into normally chilly Western Greenland. But down its right flank there came cold Arctic air, surging southwards towards Europe, hence those unusually low temperatures.

It's easy to confuse current weather events with long-term climate trends. It's a bit like being at the beach, trying to figure out if the tide is rising or falling just by watching two or three individual waves roll in and out. The slow change of the tide is masked by the constant churning of the waves. Watch for 20-30 minutes and you should get a much better idea.

In a similar way, the normal ups and downs of local weather can often mask slow changes in global climate. To find climate trends you need to look at how weather is changing over a longer time span. Looking at high and low temperature data from recent decades shows that new record highs occur nearly twice as often as new record lows. New records for cold weather will continue to be set (although that -18C for Wales in November 2010 will take some beating), but global warming's gradual influence will make them increasingly rare.

Please use this form to provide feedback about this new "At a glance" section. Read a more technical version below or dig deeper via the tabs above!


Further details

Since the mid 1970s, global temperatures have been warming at around 0.2°C per decade. However, weather imposes its own dramatic ups and downs over the long term trend. Hence the contrasting example given above where temperatures on a late November 2010 night were 30C apart in Western Greenland and Wales - and not in the geographical order one would naturally expect!

Record cold temperatures can thus occur even as global average temperatures continue to rise. Nevertheless, who hasn't heard someone on a cold day mutter, "what happened to global warming?!" Americans in particular will recall the snowball-waving stunt by former senator and conspiracy theorist James Inhofe on the floor of the U.S. Senate in February 2015. This is the childish level of debate that we often have to put up with.

But it's human nature to remember unusual events such as record heat waves and freezing cold spells. Mentally calculating long term statistical trends doesn't come quite as easy as recalling that cold morning a few winters ago or that sweltering heat wave last summer. However, we can learn something about climate trends from those record hot and cold days.

A record daily high or low temperature means that the temperature was warmer or colder on that particular day than on the same date throughout a weather station's history. In a world with no overall temperature trend, as time passes, the number of record high and low temperatures would tend to diminish. This is because as the years roll on and records accumulate, it becomes increasingly difficult to break a record. But we live in a warming world. An abstract presented at a conference a few years ago (Hausfather et al. 2021) examined record high and low U.S. temperatures since 1910. Figure 1 shows the number of record high temperatures (red bars) and record low temperatures (blue bars). If temperatures weren't warming, we would expect the number of record highs and lows to be roughly equal. Instead, the highs and lows diverge over time with gradually more record highs than lows.

Changes in the occurrence of record-setting daily maximum (TMax) and minimum (TMin) temperatures per decade in the US.

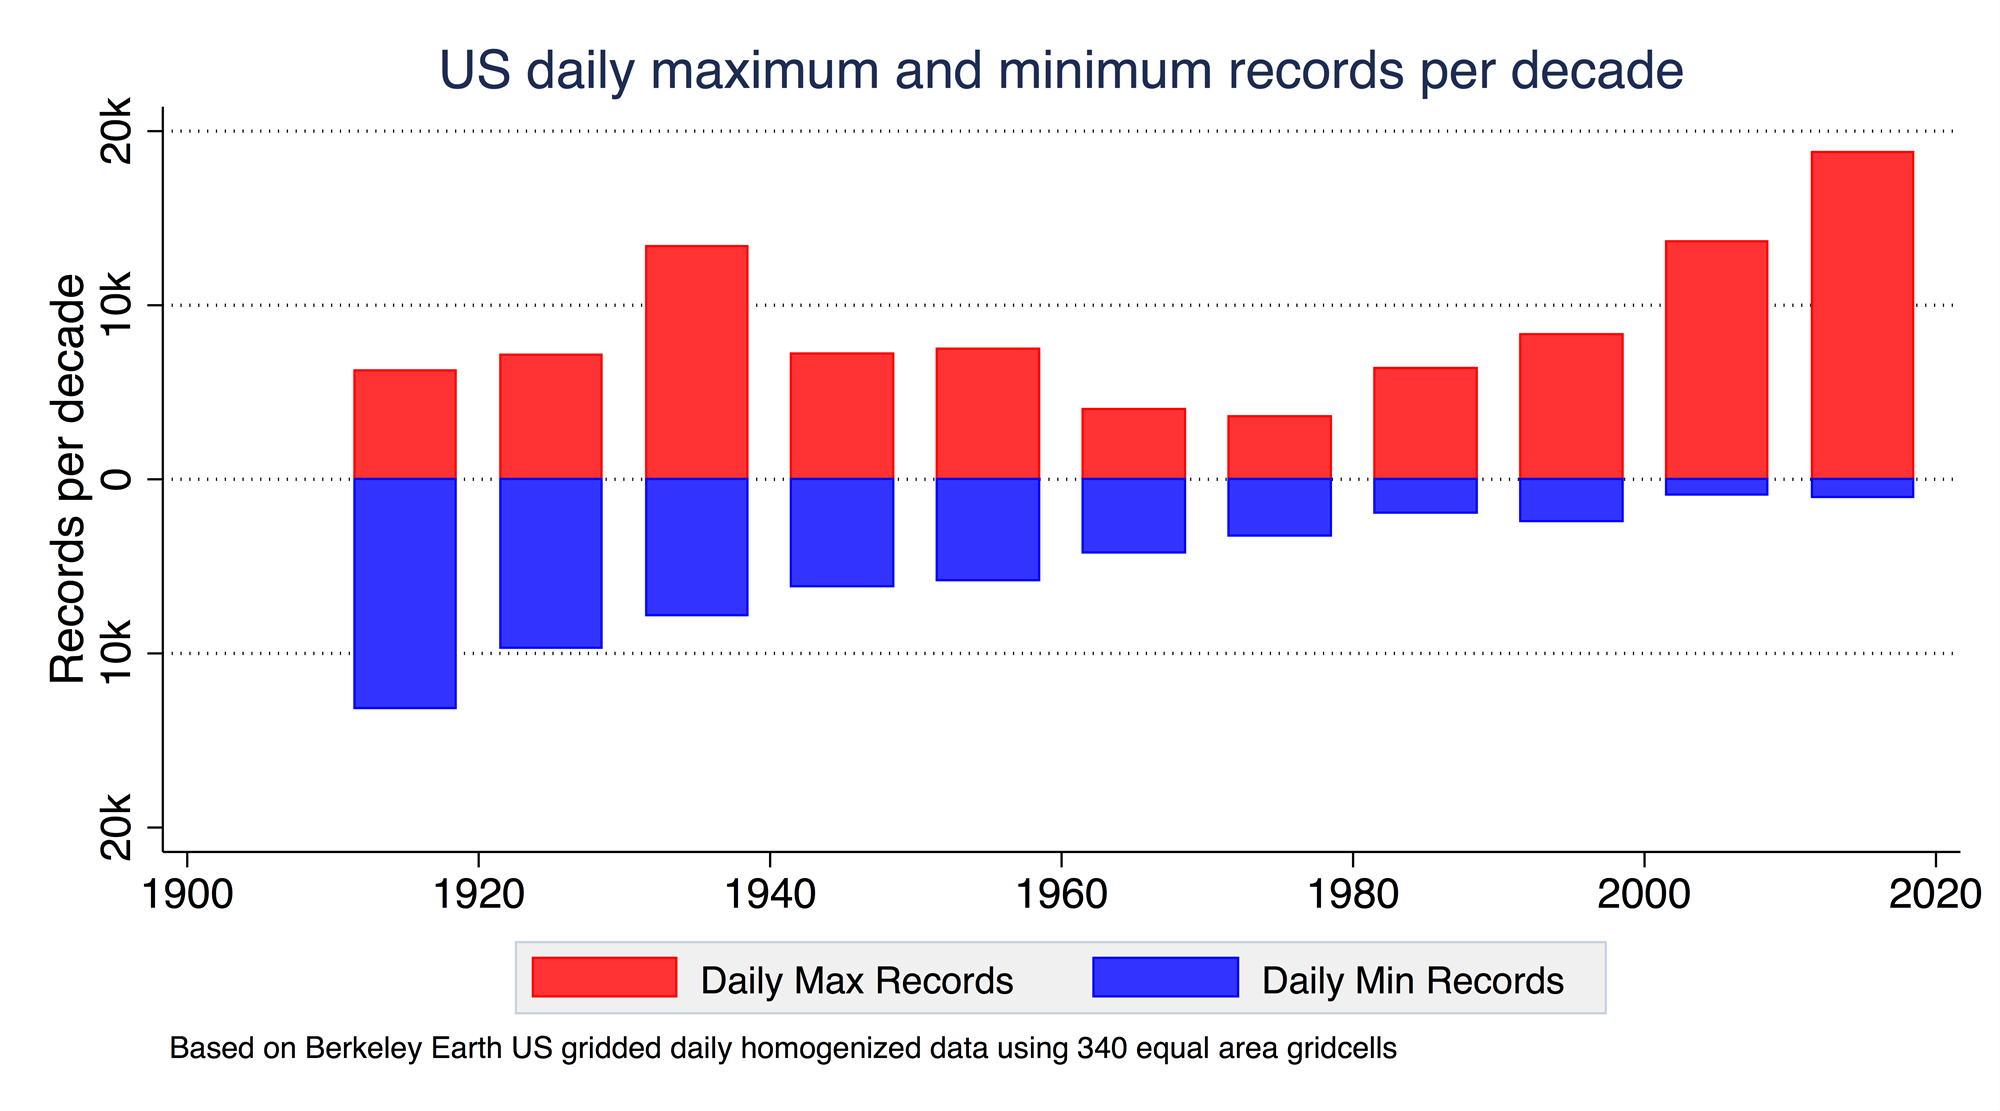
Figure 1: Changes in the occurrence of record-setting daily maximum (TMax) and minimum (TMin) temperatures per decade in the US based on Berkeley Earth US gridded daily homogenized data using 340 equal area gridcells. (Hausfather et al. 2021, AGU Fall meeting)

To examine this further, the ratios of record highs versus record lows were calculated for each year. During the 1960s, there were more record lows than highs. However, when the global warming period began in the 1970s, the ratio of highs to lows began to increase. Over the last decade in their dataset, daily record high temperatures occurred many times more often than record lows.

Looking ahead, Fischer et al. (2021) found that record-shattering extreme heat events were likely to be encountered more often in the coming decades. They note, however, that such drastic record-breakers would be “nearly impossible” in the absence of global warming. In an interview with Carbon Brief, the lead author stated that extremes in a changing climate are like an athlete on steroids – who suddenly breaks previous records in a step-change manner. The following year saw a UK heatwave that did precisely that, with temperature records going down like ninepins and the first 40C daytime maximum recorded from there.

So, while we can still expect cold days and even record cold days, in a warming world there's a much greater chance of daily record highs instead of lows. This tendency towards hotter days is expected to increase as global warming continues through the 21st Century.

Cartoon summary

Cranky Uncle cold weather cartoon

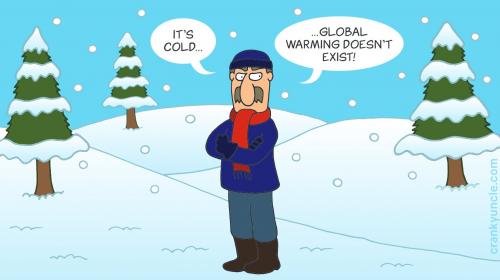
This Cranky Uncle cartoon depicts the "Anecdote" fallacy for which the climate myth "It’s cold!" is a prime example. It uses personal experience or isolated examples instead of sound arguments or compelling evidence. It pairs up nicely with the "It's dark ... the sun doesn't exist" cartoon using the same fallacious reasoning. Please see the accompanying blog post for more information about the cartoon collection.

Last updated on 3 September 2023 by John Mason. View Archives

Printable Version  |  Offline PDF Version  |  Link to this page

Argument Feedback

Please use this form to let us know about suggested updates to this rebuttal.

Further viewing

Climate Denial Crock of the Week - "It's cold. So there's no Climate Change" (January 2009)

ClimateAdam (aka Dr. Adam Levy) has his own way to explaine why this claim is nonsensical:

Further reading

NASA explore this subject in more depth in What's the Difference Between Weather and Climate?

Myth Deconstruction

Related resource: Myth Deconstruction as animated GIF

MD Cold

Please check the related blog post for background information about this graphics resource.

Denial101x videos

Here are related lecture-videos from Denial101x - Making Sense of Climate Science Denial

Comments

Prev  1  2  3  4  5  Next

Comments 51 to 75 out of 110:

  1. @Tom: "I think your interpretation of spam is extreme" No, it's not. You just posted a bunch of links with no arugment at all. That's a pretty good definition of spamming. Please continue complaining about moderation, I'm sure it'll get you somewhere. "have fun with YOUR tunnel vision" You're the one wearing blinders here, friend.
  2. "Whether or not thinking life embraces free exchange of information..." There's nothing wrong with the free exchange of ideas, but that doesn't mean every idea is equally worthwhile. In this case, the fact that it's cold somewhere does not disprove AGW. What matters are global averages, and these aren't going down - they're going up.
  3. @ Tom Löber #33 Cherry wholesaler, perhaps? You are misinforming about the supposed cold snaps and cold records in South America. That is old twisted news. I make some of my students in High School to take posts like yours and all the links they offered and dig the truth about the cold developments in 'exotic' South American territories, what was easy because we are Argentine. Suffice to say that it was a cold Winter here and there, nothing "special". State of emergency? Yes, massive anti flu vaccination (remember H1N1?). People with pneumonia -almost an average year- yes. Dead fish, yes. Other animals too. Most of them from species that moved to newly warmed territories and couldn't stand temperatures normal in 1975 or 1960. Let South America alone when in a cherry picking spree. @42 What calendar did they use in England that this is the coldest December in record? From here, it looks like 40% of December is yet to come. Maybe it's the exotic Gregorian calendar we use in South America, the continent of the cold snaps on demand.
  4. Tom, there was a time when the mainstream, status quo view was that climate change was not occurring. That view has been successfully challenged. I should say "is being," since there is still a large number of people who fail to understand the current state. You have done a pretty poor job of bringing the evidence to back up your claims. Try presenting a comprehensive counter-theory that takes into account the bulk of the instrumental data we have on atmospheric temperature (surface, TS, SS, incoming, and outgoing -- global). People might respond differently to you. You must have such a counter-theory, or you wouldn't pour so much confidence and passion into the tone of your posts.
  5. Tom, well average for the whole winter and it was short, mild. There was a late spring snowfall in southern parts - unfortunate timing but a 30-40 year event. To my mind, a warmer world is one with more energy in the system and overall wetter. How that plays out regionally is tough call. I still dont see why the flood of cold weather reporting. Did you report the hot weather events too in summer? You say that think world is warming so what is your point in posting these. Do they challenge the consensus view? No, so why?...
  6. It seems to me that we need to differentiate between climate change and anthropogenic global warming.The temperature trends appear to indicate a warming, but that alone does nothing to identify the cause. I would argue that if we observe record low temperatures with CO2 at a supposedly 'all-time' high this tends to indicate that CO2 is by no means the major contributor to warming.
    Response: See the posts "CO2 is not the only driver of climate" and then "It’s not us."
  7. Mike H - if AGW theory predicted that there would be no more record lows, then you would have a point, but it does not. For a discussion on what the science does and does not expect, I suggest reading the papers discussed at Cold Winter in a world of Warming. Or look at some individual models runs.
  8. What you could also argue is that in global warming, the no. of record highs in a year should exceed the no. of record lows if "record" is calculated on same basis for same spatial distribution. See here for some data.
    Response: [Daniel Bailey] Fixed link.
  9. I would argue that if we observe record low temperatures [...] Well, we aren't observing record low temperatures, as far as the whole Earth is concerned. Maybe some individual place is ... but there's nothing especially noteworthy about that. Maximiliano Herrera has compiled data on met stations that set new high or low records every year since 2002. When I last looked at his site, earlier this fall, 2010 had set 337 warm records versus 13 cool records. In 2009, the ratio was 80 (warm) to 15 (cool). In 2008, it was 40 (warm) to 18 (cool). In 2007, it was 133 (warm) to 9 (cool). And so on...
  10. Ned, I agree that I was referring to our local (UK)situation, and I also concede that the shift in the jet stream that has led to these conditions has probably also caused higher than normal temperatures in Iceland. The difficulty I have is in attributing global warming solely to CO2 emissions, and I have now read the posts referred in the response to my original post, which seem to support the view that other factors have a much stronger influence - but governments (apparently guided by climate scientists)seem to focus only on rising CO2 levels. The other area of difficulty lies in the reliance upon satellite data where the measurement uncertainties are of a similar magnitude to the reported temperature rise / decade, and all this in an extremely complex environment with multiple independent variables.
    Response: The role of CO2 relative to other factors is discussed here.
    The reliability of temperature records is discussed here.
    Finally, the ability to make predictions given the complexity of climate is discussed here.

    Per this site's comment policy, please post your specific questions or comments in the appropriate thread. This ensures that your posts are viewable by anyone researching a particular question, rather than being randomly strewn about the site. In the future, please consult the List of Skeptic Arguments prior to posting and ensure your comments are made in the appropriate thread.
  11. #60: "attributing global warming solely to CO2" Guess you missed this page. Be sure to look for the key distinction between 'forcing' and 'feedback'. For example, many people seem to think its warming because of water vapor; something has to start the warming before an excess of water can evaporate. So water vapor is a feedback, where CO2 is a forcing. Your second point about temperature measurement uncertainty is also moot; satellite temps and ground temp records are resolved in a number of SkS articles (some by Ned). Keep digging, you'll find nuggets of gold buried around here.
  12. Mike H writes: and all this in an extremely complex environment with multiple independent variables. Well, in terms of the big picture: (1) Fairly simple physics suggests that adding CO2 to the atmosphere should cause the Earth to warm. (2) The only thing that could prevent this would be strong negative feedbacks in the climate system. (3) Past climate change (glacial-interglacial cycles, the "Medieval Warm Period" and the "Little Ice Age", etc.) suggests that there isn't a strong negative feedback in the climate system. So we would expect fossil fuel combustion to lead to climate change. Our observational systems (weather stations, satellites) are imperfect, but over the past three to four decades they show a very definite warming trend. Occam's Razor says that at this point the ball ought to be in the skeptics' court. It's not sufficient to say "well, the climate is complicated and our observations are kind of noisy". That's not an argument against the existing body of evidence ... and if it were a valid argument, it could be used both ways: your reasoning could just as easily be used to claim that maybe climate sensitivity is being underestimated. So ... individual cold-weather episodes at this or that place aren't evidence against global warming. "Uncertainty" in and of itself also isn't evidence against global warming.
  13. An interesting take on the extreme winter by a weather guy in 26 Dec NY Times: As global temperatures have warmed and as Arctic sea ice has melted over the past two and a half decades, more moisture has become available to fall as snow over the continents. So the snow cover across Siberia in the fall has steadily increased. The sun’s energy reflects off the bright white snow and escapes back out to space. As a result, the temperature cools. When snow cover is more abundant in Siberia, it creates an unusually large dome of cold air next to the mountains, and this amplifies the standing waves in the atmosphere ... He goes on to explain how this forces the jet stream into a more N/S configuration, resulting in deeper, wetter cold fronts. Which is as reported here and here and shown below. Similar results published in JGR: This causes a continental-scale winter cooling reaching −1.5°C, with more than 3 times increased probability of cold winter extremes over large areas including Europe. Our results imply that several recent severe winters do not conflict the global warming picture but rather supplement it, being in qualitative agreement with the simulated large-scale atmospheric circulation realignment.
    Response: [muoncounter] Note: original image was from intellicast and updated daily. Conditions referred to here occurred in late Dec 2010; jet stream map now shown for 12/26/10 from archive at http://squall.sfsu.edu/crws/archive/jetsat_arch.html
  14. #64 muoncounter at 03:57 AM on 27 December, 2010 An interesting take on the extreme winter... “As global temperatures have warmed and as Arctic sea ice has melted over the past two and a half decades, more moisture has become available to fall as snow over the continents. So the snow cover across Siberia in the fall has steadily increased. The sun’s energy reflects off the bright white snow and escapes back out to space. As a result, the temperature cools.” Mr. Judah Cohen, Ph.D. of AER (Atmospheric and Environmental Research, Inc.) must be a hard core climate denier in disguise. The mechanism he is describing, to get extreme chill via warming, is a strong negative feedback loop of the finest kind. Anyway, I told you it was soot. "If cooling is hampered (e.g. by carbon dioxide), one would expect snow trend to lag insolation. But it's just the opposite." (Summer solstice is on week 25, winter solstice is week 51)
  15. #64: "... a hard core climate denier in disguise." Yes. That would explain why his name is lighting up the denier blogs with references to his 'climate astrology'. Wait a day or two, there will be an entire denial smear machine dedicated just for him. And I believe the correct form of address is Dr. __ , not Mr. ___, PhD. However, he does seem to have published papers on the relevance of early Siberian snowfall to winter forecasting, a model that has already shown a favorable track record. But then, even astrologers get one right every once in awhile? I'm not at all sure of the point of your latest graph; however, I do recognize that NH snowfall occurs primarily in the winter. As far as this being a negative feedback, it must be a very fast feedback. Surely the model is that increased evaporation from warm bodies of water leads to a wetter winter. Once that water vapor falls out (in this case, as snow), what's left to provide feedback? "it was soot." Yes, I thanked you for the soot reference, as it provided hard evidence that anthropogenic CO2 moves from source to the Arctic.
  16. I have just been looking at the NCDC US climate at a glance for November 2010 depature from normal http://www.ncdc.noaa.gov/oa/climate/research/cag3/cag3.html It shows the temperatures generally around 4 to 6 degrees above normal. Yet when I view the US temperature map for the same month accessed from the same page it just shows the majority of states at or below normal? I don't see how the two maps relate.
  17. Prediction comes true: Pielke Sr comments on Judah Cohen's forecast Aside from picking at semantics within Cohen's NYT piece, Pielke seems to be hemispherically challenged: "the statement ”other frozen areas are shrinking” is correct for Arctic sea ice, it is incorrect for Antarctic sea ice". Err, Cohen's forecast deals specifically with the northern hemisphere. And Pielke informs us: "the oceans have not been warming in recent years" 'Nuff said.
  18. kdfv, can you post the link to the second map you are referring to ?
  19. @kdfv #66 Maybe you didn't read or understand the "explanation of legend terminology" that is linked to the map, and also forgot to figure out a way to compare local departure from normal to state averages. You have to do that to say "I don't see how the two maps relate" being that they so clearly relate. You may decide to polish your abilities to simply observe a map as your assertion "it shows the temperatures generally around 4 to 6 degrees above normal" is obviously false and your assertion "it just shows the majority of states at or below normal" is permanently true no matter what you compare (but good dialectic design in your phrases, as that "or" easily makes people forget it is indeed an "and")
  20. You may want to change the Snow cover to an up/down arrow as based on the linked interview with Professor Mike Lockwood, winter extremes can go either way. Here is the link to the news org. The interview video is the last one on the page. http://www.channel4.com/news/uk-snow-strands-air-travellers Comment originally posted here http://www.skepticalscience.com/The-many-lines-of-evidence-for-global-warming-in-a-single-graphic.html
  21. PaulPS: It would be incorrect to change the snow cover arrow to up/down in the illustration. I made a brief perusal of the data at the Rutgers Global snow lab The last three years had the lowest snow cover of all the recorded years in the months of June, July and August (the record is only for the northern hemisphere, snow cover change in the southern hemisphere is small). That is a clear decrease in the snow cover. The maximum snow extent varies somewhat (so far). This is similar to the Arctic Sea ice extent which has responded more in the summer minimum than the winter maximum.
  22. PaulPs @70, I just posted this on another thread and it is relevant to the discussion of reduced N. Hemi. snow cover. Lockwood's hypothesis/conceptual model seems to apply to only Europe, not Eurasia or N. America. And remember the fuss last winter (2009-2010) when all that snow fell over the USA and parts of Europe....well, Michael pointed out what happened in the spring and summer of 2010.
  23. Article from JGR that people might find interesting JGR article I think the reduction of Arctic sea ice may be having an impact on atmospheric circulation.
  24. #73: See earlier comments. Interesting how the deniers use the jetstream to 'explain away' summer heat waves, but in the winter, they call it 'climate astrology'. How do you spell 'double standard'?
  25. #68 jmurphy the second map is http://climvis.ncdc.noaa.gov/cgi-bin/cag3/state-map-display.pl
    Response: [Daniel Bailey] Your URL link is broken.

Prev  1  2  3  4  5  Next

Post a Comment

Political, off-topic or ad hominem comments will be deleted. Comments Policy...

You need to be logged in to post a comment. Login via the left margin or if you're new, register here.

Link to this page


The Consensus Project Website

THE ESCALATOR

(free to republish)


© Copyright 2024 John Cook
Home | Translations | About Us | Privacy | Contact Us