


 Arguments


Recent Comments
Prev 1275 1276 1277 1278 1279 1280 1281 1282 1283 1284 1285 1286 1287 1288 1289 1290 Next
Comments 64101 to 64150:
-
David Lewis at 13:52 PM on 12 February 2012Global Sea Level Rise: Pothole To Speed Bump?
Hansen, in a 2005 editorial essay cited Kienast et.al.2003 and said "In melt-water pulse 1A... sea level rose about 20m in approximately 400 years" which "is an average of 1m of sea level rise every 20 years". Which is about 0.14 mm per day. This would be a catastrophic rate for people living near the sea. He noted that the ice sheets disintegrating at the time "were at lower latitudes than the ice that remains today and the period of rapid ice sheet disintegration was undoubtedly preceded by a period in which the ice was preconditioned for collapse". But, he points out climate forcing today far exceeds the forcing that drove melt-water pulse 1A. And, he said, sea level rise doesn't have to add up to 20 m to obligate scientists who expect it to happen to warn that an event anything like it would "wreak havoc" on civilization. Hansen has said in the past that if the planetary energy imbalance is about 1 W/m2 and all that energy was going into melting ice it would raise sea level by about 1 m per decade. Obviously, an armada of icebergs shooting off Antarctica wouldn't have to melt to raise sea level. Pfeffer told a story at the AGU this year about how the sea level rise threat isn't being fully grasped even by those he would have thought must be exposed enough to the data to get it. He said MOMA in NYC exhibited a model showing a New York that by 2100 had protected itself from 2m of sea level rise. He asked the designers, what was the plan for the ongoing steady or possibly accelerating rise after that - how was their design going to cope with another meter and another one after that? Blank stare. -
layzej at 13:47 PM on 12 February 2012CO2 is plant food? If only it were so simple
muoncounter @77, Fact 1 and 2 are off topic on this thread and moreover not areas where JNG has suggested that SkS has fallen down. Michael sweet @78, I'm not sure what you are getting at. The JNG post was written after considering this very SkS post and finding it wanting. Rob @79, No doubt there are many reasons to reduce CO2, however JNG has suggested that this particular item is a litmus test to determine whether the person you are listening to is honest and knowledgeable. A bold statement and one that I am grateful to see addressed by you and the S(k!)S team. Tom Curtis @80, thanks for the thoughtful and thorough response! Your points are all well taken, although I'm not sure it's a good idea to consider policy turn around time when writing a post. I would like to think of SkS as a place that cuts through all the BS and provides the facts - warts and all.Moderator Response: [JH] The auditions for SkS Moderator candidates were held last week. -
Norman at 13:45 PM on 12 February 2012NASA Mission Takes Stock of Earth's Melting Land Ice
-
Norman at 13:44 PM on 12 February 2012NASA Mission Takes Stock of Earth's Melting Land Ice
Tom @34 You provide a good challenge "Note that I do not know the recharge rates. Globally they may also be trivial. But you need to either cite them to establish that, or to cite a peer reviewed source to that effect." I did some research into this and found this Nonsustainable grounwater sustaining irrigation: a global assessment. I did sight the 545 km^3 from deep water mining from the other link. I have not found a correct current amount of nonsustainable water mining (fossil aquifiers) so I am not sure what it is in 2012. In 2000 it was found to be 234 km^3 (from the link above). From the abstract: "Results also show that globally, this contribution more than tripled from 75 to 234 km3 yr−1 over the period 1960–2000." Nonsustainable water mining tripled from 1960 to 2000. In 2000 it was estimated to be 234 km^3/year. In 2012 if may be higher than 2000 but probably not as high as the 545 km^3 given in the other article. Nonsustainable means the this water is being removed and not replenished. Here is the general description of aquifier types: "There are two types of aquifers: replenishable and nonreplenishable (or fossil) aquifers. Most of the aquifers in India and the shallow aquifer under the North China Plain are replenishable. When these are depleted, the maximum rate of pumping is automatically reduced to the rate of recharge. For fossil aquifers—such as the vast U.S. Ogallala aquifer, the deep aquifer under the North China Plain, or the Saudi aquifer—depletion brings pumping to an end. Farmers who lose their irrigation water have the option of returning to lower-yield dryland farming if rainfall permits. In more arid regions, however, such as in the southwestern United States or the Middle East, the loss of irrigation water means the end of agriculture." source. Here is another describing fossil water water 75,000 years old in Libyan aquifier. -
muoncounter at 13:44 PM on 12 February 2012A prelude to the Arctic melting season
skywatch#9: Polyak 2010 was discussed here. analysis of several hundred indicators of past Arctic sea ice extent tells us that recent losses appear to have no parallel in records going back many thousands of years (Polyak et al). -
Bob Lacatena at 13:42 PM on 12 February 2012Climate change policy: Oil's tipping point has passed
60, Camburn,Note the "at present there are no economic alternatives."
Bullsh*t. There are no "economic alternatives" because we continue to invest more and more in the existing infrastructure and comparatively ignore other "uneconomical" potentialities. We keep things that way with our behaviors. Hybrid cars have been feasible and economical for a decade. Only the lack of true massive-scale production keeps their costs high. Our dependence on a rickety and failing fossil fuel infrastructure is primarily hampered by our continued investment in that same, dead-end infrastructure. The denial crowd has done a wonderful job of keeping the lack of "economic alternatives" a reality, and on our current course they will continue to do so for several decades until (as you say) the necessary transition comes with a cultural and economic shock. It stuns me that you are unable to see this or, despite your own admission of the problem, to use your foresight to move past it. -
Bob Lacatena at 13:35 PM on 12 February 2012CO2 is plant food? If only it were so simple
85, Camburn,The types of plants that feed the world have repeatedly demonstrated increased productivity from higher levels of CO2.
Do they similarly react well to increased temperatures, increased or decreased moisture, and more volatile precipitation and temperature patterns? Do they demonstrate an unending improvement for higher and higher levels of CO2, without limit or eventual negative result? Are you in a business where you can afford to simplistically look at and focus on a single variable, with complete disregard for other factors? -
Camburn at 13:32 PM on 12 February 2012CO2 is plant food? If only it were so simple
Tom@83: I am in production agriculture Tom. The "quarter" I am most interested in is feeding people. As most of the worlds food stocks are annual in nature and derived from grasses, the area of research most intersting is the responses to co2, etc. The types of plants that feed the world have repeatedly demonstrated increased productivity from higher levels of CO2. Rob@84: I will have to re-read Lobell (2011). There were problems with that study that a farm paper talked about. When I have time to read it and reference it, I will comment on said link. Thank you for the Link. -
The Year After McLean - A Review of 2011 Global Temperatures
Doug H - You might then be interested in the Separating signal and noise in climate warming thread. The answer appears to be a minimum of 17 years for any trend to be statistically identified in the presence of observed climate noise. Others (ahem) might want to read that as well. Decadal trends are just not enough to identify any trend, whether it's plus, minus, or flat. -
Tristan at 13:06 PM on 12 February 2012Climate change policy: Oil's tipping point has passed
The first major impact of a significant increase in oil price is probably famine in Africa. I'd suggest that it is non-trivial for Africa to switch from oil-dependent farming. -
Camburn at 12:55 PM on 12 February 2012Northwest passage has been navigated in the past
JMurphy: The Voyage of 1944 was not quite as difficult as you maintain. Capt Larsen was a skilled Captain. At times there was heavy ice, at times there was no ice to be seen. To have accomplished this without the benifit of satillite images is really a feat in and off itself. -
Rob Painting at 12:54 PM on 12 February 2012CO2 is plant food? If only it were so simple
Camburn - you are misinterpreting what I wrote. Young forests, which are not nutrient-limited in some other way, can indeed benefit enormously from more CO2. The FACE trials indicate that mature forests don't - there's only so big trees can grow and therefore a limited capacity to soak up CO2. Young forests on the other hand have a large capacity for growth and drawdown of CO2. It makes perfect sense. In the real world, however, many areas are nutrient-limited - phosphorus, nitrogen and especially water. That's perhaps why the CO2 fertilization effect (a global increase in plant biomass due to more CO2) has not been found. All the extra CO2 seems to be going into forest re-growth. This tallies with global estimates of growth in pastural coverage- they have plateaued in recent decades. As far as corn is concerned, that too is under threat see SkS post: Maize harvest to shrink under Global Warming - based on Lobell (2011) -
Tom Curtis at 12:48 PM on 12 February 2012CO2 is plant food? If only it were so simple
Camburn @82, I know you enjoy looking at a very carefully selected quarter of the picture. Just don't expect us to be mislead by your propensity. In other words, read the main post. If you can't rebut the points it raises, you have nothing worth saying. -
Camburn at 12:46 PM on 12 February 2012A prelude to the Arctic melting season
JMurphy: I did not suggest that the voyage was benign. I am showing what was in the log. They also encountered a lot of ice in places. The point I was trying to establish is: resolution. I will read your link forthwith. Thank you. -
Camburn at 12:43 PM on 12 February 2012CO2 is plant food? If only it were so simple
Tom@80: Elevated CO2 benifits C3 and C4 structured plants. All cereal grains are grasses, so this study has a very strong relation to wheat/corn/ etc. NASA study on C3 and C4 grasses with elevated levels of CO2 It is also well known that enhanced CO2 promotes larger "root balls". Because of this, the plant is more efficient at using the available nutrients/water in the soil. With enhanced levels of CO2 there are indications that farmers will be able to reduce the N input and achieve the same yield. This would allow 3rd world countries to increase the mass of their food production. From a plant perspective, higher CO2 is good. Most plants evolved when CO2 was higher on earth and have not seemed to have lost that desire. But, even with enhanced bio-mass, the lowered PH of the oceans is a mighty concern that MUST be taken into account in the balance. -
JMurphy at 12:39 PM on 12 February 2012A prelude to the Arctic melting season
Camburn, you will find further details about the St. Roch's Northwest Passage voyages, written by myself, on Skeptical Science here. Things were not as benign as you seem to be suggesting. -
JMykos at 12:33 PM on 12 February 2012Zero Carbon Australia: We can do it
Sapient. I wouldn't consider Cinas population small. China implemented a one child policy in the cites not rural areas. China recognized their population was going to exceed the resources of their land and did something quite controversial about it. A two child policy from the outset might have been more palatable. Quite the contrary, if china didn't have the one child policy, today under the per capita basis they would be entitled to more of the CO2 budget, they would have been rewarded for their population growth. Shouldn't all countries manage their population level to the food and water and other resources their land can provide? By the same thinking the amount of land would factor into the CO2 budget. Not merely the population number. -
Camburn at 12:32 PM on 12 February 2012CO2 is plant food? If only it were so simple
Rob: There is no question that CO2 enhances plant growth. This is documented in this Wisonsin Study. Tree growth with elevated CO2 As far as temperature, the temperature, at least in the main corn growing areas of the USA would have to elevate by over 4.0C to be a growth hinderance. This would have to occur at precise times as well, as corn is sensative to higher temperatures for approx 2 weeks time in the growing season. Outside of the pollination and early fill window, higher temperatures help with the conversion to starch in the ear and can allow greater kernal depth. This is benificial. However, the lowering of PH of the oceans as a result of higher levels of CO2 is a huge concern. The lower PH benfits some crustaceans, but in my humble opinion, the overall benifits do not outweigh the potential negatives. Woods Hole Study of PH -
Tom Curtis at 12:19 PM on 12 February 2012CO2 is plant food? If only it were so simple
Layzej @76, among the interesting things John N-G writes is:"As long as the climate effects are small, they don’t matter much, but to the extent that climate changes faster than plants can move around to keep up with it, climate change will be bad for native plants. Worse, in the tropics, the climate may change into something with no existing analogue on Earth and thus no pre-adapted species ready to move in. Computer models with an interactive biosphere generally agree that incremental increases of CO2 help plants overall, and most say that the global ecosystem will continue to gain biomass through 2100. In other words, the better growing conditions due to more CO2 outweigh adverse conditions due to the changing climate for the foreseeable future. The crossover point, where net global growth is actually inhibited by the combination of CO2 fertilization and resulting climate change, is poretty much the most poorly known number relevant to climate policy. Certainly as the climate changes there are concerns about the extinction of species and the loss of the ability to grow adequate crops in some areas. But in the meantime, as long as one is not concerned about the fate of individual vulnerable species, CO2-induced climate change is a net positive for plant growth. This is true based on the most basic numbers of the man-altered carbon budget."
By my reading, that is in complete agreement with the more detailed discussion above. His objection to this post seem to come down completely to the absence of a sentence saying that despite these grave concerns, for the future, there will be a short term (20) year benefit for plants in general, although not necessarily for crops. Given the turn around time of climate change policy, and the even longer turn around time for any action to start reducing growth in global temperatures, I do not think pointing out a possible short term benefit is either necessary or helpful. Still less so as it is not certain that that short term benefit exists. As noted by Steve Bloom in comments at John N-G's blog, his method of estimating the benefit to plants is indirect, and necessarily includes aquatic as well as land plants. More generally it potentially shows in increase in plant life, not in human agricultural productivity. It is of scant benefit to us if over the coming decades Net Primary Productivity (ie, the total global growth of plant life) increases if that increase is in the form of algal blooms and weeds. Further, I say talk of a potential increase, as even John N-G mentions a possible mechanism whereby the observations of increased carbon take up are compatible with decrease plant growth, ie, a larger decrease in plant decomposition. Although he dismisses that possibility, a recent study (whose title and authors I can't remember unfortunately) showed that production of oil and coal generating strata peak in periods of high CO2 content. Production of fossil fuels requires the burial of organic carbon without decomposition, so that study suggests that high CO2 content may indeed lead to reduced rates of decomposition, primarily by promoting anoxic conditions in warm waters. It seems to me that John N-G would have done well to read the title above. "If only it were that simple". Because of that complexity, Dawei's conclusion was, "The global increase of CO2 is thus a grand biological experiment, with countless complications that make the net effect of this increase very difficult to predict with any appreciable level of detail." That is, he has neither endorsed claims of benefit or of harm to plants from CO2, but merely drawn attention to some of the many complicating factors. In the end, difference between his and SkS's discussion of the topic is that we did not rush to a simplistic conclusion. -
Camburn at 12:16 PM on 12 February 2012A prelude to the Arctic melting season
The paper presented is worth getting a copy from the local library: Bowhead Whale Historical Range in the Canadian Archipelago What this provides is evidence of Hisotrical Arctic Ice extent. One can then look at historical climatic patterns during the times of limited ice extent to understand what may lie ahead for our planet. -
Camburn at 12:07 PM on 12 February 2012A prelude to the Arctic melting season
Tom@8: Ice loss is a regional item in the Arctic. On the whole, there has been ice loss on an annual basis. I am not confident that there are aduequate records of ice extent prior to satillites with enough resolution to provide the degree of certainty that is currently exibited. I have to logs of the St. Roch voyage in 1944. There were times when no ice was evident as far as the eye could see. This log is not in the public domain so I can't post a link to it. I can however post this: Page 92: Aug 22, noon. Barrow St. No Ice in sight. Page 93: Sep 3rd 6:pm Princess Royal Is. No ice in sight. RCMP 1945 Reports and Other Papers Realating to the Two Voyages of the R.C.M. Police Schooner "ST. Roch" This is first hand observations by the ships Master. Also, after reading the logs it is very apparant that the currents in the Arctic Sea play a huge role in ice transport etc. There is no doubt that the ice since Satillite measurements has been in decline. The reasons for said decline can be partially attributed to Global Warming, but a very significant part are the result of black carbon. Nasa Aerosols May Drive Arctic The long term picture is a complicated one that deserves much more research. -
Rob Painting at 12:01 PM on 12 February 2012CO2 is plant food? If only it were so simple
Layzej - John NG needs to bone up on the latest research. No one is suggesting that increased levels of CO2 won't benefit plant growth - all things being equal. But that's just it, they are not equal, and recent studies find little evidence for it on a global scale. We (SkS) know that the carbon cycle models used in the last IPCC (2007) report expect a CO2 fertilization effect, a huuuuge CO2 fertilization effect. But isn't it interesting that previous work on historic forest growth in North America over the last few centuries found no evidence for it? The latest global forest inventories show that the uptake of CO2 by land plants is occurring because of forest re-growth, (forests chopped down and allowed to grow back) not because plants are lapping up the extra CO2. The prime areas of reforestation are in the former Soviet Union, China and in the tropics. On a global level there seems to be little evidence of the CO2 fertilization effect. This makes perfect sense, re-growth areas can chew through a fair amount of CO2 as they grow into mature forests and incorporate the extra CO2 into plant mass, but mature forests have a limited capacity for further growth. " I had looked at the site...unfortunately they can't bring themselves to admit that the evidence, while complex, does point to a net overall benefit to plant growth for the next few decades." Or perhaps the correct answer is that John Nielsen-Gammon is conflating forest re-growth (areas where forest has been allowed to re-establish) with the CO2 fertilization effect. I get the impression he can't be bothered accurately researching this topic. Maybe he needs to consult Stephen Pacala? As far as the consequences for human agriculture - which is the subject of Dawei's post, that doesn't look too flash either. Many human crop foods will be negatively impacted by rising temperatures and drought over the next few decades, including main staples such as corn and rice. And what about ocean acidification? Global warming's evil twin? Dude, there are many reasons to limit CO2 emissions, focusing on one tiny detail blinds one to the 'big picture.' -
skywatcher at 11:40 AM on 12 February 2012A prelude to the Arctic melting season
#4, and yet when the full context of the whole Arctic ocean is considered with a broad range of historical and proxy evidence (and not just the seas marginal to Russia), in this thorough review by Polyak et al 2010, they find:The current reduction in Arctic ice cover started in the late 19th century, consistent with the rapidly warming climate, and became very pronounced over the last three decades. This ice loss appears to be unmatched over at least the last few thousand years and unexplainable by any of the known natural variabilities.
-
Doug Hutcheson at 11:40 AM on 12 February 2012The Year After McLean - A Review of 2011 Global Temperatures
Bernard J @ 12 I am frustrated by my lack of the maths knowledge to answer your questions, but they seem to me to be interesting.can you tell us what period of time is required to discern from the short-term noise in the global surface temperature record, a warming signal of, say, 1.0 C/century? What period of time would be required to discern a signal of 0.75 C/century, and what period of time would be required to discern a signal of, say, 1.25 C/century? Conversly, and importantly in the context of your fixation with periods of approximately a decade, what rate of temperature change would be required to discern a signal from noise over a period of ten years? What rate of temperature change would be required to discern a signal from noise over a period of five years, and what rate of temperature change would be required to discern a signal from noise over a period of fifteen years?
I imagine the answers would involve quantifying the average magnitude of the observed noise over the periods in question and then establishing the magnitude of signal required to skew the slope of the total data (noise + signal) by a statistically significant amount. It is so frustrating to be able to frame such problems, but not have the education to address them. If only I could go back to about year 10 at school and have teachers who could inspire me with the enthusiasm for math and physics that I have now, in later life. As it is, I have to rely on other minds to spoon feed me. So much to learn, so little time. To put me out of my misery, are those questions valid and are there answers to them? (And where can I go on the web to study high-school math and physics at my own pace ... I wish.) -
Tom Curtis at 11:40 AM on 12 February 2012A prelude to the Arctic melting season
Camburn @4, the abstract of your cited paper reads:"Examination of records of fast ice thickness (1936–2000) and ice extent (1900–2000) in the Kara, Laptev, East Siberian, and Chukchi Seas provide evidence that long-term ice thickness and extent trends are small and generally not statistically significant, while trends for shorter records are not indicative of the long-term tendencies due to large-amplitude low-frequency variability. The ice variability in these seas is dominated by a multidecadal, low-frequency oscillation (LFO) and (to a lesser degree) by higher-frequency decadal fluctuations. The LFO signal decays eastward from the Kara Sea where it is strongest. In the Chukchi Sea ice variability is dominated by decadal fluctuations, and there is no evidence of the LFO. This spatial pattern is consistent with the air temperature–North Atlantic Oscillation (NAO) index correlation pattern, with maximum correlation in the nearAtlantic region, which decays toward the North Pacific. Sensitivity analysis shows that dynamical forcing (wind or surface currents) dominates ice-extent variations in the Laptev, East Siberian, and Chukchi Seas. Variability of Kara Sea ice extent is governed primarily by thermodynamic factors."
(My emphasis) How small are the long term trends, to 2000, can be seen by noting the ice extent trends across all all four Russian Arctic seas of -0.5 thousand km^2 per decade. That means, averaged across all four seas Arctic sea ice extent fell by about 5 thousand km^2 over the twentieth century. In stark contrast, August Arctic sea ice extent has fallen by approximately 2.3 million km^2 over the last three decades:That is not an apples and oranges comparison in that it compares the entire Arctic to just the four Russian Arctic seas. Comparing summer Arctic extents over the 20th centuries show those seas to have been unusual in their limited reduction in August sea ice. That calls into question your extrapolation from a regional study to the full Arctic.
 Never-the-less the full comparison still shows Arctic summer sea Ice Extent to have fallen almost as much in the 21st century as it did throughout the twentieth. It is interesting to note that all of the fall in the twentieth century is post 1950. In other words, the clear pattern is that while NAO may influence Arctic sea ice extent, that influence is now imposed on an unprecedented (in modern times) long term decline in sea ice extent which is a consequence of global warming.
Put differently, the difference between the 2011 and 2012 sea ice extent near Novaya Zemlya may be due to the NAO, but the difference between 2012 and the 1976-2006 mean is due to global warming:
Never-the-less the full comparison still shows Arctic summer sea Ice Extent to have fallen almost as much in the 21st century as it did throughout the twentieth. It is interesting to note that all of the fall in the twentieth century is post 1950. In other words, the clear pattern is that while NAO may influence Arctic sea ice extent, that influence is now imposed on an unprecedented (in modern times) long term decline in sea ice extent which is a consequence of global warming.
Put differently, the difference between the 2011 and 2012 sea ice extent near Novaya Zemlya may be due to the NAO, but the difference between 2012 and the 1976-2006 mean is due to global warming:
-
michael sweet at 11:28 AM on 12 February 2012CO2 is plant food? If only it were so simple
Layzej: You have come to the right place for answers. All you need to do is read the opening post for the thread you have posted on and you will find Skeptical Sciences response to your question. If you have any more questions after you have read the opening post feel free to post them. -
muoncounter at 11:25 AM on 12 February 2012CO2 is plant food? If only it were so simple
lazej#76: Curious that you omit Fact #1: A small concentration of CO2 is a big deal. and Fact #2: The fraction of CO2 molecules in the atmosphere that were produced by man is different from the fraction of CO2 molecules in the atmosphere that are there because of man. He goes on to say that man-made CO2 is indeed causing warming. Both of these are part of the same litmus test. If you hear or read somewhere that the amount of carbon dioxide in the atmosphere is so small that it must be unimportant, your source is either too naive to know better or trying to deceive you. ... If you hear or read somewhere that the amount of man-produced CO2 in the atmosphere is only a small fraction of the total CO2 in the atmosphere and that therefore man is having a small effect, your source is either too naive to know better or trying to deceive you. Further comments on JNG's post take issue with his dismissal of SkS' argument. -
muoncounter at 11:10 AM on 12 February 2012A prelude to the Arctic melting season
I'm curious to know what the pro ice-watchers think of this: NASA Finds Russian Runoff Freshening Canadian Arctic Increasing freshwater on the U.S. and Canadian side of the Arctic from 2005 to 2008 is balanced by decreasing freshwater on the Russian side, so that on average the Arctic did not have more freshwater. Here blue represents maximum freshwater increases and the yellows and oranges represent maximum freshwater decreases.
-
EliRabett at 10:50 AM on 12 February 2012The Year After McLean - A Review of 2011 Global Temperatures
"Well of course it should be. When you are on a plateau, the height sort of 'plateaus'." There is, of course, another way of looking at this, in a situation with a trend and variation, the most likely place to have a new high, is following a new high. Random means up and up is as likely as up and down. -
R. Gates at 10:47 AM on 12 February 2012A prelude to the Arctic melting season
Philippe, I was thinking in terms of total global sea ice area. But you are of course correct, even with low ice in the Kara and Barents, there isn't much in the way of solar insolation hitting those areas right now. That open water is probably losing more heat than gaining I would guess (neglecting inflows of warm water through currents). Still, if the Kara and Barents remain ice-free until the traditional melt season really kicks in, it could portend 2012's summer sea ice minimum really smashing 2007's mark. -
layzej at 10:46 AM on 12 February 2012CO2 is plant food? If only it were so simple
John Nielsen-Gammon has thrown down the gauntlet! (http://blog.chron.com/climateabyss/2012/02/three-simple-facts-about-carbon-dioxide/) He says that "Some things about carbon dioxide in the climate system are so firmly established and fundamentally important, you can use them as litmus tests to determine whether the person you are listening to is honest and knowledgeable." Fact #3 in his list is "Carbon dioxide is good for plants, in the sense that it makes them grow more rapidly. If you hear or read somewhere that man’s addition of CO2 to the atmosphere has been generally harmful to plant productivity, your source is either too naive to know better or trying to deceive you. He says of this site: "Unfortunately they can't bring themselves to admit that the evidence, while complex, does point to a net overall benefit to plant growth for the next few decades" Is Skeptical Science ignorant, [-snip-] or has JNG overstated his case? I very much respect both the Skeptical Science team and JNG. I look forward to seeing this apparent disagreement reconciled. P.S. possibility #4 is that it is me who is overstating his case, however he says that he "had looked at the (skeptical science) site" - presumably before writing the piece. So while the statements aren't targeting SS directly, SS had at least been considered. P.P.S. Interestingly JNG is typically very conservative with statements regarding what the science can tell us. Skeptical Science on the other hand is often addressing the "We don't know everything therefor we know nothing" crowd. In this case the roles appear reversed.Moderator Response: [JH] The correct acronym for Skeptical Science is "SkS". -
EliRabett at 10:40 AM on 12 February 2012A prelude to the Arctic melting season
At this point there is probably no chance to build up anything but ephemeral ice thickness. -
Sapient Fridge at 10:39 AM on 12 February 2012Zero Carbon Australia: We can do it
JMykos that's an interesting point you make. My understanding is that while China implemented an official one child policy, western cultures such as Australia haven't ever attempted an official birth control policy of any kind. Are you suggesting that China should be rewarded with more of the carbon pie than Australia, as a reward for their population control policy? -
David Lewis at 10:22 AM on 12 February 2012NASA Mission Takes Stock of Earth's Melting Land Ice
Hansen's Figure 14 "Current Contributions to Sea Level Change" in Earth's Energy Imbalance and Implcations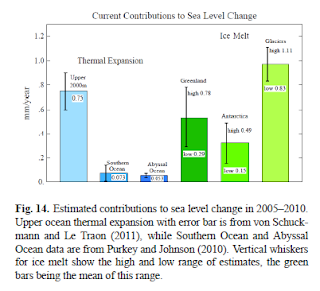 shows his latest assessment of the literature which is just prior to the publication of the Jacob, Wahr, Pfeffer and Swenson Nature paper under discussion.
If you add the Hansen Greenland and Antarctica middle of the error bar values (0.85 mm/yr) and compare to Jacob et.al. data (1.06 mm/yr) for those areas you see that one thing Jacob et.al. discovered is that more ice may be melting in the places where most of the ice on land on the planet is than a type like Hansen thought.
Hansen commented on the error bars in his Figure 14 by referring to sea level data, i.e. his Figure 12
shows his latest assessment of the literature which is just prior to the publication of the Jacob, Wahr, Pfeffer and Swenson Nature paper under discussion.
If you add the Hansen Greenland and Antarctica middle of the error bar values (0.85 mm/yr) and compare to Jacob et.al. data (1.06 mm/yr) for those areas you see that one thing Jacob et.al. discovered is that more ice may be melting in the places where most of the ice on land on the planet is than a type like Hansen thought.
Hansen commented on the error bars in his Figure 14 by referring to sea level data, i.e. his Figure 12
 saying "the recent measured sea level rise favors the lower estimates of ice sheet melt".
So if you add up his "lower estimates" for Greenland and Antarctica from Figure 14 you get an even lower total, 0.44 mm/yr in comparison to Jacob et.al.'s 1.06 mm/yr. A wild headline could have read "Ice sheet disintegration doubles at poles - scientists stunned!" which might have as much basis in reality as some of the headlines on articles about the Jacob et.al. paper.
All of Hansen's low estimates add up to a low estimate for total global ice on land melt contribution to sea level which equals 1.27 mm/yr. The Jacob et.al paper finds the total to be 1.48 mm/yr.
Pfeffer, in his Nye Lecture presentation to this years AGU commented that observation of glaciers has tended to be in areas that are easy to get to, as opposed to a representative or comprehensive set of glaciers someone knowledgeable might choose for a dataset.
saying "the recent measured sea level rise favors the lower estimates of ice sheet melt".
So if you add up his "lower estimates" for Greenland and Antarctica from Figure 14 you get an even lower total, 0.44 mm/yr in comparison to Jacob et.al.'s 1.06 mm/yr. A wild headline could have read "Ice sheet disintegration doubles at poles - scientists stunned!" which might have as much basis in reality as some of the headlines on articles about the Jacob et.al. paper.
All of Hansen's low estimates add up to a low estimate for total global ice on land melt contribution to sea level which equals 1.27 mm/yr. The Jacob et.al paper finds the total to be 1.48 mm/yr.
Pfeffer, in his Nye Lecture presentation to this years AGU commented that observation of glaciers has tended to be in areas that are easy to get to, as opposed to a representative or comprehensive set of glaciers someone knowledgeable might choose for a dataset.
-
2010 - 2011: Earth's most extreme weather since 1816?
Camburn - Truly a fascinating link there. I particularly appreciate the authors statements that the ice ages are caused by nearby supernova, rather than the Milankovitch cycle of insolation changes. Perhaps next time you could try actual science, rather than, well, tin-hattery? -
Camburn at 10:13 AM on 12 February 2012A prelude to the Arctic melting season
It has been documented for quite some time that the NAO and the AO play a role in the level of ice in the Arctic Sea. Long Term Arctic -
JMykos at 09:49 AM on 12 February 2012Zero Carbon Australia: We can do it
I understand the requirement of reducing CO2 emissions globally. But why is the CO2 quota budget "per capita"? Why should a country be rewarded with a higher CO2 budget because they allowed and continue to allow their population to grow uncontrollably? -
Bernard J. at 09:43 AM on 12 February 2012The Year After McLean - A Review of 2011 Global Temperatures
Further to Robert Murphy's response at #16 (and on topic this time) the ENSO acts to relocate heat around the planet; it does not generate net heat. As Robert notes, removing the confounding influence of this oscillating phenomenon does not affect detection ofunderlying warming trends. -
Philippe Chantreau at 09:30 AM on 12 February 2012Climate change policy: Oil's tipping point has passed
Do your own homework -
Jose_X at 09:19 AM on 12 February 2012Monckton Myth #17: Debate vs. Denniss, Part 1
Monckton spend the first part of the speech (which is all I saw) speaking as if virtually every single accepted theory is to be doubted. This is a reasonable approach to take initially as an honest skeptic or if you are in a debate and really are skeptical about every such point, but then he treated as a matter of fact virtually every point he put forward. This is an approach taken in debates not in science. If he treats the majority of research as doubtful, it does not follow an honest skeptic would then treat as a matter of fact a bunch of side research, for, if the research paper itself is good enough to allow one to take it on faith as he did, then he should have accepted everything. To me this looks like dishonest scientific skepticism. It looks like professional debate.. like what you might see in US trial courts by opposing trial lawyers (whose goal isn't usually to get to the truth but to convince a jury to side with their client). -
Camburn at 09:12 AM on 12 February 20122010 - 2011: Earth's most extreme weather since 1816?
Normal@418: I didn't see any mention of the storm in 1944, or 1970 at Tuktoyaktuk. Flood Hazard Delineation at Tuktoyaktuk -
Camburn at 09:04 AM on 12 February 20122010 - 2011: Earth's most extreme weather since 1816?
Here is an interesing bit of research on long time weather extremes: Weather from aprox 1AD to 1900 -
Camburn at 09:01 AM on 12 February 2012Climate change policy: Oil's tipping point has passed
Phillippe: IF you know of anything on the horizon, I am all ears to learn. -
Camburn at 09:00 AM on 12 February 2012Climate change policy: Oil's tipping point has passed
Philippe@61: The internal combustion engine was used on farms in the late 1800's. The power was there, the engineering was not but came very shortly thereafter. Right now, there is no alternative power, so the engineering can't even adapt to that. -
Jose_X at 08:58 AM on 12 February 2012Monckton Myth #17: Debate vs. Denniss, Part 1
Lord Monckton: Please, allow me to call you Chris as a way for me to more readily provide you with the human touch I like to give all my audience. I found myself agreeing with you on much, but a few things should be pointed out because I fear some audience members might be getting confused. For example, you stated the IPCC (the ih-pee-kak) obviously does not believe it can predict the future. Well, of course, they can't. Did you believe there truly were that many people in the audience who believed the IPCC or anyone can predict the future? That you decided to mention that widely understood point without a passing mention of what was really important in that section of the report, that the IPCC's job is to help manage probabilities and certainties, really confused me, and I think perhaps I wasn't the only one. So, yes, I agree with you, as does I believe almost every scientist of any variety. Scientists don't prove things. They try to discover the most likely options and quantify their understanding so that we can remove as much subjectivity from the process as possible. Now, that you next mentioned consensus was interesting. That did give me the impression for a moment that the actual target of your prior discussion were the many non-scientists out there who might have been tempted to think that having a strong gut feeling and banding together to tell each other their beliefs, for example, that man cannot much at all affect the climate or that basic concepts like the greenhouse effect don't exist, would be a reasonable substitute to doing science. They can have as much consensus as they like, but, in full and entire agreement with what you said, achieving a consensus of beliefs is not science. It never has been and likely never will be. This brings us to the next point. I entirely agree with you, again, and with Einstein, that it just takes one paper to show a bad theory for what it is. The slow consensus that has been building in climate science over the years has paralleled the reduction in the number of plausible theories. Sometimes a scientist has a hard time accepting that his or her theory really has very little chance of being accurate, but, on the whole, what survives and is embraced by those who practice science is what is sturdiest among the candidates. Consensus, while not being a requisite or a substitute for good science, tends to be a consequence of good science. I am not sure if I understood the evidence you presented for why you believe that the Medieval Warm Period was warmer than today. I think the question of whether it absolutely is or isn't is overblown by many, but I do find it interesting how people who cannot agree on the very temperature of the planet over the past 100 years or even the past 5 years, as demonstrated as recently as the uproar that led to the BEST project (which ultimately confirmed what climate scientists on the whole already accepted) could somehow believe they really can accurately know how warm or cold the planet was in Medieval times. At the risk of appearing to disagree with you, I'll say that I have seen no convincing evidence that the Medieval times were warmer than today. You stated some individuals were under investigation by legal authorities. Can you give us an update on how that turned out or is turning out? Chris, in the next part, you accused a single person of rewriting an important IPCC chapter in the 1995 report. Let me ask you, Chris, if you were present at the debates that ensued at the time, as they tried to build consensus and come to agreement on the wording of that study? I was not there. If you were there yourself or have video you can show us, would you please help me understand why the speaker in the first few minutes of this video http://www.youtube.com/watch?v=OTsc3jV1Otw , provided courtesy of Standford University, is suggesting that the scientists who allegedly wrote the initial draft either agreed with the changes that were adopted by the IPCC or simply did not care about them? [In a world where politics sometimes trumps good science, I should point out that those initially objecting to the changes were all from a small group of major oil exporting countries.] Could you be more clear about the statistical fraud you had in mind. I would presume you meant McIntyre's criticism of Mann's statistics, but I don't think that counts as fraud. Of course, feel free to argue how fraud was proven. You go on to state that 1 degree Celsius is what is suggested by "all the science done by measurement and observation rather than by models." Allow me to be confused for a second. OK. I don't believe I have ever heard of real science ever done in any significant form that did not use models, that is, that did not use a physical or mathematical representation of objects and our world. Clever you are Chris. Surely, if science is always done using models to various degrees, then you were just stating, for our amusement no doubt, that while the majority of practicing climate scientists around the world (via the IPCC) agreed that 3 degrees Celsius is the mean value of warming expected from a doubling of carbon dioxide, that an alternative value of 1 degree Celsius is the conclusion arrived at by No One because no one performs science that does not use models. You clever logician. You almost had me thinking we would disagree. But to be serious, you were probably trying to make a distinction between theoreticians, such as Einstein, for example, on the one hand and those who work the laboratories but don't much manipulate the math and other elements of the models created by the theoreticians on the other. If this was your intention, would you please direct me to this long list of documents where I may witness how observation and measurement avoiding the use of physical and mathematical models suggest quality science and suggest 1 degree C. I want to research if perhaps a single paper for each such theory hasn't already been written up to put the theory to rest. Of course, I am sure I was not the only one confused. To many you probably appeared to suggest by your choice of words that scientists all pick either (a) to take the path of modeling with no observation or measurement or else (b) to take the path of observation and measurement without modeling. In reality, Chris, there really is a diverse middle ground where most scientists participate by making measurements and observations as they interact with the relevant models. At this point, I will take a rest, as I feel this reply has already become very long and the next section of the debate simply got me all twisted up out of the blue in a naught naught naught naught. -
Philippe Chantreau at 08:40 AM on 12 February 2012Climate change policy: Oil's tipping point has passed
Cambrn: "The cost of FF on a farm, transportation business ec is a huge component. It would be great to see an alternative, but as of right now, there just isn't. So, there is nothing to invest in." Transpose that about a hundred years ago or so: "The cost of horses on a farm, transportation business, etc, is a huge component. It would be great to se an alternative, but as of right now, there just isn't. So there is nothing to invest in." Meanwhile Mr Benz and Mr Ford were hard at work. I'm sure there were people to say that they did not have economically viable alternatives either... -
Philippe Chantreau at 08:26 AM on 12 February 2012A prelude to the Arctic melting season
Winter albedo in the Arctic is not that much of a factor R.Gates, don't you think? -
Camburn at 08:21 AM on 12 February 2012Climate change policy: Oil's tipping point has passed
Sphaerica@59: Note the "at present there are no economic alternatives." The economics of the current rise in price of oil has slowed economic growth worldwide. To invest in an alternative tech, you have to have the potential profits to do so. When I look at a tractor, I see no medium with current, and even projected battery tech, that will do the work of FF. The cost of FF on a farm, transportation business ec is a huge component. It would be great to see an alternative, but as of right now, there just isn't. So, there is nothing to invest in. -
muoncounter at 07:54 AM on 12 February 2012Volcanic Influence on the Little Ice Age
Large eruption database shows the 1600 Peru eruption at 3.0 x 10¹⁰ m3 of tephra, or 3x Pinatubo; this is 1.5x the 13th century eruption at Quilotoa. Buntgen et al 2006 show a glacial advance following the 1600 eruption. The upper curve is summer temperature from tree rings; the bottom curve is advance/retreat of the Great Aletsch glacier. At this level of resolution, the LIA splits into three mini-LIAs, making the 'recovering from LIA' meme even more of a stretch.
-
R. Gates at 07:22 AM on 12 February 2012A prelude to the Arctic melting season
Indeed interesting times in the Arctic. Without a late season freeze up in the Barents or Kara, if these stay open, we are going to see some very low summer sea ice extent Arctic wide as the conditions in the early melt season in both these regions have a high degree of success in indicating how low the summer sea ice extent will be. Globally, even though the Antarctic is slightly above average, the large negative anomaly in the Arctic still makes the global sea ice extent very low. It is in fact, quite possible that we'll see the lowest global sea ice area and extent in the modern satellite era in the next few weeks. Though most won't think of this way, but that would possibly mean that we'll be seeing the lowest planetary albedo during this era as well, meaning of course more solar radiation staying in the Earth's climate system.
Prev 1275 1276 1277 1278 1279 1280 1281 1282 1283 1284 1285 1286 1287 1288 1289 1290 Next


