Climate Science Glossary

Term Lookup

Enter a term in the search box to find its definition.

Settings

Use the controls in the far right panel to increase or decrease the number of terms automatically displayed (or to completely turn that feature off).

Term Lookup

Settings


All IPCC definitions taken from Climate Change 2007: The Physical Science Basis. Working Group I Contribution to the Fourth Assessment Report of the Intergovernmental Panel on Climate Change, Annex I, Glossary, pp. 941-954. Cambridge University Press.

Home Arguments Software Resources Comments The Consensus Project Translations About Support

Bluesky Facebook LinkedIn Mastodon MeWe

Twitter YouTube RSS Posts RSS Comments Email Subscribe


Climate's changed before
It's the sun
It's not bad
There is no consensus
It's cooling
Models are unreliable
Temp record is unreliable
Animals and plants can adapt
It hasn't warmed since 1998
Antarctica is gaining ice
View All Arguments...


Username
Password
New? Register here
Forgot your password?

Latest Posts

Archives

OA not OK part 5: Reservoir dogs

Posted on 13 July 2011 by Doug Mackie

This post is number 5 in a series about ocean acidification. Other posts: Introduction , 1, 2, 3, 4, 5, 6, 7, 8, 9, 10, 11, 12, 13, 14, 15, 16, 17, 18, Summary 1 of 2, Summary 2 of 2.

Welcome to the 5th post in our series about Ocean Acidification. In the last posts, we introduced solubility (post 3) and pH (post 4). We noted that the pH of the surface seawater has dropped from about 8.25 to 8.14 since the pre-industrial revolution, leading to a 29% increase in H3O+. If CO2 emissions continue, a 150% increase in H3O+ is predicted by 2100. Concerns about this increase in acidity are not limited to the decrease in pH (or increase in H3O+), but include the resulting changes to carbon species in seawater.

Just as it is in biology, a species in chemistry is a classification. A chemical species describes different forms a substance can be found in. For example, the species of nitrogen in your garden soil and in stream water may be ammonium (NH4+), ammonia (NH3), and nitrate (NO3-). In the context of ocean acidification we refer to the different species of inorganic carbon – carbon dioxide (CO2), carbonic acid (H2CO3), bicarbonate (HCO3), and carbonate (CO32–) – and how it is possible to interconvert between them.

The equations below describe overall reactions (some are actually made up of several steps) of the inorganic carbon species in seawater. In equation 7, CO2 reacts with water to form carbonic acid (H2CO3). In equation 8, carbonic acid dissociates in water to give bicarbonate (HCO3) and H3O+. In equation 9, bicarbonate dissociates to give carbonate (CO32–) and H3O+.

Equations 7-9

BUT, as we saw in post 1, each equation is in equilibrium and can occur in the left-to-right direction (as written) or the right-to-left direction. That is, the equations do not tell us if a reaction is thermodynamically spontaneous (i.e. which direction is favoured) or about the rate of reaction. These things need to be determined experimentally.

The experiments have, of course, been done. For now we will just note that at typical seawater pH values the reactions in Eq. 7-9. are spontaneous as written from left to right.

Overall equations 7-9 mean that in the oceans 91% of 'carbonate' is in the form of bicarbonate (HCO3), 8% is in the form of carbonate (CO32–), and less than 1% is found as CO2 and H2CO3 (the way we calculate this distribution, the way these reactions have a feedback on each other, and the effect of pH on this balance is discussed in several later posts).

There is a large amount of these inorganic carbon species being held in the ocean. Figure 2 is modified from the IPCC 4th Assessment Report (2007) Figure 7.3 and shows the size of each carbon reservoir on Earth. (In the next series of posts we will discuss the movement of carbon between each reservoir (fluxes) that are in the original figure).
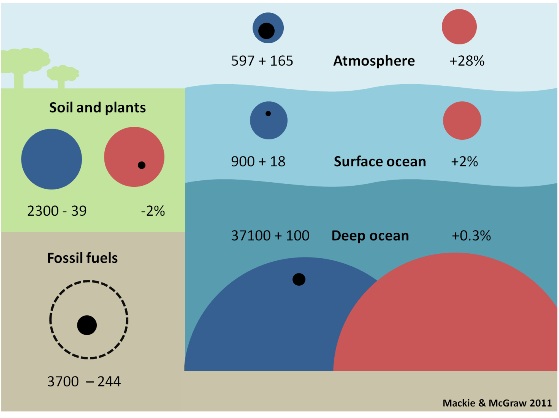
fig 2

Figure 2. Carbon reservoirs as preindustrial size (blue circles) and modern size (red circles) and change, positive or negative (black circles) since the industrial revolution with the change expressed as a % change. Size is measured in gigatons of carbon = Gt C. (1 Gt = 1,000 million tons, i.e. billion tons). Numbers are expressed here as gigatons of carbon (Gt C) because this is the unit used by the IPCC. Other publications may use giga tons of CO2 (Gt CO2); multiply Gt C by 3.67 to convert to Gt CO2 and divide Gt CO2 by 3.67 to get Gt C. Another unit sometimes used is petagrams. 1 Pg = 1 Gt so 1 Pg C = 1 Gt C and 1 Pg CO2 = 1 Gt CO2.

The first number in each box gives the size of the preindustrial reservoir in billions of tons (gigatons, Gt) of carbon (thus, the preindustrial surface ocean contained 900 billion tons of carbon). The second number is the change in the size of the reservoir from preindustrial to modern times in billions of tons of carbon.  NOTE that here 'modern times' means the mid 1990's – the IPCC is very conservative – and the fossil fuel reservoir is an estimate for 'recoverable' fossil fuels.

Thus, the modern surface ocean contains an extra 18 billion tons of carbon, which represents a +2% increase. In contrast, sea life and the surface sediment reservoirs have not changed appreciably in size.

text box 3

Where has so much inorganic carbon in the oceans come from? It has come from the weathering of rocks – the subject of our next post.

Written by Doug Mackie, Christina McGraw , and Keith Hunter . This post is number 5 in a series about ocean acidification. Other posts: Introduction , 1, 2, 3, 4, 5, 6, 7, 8, 9, 10, 11, 12, 13, 14, 15, 16, 17, 18, Summary 1 of 2, Summary 2 of 2.


posts

booklet

0 0

Printable Version  |  Link to this page

Comments

Comments 1 to 29:

  1. pedantic but "carbonate (CO3–)" in secon para shd be 2-
    0 0
  2. OK, another question. What are the blue and red circles meant to represent in the diagram? And the black dot?
    0 0
  3. You say since the beginning of the industrial revolution, H3O+ has increased by 29% in sea water. Has this been measured by some sort of proxy, or is it based on calculations from atmosphere to ocean?
    0 0
  4. I'm really looking forward to a substantive comment about the science.
    0 0
  5. @DLB Do you mean "how do we know what pre-industrial ocean pH was?" or do you mean "how is ocean pH measured?"
    0 0
  6. Well, I was going to say something about the equations implying more carbonates from ocean acidification, rather than less, but you mention this is covered in later posts.
    0 0
  7. Thanks Rob. Yes, at first glance it does look that way. But just because an equation can be written does not mean that all reactions are equal. There is a hierarchy and we discuss it in post 7.
    0 0
  8. I'm not trying to be funny - the diagram just makes no sense to me - sorry for not being substantive enough for you.
    0 0
  9. ianash - Hope I'm not explaining things that are bleedingly obvious to you here. The diagram (Figure 2) does take a little effort to understand. It is divided schematically into five fields, representing the five main reservoirs of carbon in the global carbon cycle. As stated in the caption, the size of the blue circle represents the mass of carbon in each reservoir in pre-industrial times, while the red circle shows the mass of carbon in the mid-1990s (as noted in the post, things have changed quite a bit since then. Could someone put up some updated numbers? Even an approximation would help.) For some reason, unexploited fossil fuels are shown in a single black dotted circle rather than red and blue ones. In each field, the black circle indicates the scale of change from pre-industrial to mid-1990s. If the black circle appears in a blue circle (as it does for atmosphere and both surface and deep oceans), that reservoir has gained carbon. Soils and plants has a black circle in the red sphere, indicating a loss of carbon (think deforestation, though also other processes). The fossil fuel circle indicates the relative scale of estimated recoverable reserves vs total amount of fossil fuels extracted and exploited (i.e. less than 7%), making the point that there is still plenty of carbon we could potentially dig up and stick in places where its going to mess things around (i.e. the atmosphere and oceans). Numbers give the Gt of carbon represented by each circle and then the % change. (Some have criticised the IPCC's figures for being considerably too rosy about the total reservoir of recoverable carbon from fossil fuels, but even less optimistic figures still give us plenty of scope to keep making more mess.) So the quick take-away message from the figure is that between the industrial revolution and the mid-1990s, we took 283 Gt of carbon from places where it wasn't doing anything particularly bad for us and put it into places where it is.
    0 0
    Moderator Response: I should have said: Previous unclear caption was edited. Doug
  10. Correct me if I am wrong; but it appears to me that the caption underneath the diagram showing carbon reservoirs explains the blue and red circles.
    0 0
  11. "In the next series of posts we will discuss the movement of carbon between each reservoir (fluxes) that are in the original figure" Here's where the meat is :)
    0 0
  12. Meat - eating meat - a movement of carbon between reservoirs that are in an original figure (an animal that has organically grown (originated) the meat?) - resulting in fluxes - bloody flux? - uncooked meat? The Vegan in me is weeping quietly in a dark corner, Riccardo.
    0 0
  13. DSL I apologise if it hurts your feelings. As a non-english speaking I may be wrong but the use of the word meat to indicate the essential part of something looks quite common to me. The Merriam-Webster Dictionary (entry #4) seems to confirm. In any case, I hope the sense of my comment is clear.
    0 0
  14. So, adding CO2 to the atmosphere causes CO2 to get into ocean water (via a partial pressure mechanism, or something else?). This CO2 mostly doesn't remain as CO2 but becomes ions of mostly bicarbonate (aka hydrogen carbonate) and some carbonate, all by chemical reactions with water at near-surface ocean depths (e.g., low pressure) and typical near-surface temperatures (does temperature matter much?). We know this experimentally and by measuring sea water concentrations. Do we have chemical analyses of sea water from 300 years ago or do we have vials of old water or is it determined by proxies? Are deep ocean carbon increases due mostly to ocean currents or to something else? How does this affect the Carbonate Concentration Depth? Does the carbonic acid species last long and is it what disolves sea shells? (I'm not doubting that there is some basic chemistry that I'm missing. Please correct any misunderstandings I demonstrate.) (And forgive me, please, for not knowing what you think I know.)
    0 0
  15. Riccardo, it's clear -- I was trying to be funny (but clearly was not).
    0 0
  16. @Doug Mackie When the oceans warm up, the uptake of CO2 will be reduced: http://thinkprogress.org/romm/2011/07/12/267277/climate-change-reducing-oceans-carbon-dioxide-uptake/. Is this reduced uptake already taken into account when an extrapolation of pH and the total dissolved carbonate species are calculated for a future date? PS, for those interested, on http://www.eoearth.org/article/Ocean_acidification estimates are given for several parameters at different dates regarding the ocean acidification.
    0 0
  17. @Tor B
    "So, adding CO2 to the atmosphere causes CO2 to get into ocean water (via a partial pressure mechanism, or something else?)".
    Henry's law. Post 8.
    "This CO2 mostly doesn't remain as CO2 but becomes ions of mostly bicarbonate (aka hydrogen carbonate) and some carbonate, all by chemical reactions with water at near-surface ocean depths (e.g., low pressure) and typical near-surface temperatures (does temperature matter much?)".
    Yes, the CO2 mostly doesn't remain as CO2. Not aka hydrogen carbonate by chemical oceanographers - we already said this. Temperature is important.
    "We know this experimentally and by measuring sea water concentrations. Do we have chemical analyses of sea water from 300 years ago or do we have vials of old water or is it determined by proxies?"
    No we do not have 300 year old water. If you put a pH electrode in a solution today you are measuring pH by proxy. Different proxies are used to determine past ocean conditions. Posts 11 &12.
    "Are deep ocean carbon increases due mostly to ocean currents or to something else?"
    Something else. Post 16.
    "How does this affect the Carbonate Concentration Depth?"
    post 13
    "Does the carbonic acid species last long and is it what disolves sea shells?"
    No. Post 14.
    0 0
  18. @JosHag Too early to say with confidence. McKinley et al. divided the North Atlantic into 3 zones and split the ocean pCO2 system into 2 parts. One part is temperature related and one part is chemical related. The temperature part is about a quarter the size of chemical part. The chemical part is further subdivided into 3 sub-components. In one subdivision of one of the ocean zones the trend for part of the study period of one of the chemical sub-components increases with time while the trend for the other two chemical subcomponents decrease. From the conclusions:
    At the 1 sigma confidence level, we are able to detect short-term shifts in oceanic pCO2, reasonably explained by climate variability (9-11), and north of 30_ N, long-term oceanic pCO2 trends that track the rate of atmospheric pCO2 increase. A significant role for the seasonally stratified biomes of the North Atlantic in the proposed multi-decadal increase in the atmospheric fraction of anthropogenic CO2 (refs 8,26,27) is not distinguishable. However, in the North Atlantic permanently stratified subtropical gyre we do find an increasing influence on oceanic pCO2 by a warming trend that is partially due to anthropogenic forcing (12). This is evidence of a climate_carbon feedback that is beginning to limit the strength of the ocean carbon sink.
    From the press release:
    [McKinley] stresses the need to improve available datasets and expand this type of analysis to other oceans, which are relatively less-studied than the North Atlantic, to continue to refine carbon uptake trends in different ocean regions. This information will be critical for decision-making, since any decrease in ocean uptake may require greater human efforts to control carbon dioxide levels in the atmosphere.
    0 0
  19. Doug Mackie @5, Yes, how was oceanic pH determined before the industrial revolution? I know we can now dip a pH meter into a beaker of sea water.
    0 0
  20. @DLB, Forgive me but my time is valuable to me. Are you the DLB who is so prolific at the Huffington post about climate change matters?
    0 0
  21. Thank you for clarifying it for me!
    0 0
  22. I might have been there once so it is not me, I'm not into politics anyway. However I have a very inquiring, sceptical mind. I have an open mind about OA at this stage. I was hoping this was the website where one could ask difficult questions with respect. I get rather tired of the "cheer squad" websites on both sides of the climate debate.
    0 0
  23. Thinking some more about how they might have measured pH of the ocean say 150 years ago. Were alkalinity titrations with a strong acid involved? I'm certainly no chemist, but I have a feeling this may be part of the answer?
    0 0
  24. You have an open mind? What doubts remain (one way or the other)? Your question is not in any way difficult. I asked because that other DLB that is, as you say, not you, has a rather closed mind and I would not have wished to spend time answering questions for one who would not listen. As I wrote above for TorB: "If you put a pH electrode in a solution today you are measuring pH by proxy. Different proxies are used to determine past ocean conditions. Posts 11 &12."
    0 0
  25. @Doug Mackie 18 Thanks for your answer. One would also expect that a lower uptake of CO2 (very) slowly would get visible in the atmospheric CO2 concentration, at least when the emission rates don't change. The oceans contain a lot of water so I probably will be old when these effects will be better quantifiable.
    0 0
  26. @JosHag
    "One would also expect that a lower uptake of CO2 (very) slowly would get visible in the atmospheric CO2 concentration, at least when the emission rates don't change".
    Perhaps. The short answer is that temperature is just one of several variables that control the transfer of CO2 between the atmosphere and ocean. While general trends can be predicted, it is not at all clear how the fine detail of other variables such as ocean circulation and biological activity will or will not change.
    0 0
  27. What doubts do I have, plenty, nature often confounds theory. I look forward to learning more about OA with a critical mind of course.
    0 0
  28. It boots nothing for you to play word games like this. Come, give us some specific examples of your doubts.
    0 0
  29. second summary post

    0 0

You need to be logged in to post a comment. Login via the left margin or if you're new, register here.


The Consensus Project Website

THE ESCALATOR

(free to republish)


© Copyright 2024 John Cook
Home | Translations | About Us | Privacy | Contact Us