Climate Science Glossary

Term Lookup

Enter a term in the search box to find its definition.

Settings

Use the controls in the far right panel to increase or decrease the number of terms automatically displayed (or to completely turn that feature off).

Term Lookup

Settings


All IPCC definitions taken from Climate Change 2007: The Physical Science Basis. Working Group I Contribution to the Fourth Assessment Report of the Intergovernmental Panel on Climate Change, Annex I, Glossary, pp. 941-954. Cambridge University Press.

Home Arguments Software Resources Comments The Consensus Project Translations About Support

Bluesky Facebook LinkedIn Mastodon MeWe

Twitter YouTube RSS Posts RSS Comments Email Subscribe


Climate's changed before
It's the sun
It's not bad
There is no consensus
It's cooling
Models are unreliable
Temp record is unreliable
Animals and plants can adapt
It hasn't warmed since 1998
Antarctica is gaining ice
View All Arguments...


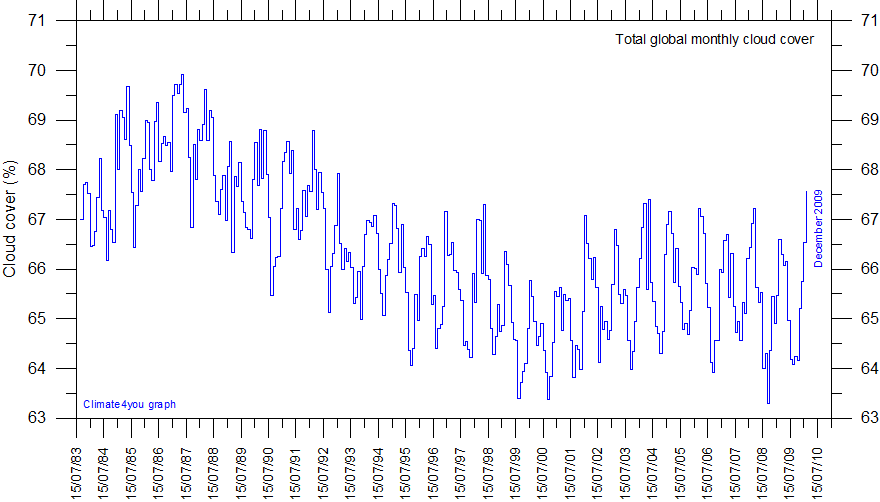
Username
Password
New? Register here
Forgot your password?

Latest Posts

Archives

What caused early 20th Century warming?

Posted on 21 August 2010 by Anne-Marie Blackburn

This post is the Basic version (written by Anne-Marie Blackburn) of the skeptic argument "It warmed before 1940".

The climate at any one time is affected by several factors which can act independently or together. The main factors include solar variability, volcanic activity, atmospheric composition, the amount of sunlight reflected back into space, ocean currents and changes in the Earth's orbit.

Before 1940, the increase in temperature is believed to have been caused mainly by two factors:

  1. Increasing solar activity; and
  2. Low volcanic activity (as eruptions can have a cooling effect by blocking out the sun).

Other factors, including greenhouse gases, also contributed to the warming and regional factors played a significant role in increasing temperatures in some regions, most notably changes in ocean currents which led to warmer-than-average sea temperatures in the North Atlantic. Does this mean that solar activity is also primarily responsible for late 20th century warming? In short, no. Solar activity since the 1950s has been relatively stable and therefore cannot explain recent trends. Similarly, increased volcanic activity may actually have had a cooling effect in recent decades. On the other hand, greenhouse gas concentrations, which were relatively low pre-1940, have increased considerably and are now dominating the climate system. This highlights the need to look at all factors when determining which factors are likely to be affecting climate at any one time.

In short, there's no reason to assume that because the sun was responsible for early 20th century, it is responsible for all warming. The evidence strongly suggests that current warming is mainly the result of increasing greenhouse gas levels.

Note: we're currently going through the process of writing plain English versions of all the rebuttals to skeptic arguments. It's a big task but many hands make light work. If you're interested in helping with this effort, please contact me

0 0

Printable Version  |  Link to this page

Comments

Comments 1 to 39:

  1. Nice, brief post. You might want to reword "greenhouse gas concentrations. . . are now dominating the climate system." Maybe it's better to say they are perturbing the climate equilibrium?
    0 0
  2. cbrock: Maybe it's better to say they are perturbing the climate equilibrium? How many people know what perturb means? They might just understand equilibrium.
    0 0
  3. The sun is responsible for all warming. The atmosphere, oceans, land and vegetation are responsible for controlling the balance of UV and visible in vs IR out. Those items form a system that somehow keeps a balance in place. For thousands of years that system has been able to maintain a balance within some tolerance that allows life on the planet to flourish, albeit, with some setbacks. The climate is always changing. At one time the climate allowed humans to cross the Bering straits on dry land or pretty close to it. I agree with The Ville, the word perturb might be better.
    0 0
  4. cbrock, thanks for the input. The point of these plain English posts is to keep things as simple as possible. More information is available in the intermediate blogs for those who want to take it further. If I think about who the target audience is, I have to agree with The Ville in that I don't think that 'perturbing the climate equilibrium' would automatically be clear to them. TOP, this is not strictly correct. The sun is ultimately where the energy comes from and can indeed affect the climate. However, other factors also have an impact on climate and global temperatures and there is strong evidence that the sun is unlikely to be driving recent changes.
    0 0
  5. Anne-Marie, I too think the wording that cbrock highlights is open to mis-interpretation. How about "and are now dominating climatic changes" ? I have to say that the following sentence is somewhat awkward, with the word "factors" appearing too many times. My (slightly longer) wording would be "This is why climate scientists have spent so much effort in discovering all the factors that affect our climate as well as evaluating which of these are dominant at any given time."
    0 0
  6. TOP at 02:02 AM on 21 August, 2010 I agree with every word you write in your first para. If at the end you added the line, "And now humans are upsetting the balance by increasing the concentration of CO2 in the atmosphere", it would be perfect!
    0 0
  7. "The evidence strongly suggests that current warming is mainly the result of increasing greenhouse gas levels." So its not a proven fact?
    0 0
  8. "The climate at any one time is affected by several factors..." When I was a kid, I learned that the Earth was just the right distance from the Sun to make it habitable. This was not true. It should have been a little further away to accomodate global warming.
    0 0
  9. miekol @7 It is not a proven fact that nothing can go faster than the speed of light, or that E = mc**2. But the evidence strongly suggests that these statements are correct.
    0 0
  10. Miekol - you do proofs in mathematics, not science. Scientific "proof" is a much weaker thing. Maybe tomorrow some new hypothesis will be able to explain all our observations in a completely different way. But thats not the way to bet - at moment I'd say evidence that current model for climate is basically correct is overwhelming.
    0 0
  11. Thanks Phil - I will think about rephrasing those sentences, especially the first one. miekol, to add to Phil and scaddenp's points, you might be interested in reading this article which tackles the human fingerprint on climate change. It shows quite clearly why scientists have concluded that greenhouse gases are most likely to blame for the warming observed since the 1970s.
    0 0
  12. During the first half of the 20th century, 10 years were declared as La-Nina years and 13 as El-Nino years. In the second half 12 years were declared La-Nina and 15 as El-Nino. The first half of the century had the longer term IPO predominately in the positive phase which reflects El-Nino conditions whilst during the second half it was predominately in the negative phase which reflects La-Nina conditions. During the first half, on 3 occasions succeeding years were declared El-Nino years whilst La-Nina was declared once for 3 years in succession and once for 2 years also. During the second half, only on one occasion was there succeeding El-Nino years which remained in place for 4 years. On 2 occasions succeeding years were declared La-Nina years, and on one occasion 3 successive years. Interestingly the much discussed 1998 El-Nino event was immediately preceded and immediately succeeded by La-Nina years. Looking at the IOD, during the first half, 8 years were in the negative (wetter) phase and 9 years were in the positive (drier) phase. During the second half there were 8 years each of the IOD being in each phase. All those longer term indications are reflected in the rainfall over all of Australia being generally greater in the second half of the 1900's, with the earlier mentioned 3 successive La-Nina years in the mid 1970's being considered as the wettest period ever since settlement began in the 1700's. Irrespective of what may be considered to being the greater driving influence, it is whether or not the longer term patterns are changing, and if so in which direction that is relevant to what is really the single most important factor, that being mans ability to feed themselves.
    0 0
  13. #9 Phil, #10 scaddenp, #11 Anne-Marie Blackburn. Phil......Sorry I'm just an average guy. I'm pretty sure that it has been shown empirically that the speed of light is 299,792,458 metres per second and that the mass–energy equivalence formulae is a fact. I agree its not been proven that there's not something that moves faster than light. But I'm pretty sure that E=MC squared is a correct formulae for mass–energy equivalence. Perhaps someone can give me a link if I'm wrong. scaddenp...........Show me a few experiments whereby adding one CO2 molecule to 850,000 molecules of air increases the greenhouse effect. (don't ridicule my clumsy wording. You know what I mean. I'm willing to be corrected on the proportions.I'm not a scientist.) Anne-Marie I've no arguement with the idea that as you say, "The evidence strongly suggests that current warming is mainly the result of increasing greenhouse gas levels." What frustrates me is that GWers assumed that the one extra molecule of CO2 produced by man in 850,000 is responsible for increasing temperatures. As a lay person, I just cannot accept this. You show me a few emperical experiments that demonstrates it, then I'll support human carbon reduction.
    0 0
  14. Miekol, time for you to keep your word, some empirical evidence
    0 0
  15. Miekol, see Spencer Weart. And remember, simple doubt is not an argument. You're obviously familiar with how to obtain information, you're here after all. Educate yourself, don't ask other people to stuff facts into your head, against your resistance.
    0 0
  16. Miekol, as has been asked before, this belongs in "CO2 is an insignificant gas". Please read and ask questions there. A truly excellent resource for all the gory detail is at science of doom. To help concentrate your thinking, consider the following. 1/ How long would you survive if you replaced each CO2 molecule with one of HCN (cyanide). 2/ Each CO2 molecule absorbs a photon, gains kinetic energy and usually loses that energy by collision with other molecules and then ready to absorb another molecule. How quickly does this happen on average? 3/ What would the temperature of the earth be if you removed all the CO2? And yes, the experiment to measure the greenhouse effect of tiny concentrations was done long ago and repeated many times. Look up Arrhenius ( or Spenser Wearts excellent history of the experimental work.)
    0 0
  17. :-) many thanks Dappledwater, doug_bostrom and scaddenp. You've provided me with heaps of stuff to ponder on. Thank you. I admit I resist the idea that its man's production of CO2 that is causing the current increasing heat retention. My reason is because just when the the human race is on the threshold of ridding the world of finacial poverty, we are going to condemn the world to greater and even more widespead poverty if we 'outlaw' coal and oil as an energy source. Google "Globalism world of plenty." The alternative sources simply cannot match coal and oil for availability, quantity, continuity, and cost. Thanks again guys for your help. Michael
    0 0
  18. #17. At the risk of straying off topic, not even the most ardent Green is calling for an outlawing of coal or oil as an energy source in the short term-simply that we use what we have much, much more efficiently-especially here in The West. That said, though, most alternatives for coal & oil already exceed them for quantity (the amount of energy that the Earth has in terms of Geothermal, Solar, Tides etc are many times more than what humanity currently use, & will never run out within the span of human civilization). They are also rapidly approaching the point of matching coal & oil for availability, continuity & cost (solar panels, for example, have fallen from $25 per Watt to under $4 per Watt in the space of only 25 years, whilst efficiency has improved from barely 5% to more than 20% in the same time). Some sources of energy (such as bio-gas & co-generation) are already there. Meanwhile, the cost, quantity & availability of coal & oil are actually getting worse-which makes the goal of ridding the world of poverty much less achievable if we continue to rely on them into the future. Of course, much of the world's poverty has less to do with access to resources, & more to do with the continued uneven distribution of said resources!
    0 0
  19. So John D, what do you think drives the El Ninos & La Ninas? We know that Solar Activity increased quite rapidly throughout the first half of the 20th century, yet solar activity has largely been in decline for the better part of 30 years. So if the sun was the primary driver of the events of the first half of the century, what was driving the events of the 2nd half?
    0 0
  20. Here's another thing to consider, Miekol. Play with the numbers as you please but as a benchmark thought remember, we could for instance this moment increase the incomes of the poorest 40% of the people in the world by roughly an order of magnitude simply by a contribution from the top 20% of earners essentially unnoticeable for many of us, the price of a few deluxe pizzas per year. Let's not make the mistake of believing if we ignore global warming we're going to raise the world's poor into a new level of prosperity. We choose not to do so today, why would we tomorrow? Is something about human nature going to change? How?
    0 0
  21. johnd Late 1990s rainfall might have been better than the early 90s. But where did it fall? Scroll down this page to the Murray Darling basin and you'll see that rainfall has dived from 2000 onwards. The previous variability seems to have disappeared. One variable has changed significantly. Between 1960 and 1980 only one year has had over 200mm above average, but since 1980 there are 3 years 200 below average and 2 of those are in the last 10 years. It's not a good look. http://www.abs.gov.au/AUSSTATS/abs@.nsf/Lookup/4613.0Chapter55Jan+2010
    0 0
  22. Marcus at 13:58 PM, SST is a primary influence over the El-Nino, La-Nina cycles. Apart from the heat already in circulation within the oceans, the most obvious means by which SST may vary is solar radiation. However the solar radiation that reaches the surface is dependent on cloud cover and this varies considerably, not only seasonal, but over longer cycles as this diagram indicates, as well as geographic distribution.
    0 0
  23. adelady at 14:24 PM, there is almost always a drought somewhere in Australia. With various indicators such as the IOD and IPO seemingly taking 6 or 7 decades to cycle through both phases, it is impossible to determine any trends before any cycle has completed fully. The Queensland National Resources and Mines put out a chart depicting the rainfall across all of Australia for each year beginning 1890. Such a chart makes it easy to see the "flow" as the dry and wet years are cycled through and as the distribution varies across the regions, something that is not always evident looking at graphs.
    0 0
  24. Michael, well please do work on the matter provided. Disbelieving something because it is inconvenient might be human nature but not rational, and in this case downright dangerous. Reality is not necessarily arranged for our benefit and the laws of physics do not bend to our wishes. That said, I think you are way too pessimistic and falling for disinformation spread by those who most certainly would be adversely affected. Try having a look at MacKay's Sustainable Energy without the hot air. He doesnt pull too many punches about the problems (often criticised as being pro-nuclear but MacKay counters that he is pro-arithmetic) but hardly condemns the world to energy-poverty either. Regards, Phil
    0 0
  25. Please refer to this comment as it's relevant here as well. In response to Dappledwater (Comment #14), perhaps you may like to do your own investigations, the page you linked to here is misleading at best, and just plain wrong in some cases. First, Figure 2 combined with the paragraph preceding it suggests it shows the measured change in outgoing radiation, which it doesn't, it shows the simulated change. You can see this here which quite clearly labels that same graph as simulated. It also shows that in Figure 1b) the middle graph offset -5 K (simulated) shows a reduction in the CO2 band (~540-800 cm^-1) up to ~740-750 cm^-1 while the graph above it (observed) doesn't show any change. It also refers to the Griggs 2004 paper which appears to be available here as well. Figure 2 in that paper again clearly shows little if any change measured in the CO2 band with the simulated results suggesting there should be a drop between ~700-740 cm^-1. Also, there's a measured increase in the CH4 band between 1997 and 2003, which the authors do not provide an adequate explanation for, and conclude that the simulations (which are meant to be based in physics) require more work as they were unable to predict the change. Secondly, Figure 3 has this description before it: When greenhouse gases absorb infrared radiation, the energy heats the atmosphere which in turn re-radiates infrared radiation in all directions. Some makes its way back to the earth's surface. Hence we expect to find more infrared radiation heading downwards. Surface measurements from 1973 to 2008 find an increasing trend of infrared radiation returning to earth (Wang 2009). A regional study over the central Alps found that downward infrared radiation is increasing due to the enhanced greenhouse effect (Philipona 2004). Taking this a step further, an analysis of high resolution spectral data allowed scientists to quantitatively attribute the increase in downward radiation to each of several greenhouse gases (Evans 2006). Which misleadingly suggests that Figure 3 illustrates the change in downward radiation, even though Figure 3 is correctly labelled. I would have thought it was more important to explain how the Evans paper can conclude that a measured/calculated change of 3.52 W/m^2 "compares favourably" with a simulated change of 2.55 W/m^2. On what planet (with or without a greenhouse effect) is a ~27 % error considered to compare favourably? Another important issue that description raises is a qualitative idea floating around this site about how a tropospheric hotspot is not a signature of an enhanced greenhouse effect (it would be caused by any warming at the surface), apparently it's the warming troposphere and cooling stratosphere due to more energy being "trapped" in the troposphere. Climate science says that the stratospheric cooling is due to increased greenhouse gases in the stratosphere having a net cooling effect, suggesting there would also be additional greenhouse gases in the upper troposphere. As that description suggests, greenhouse gases absorb radiation, become warmer, and then emit more radiation. If the tropospheric hotspot is not a signature of an enhanced greenhouse effect, it suggests that the additional greenhouse gases in the upper troposphere are not absorbing any significant radiation (from any direction), otherwise it would be a signature in it's own right. This leads to: 1) If this region is not absorbing any additional radiation to any degree, then no radiation can be passing through this region (from any direction) that could be absorbed by greenhouse gases, otherwise the additional greenhouse gases would absorb the radiation and become warmer than if there was some other cause of surface warming. How is it be possible for less radiation at greenhouse gas wavelengths above the tropopause that originated from below the tropopause if the upper troposphere is not absorbing any radiation to any significant degree? 2) If everything below the tropopause is getting warmer and emitting more radiation at all relevant wavelengths, and the stratosphere is cooling as it can emit more radiation at greenhouse gas wavelengths, why would there be less radiation reaching space? This leads to another explanation often given, that adding greenhouse gases increases the "optical thickness", leading to radiation being emitted from a higher altitude which is cooler. The problem here is I'm yet to find one that provides a quantitative approach and include tropospheric warming. Explaining this more completely, at pre-industrial times the radiation was emitted at a height h1 at temperature t1, and there was another height h2 at temperature t2. Between then and now greenhouse gases were added and the temperatures increased, increasing temperature t1 to t1' and increasing temperature t2 to t2', also changing the emission height from h1 to h2. The question that doesn't seem to be properly addressed is if t2' is less than t1, as opposed to the explanation given that t2' is less than t1'.
    0 0
  26. miekol at 13:27 PM on 21 August, 2010 I think I can speak for everyone who contributes to this website when I say that we share your concerns about energy availability and poverty. For me, personally, I can say that my concerns also include biodiversity loss and food availability. Please understand that we don't take any satisfaction in the fact that humans are changing the climate, complicating other issues. I really wish a magic wand could make the AGW problem disappear. I think we 'warmists' -- or whatever you want to call us -- just recognise that everything will be that much worse if the majority refuses to recognise the problem and bury their heads in the sand. To overcome the world's problems, first we must all agree what they are and how they interact. I urge you to read the links others have provided and understand the science for yourself. The facts will speak for themselves -- provided you're willing to be open and objective. From the way you end your last comment I think you are.
    0 0
  27. Unfortunately your assertion that solar activity since the 1950's has been stable is wrong according to historical records of sunspot activity. Have a look at the following Australian government link where graphs of historical solar cycles are available. More sunspots equates to more radiated heat. http://www.ips.gov.au/Educational/2/3/1 (my apologies but I use Firefox and post links as per the hints provided) From the aforementioned link, you should note that sunspot activity in the early 60's was at an all time high post 1750. Sun spot activity during the 80's and 90's were the second and third highest for that period. As for the warming in the early century, most of those years had low sunspot activity hence I can't see how you can arrive at your conclusion that the warming is attributed to increased solar activity.
    0 0
  28. #27: "in the early century, most of those years had low sunspot activity " 'Relatively' low sunspot numbers, yes; but the peaks are increasing through the first half of the 1900s. Anne-Marie's logic is sound. Long term cycles in solar output are apparent; Bonev etal 2004 reached this conclusion: "the present epoch is at the onset of an upcoming local minimum in the long-term solar variability. There are some clues that the next minimum will be less deep than the Maunder minimum" (emphasis added) That sounds like the next few cycles are predicted to continue the downward trend that began after the 1960 peak; so why are we still warming?
    0 0
  29. John D #22. Again with that cloud cover diagram. I've already pointed out how dubious that diagram is, given that its so obviously an example of CHERRY PICKING. Specifically, there is no indication if that peak on the LHS of the graph is typical or not. If its atypical, then the so-called decline in cloud cover is non-existent (if you go on cloud cover levels just a couple of years *before* the peak). When you can provide a diagram that covers a longer time-frame, then maybe I'll consider it. Fact is that, based on everything I've read, the strength & frequency of El Ninos & La Ninas is at least partly linked to the levels of atmospheric warming. Now whilst we had a warming trend of +0.06 degrees per decade from 1900-1950-driving by an upward trend in sunspot numbers, we've had a warming trend of +0.12 degrees per decade for 1950-2000 driven by....? Well, not increasing sunspot activity, that's for certain.
    0 0
  30. muoncounter #28 Tell us what TSI produced an equilibrium temperature of the Earth system in pre-industrial times with no other external forcings (eg; volcanic cooling). With a fix on that 'equilibrium TSI' you can then estimate what excess Solar forcing has occurred over the 20th century and the total energy added to the system.
    0 0
  31. Ken #30 Alternatively you can estimate the effects of different forcing components by looking at linear models of the forcing components at different points in time. (Un)surprisingly we find that CO2 has been the main forcing component for the last 40-odd years, while the solar component was dominant previously. We also know that major volcanic forcings only last very short periods of time. So all this stuff can be estimated without estimating this 'equilibrium TSI'.
    0 0
  32. #30: "what TSI produced an equilibrium temperature of the Earth system in pre-industrial times with no other external forcings" I'm not sure what you mean. Why require 'no other externals?' Although volcanic cooling, as you suggest, is short-lived (even Pinatubo was only a 2-3 year event). And I am not aware of the significance of an 'equilibrium pre-industrial temperature'. The TSI data I've looked at (for example) show a short-term oscillation, which matches sunspot numbers reasonably well, modulated by long term signals (also present in sunspot numbers). For example, there were deep sunspot lows in the early 19th and again in the early 20th centuries. To the extent that surface temps follow these long term signal, do we not say 'its the sun?' However, when surface temps diverge from the solar signal, should we not look for the cause? What cause are you proposing?
    0 0
  33. Marcus at 20:49 PM, if you are claiming that the cloud chart is dubious, please backup such opinion by providing data that invalidates that depicted in the chart. It is up to you to provide any longer term data available if you feel the period covered is cherrypicking. Lets see what you have in real data. It is well established that the variable and irregular cycle of warming and cooling of surface ocean waters determine how events such as El-Nino/La-Nina and the IOD, as well as other similar events in other oceans, are formed. There are only two sources from where variations in SST can originate, those being the circulation of heat within the oceans, or the solar energy being absorbed at the surface. Given it is accepted that the heat content of the oceans is increasing, then that obviously begins with increasing the SST. Irrespective of whether you accept the data of the cloud chart or not, what is not in dispute is that clouds provide approximately 2/3 total coverage and that coverage is irregular and follows certain patterns over both the short term and longer term as evidenced by the cycles of droughts. It has been established that the USA dust bowl era was due to a combinatiion of SST in the Atlantic and the Pacific that altered the atmospheric circulation across that portion of America. Only time will tell if that was a random event or part of a cycle that may reappear in the not too distant future.
    0 0
  34. muoncounter #32 Without an equilibrium baseline TSI for the pre-industrial earth system, the magnitude of Solar forcing and energy added/subtracted over time cannot be accurately calculated. All the IPCC anthropogenic forcings from Fig 2.4 of AR4 are those of the year 2005 referenced to 1750AD. So is the 'natural' Solar forcing of 0.12W/sq.m. from that chart. As you know from elsewhere 70% of the TSI divided by 4 enters the Earth system. This implies a TSI difference of 4 x 0.12/0.7 = +0.69W/sq.m. higher in 2005 than 1750. With no other 'anthropogenic' forcings in 1750AD - and excluding volcanic effects, was the Earth warming or cooling in 1750 - or was it in 'balance'? If it was 'in balance' the equilibrium TSI should be roughly 1366.3 (TSI in 2005) minus 0.69 = 1365.6W/sq.m (TSI in 1750). My question is therefore - what is the equilibrium TSI of the Earth system with no 'anthropogenic' forcings excluding volcanic effects?
    0 0
  35. #34: "With no other 'anthropogenic' forcings in 1750AD - and excluding volcanic effects, was the Earth warming or cooling in 1750 - or was it in 'balance'?" Based on data presented here, it appears that 1750 was slowly warming. Looking at the rising peaks on the sunspot graphs above and extrapolating TSI backwards to match (if that's a legitimate thing to do), that would suggest TSI was gradually increasing as well, albeit on a shorter period. Does the quantitative aspect of your question suggest that you feel earth temperature should match solar irradiance - volcanic effects exactly? If the 'natural climate cycle' is one that slowly oscillates on its own, what is the value of equilibrium, other than as a midpoint of the normal oscillations? Isn't it more significant to understand what causes the departure from that equilibrium condition?
    0 0
  36. muoncounter #35 In the absence of any anthropognic forcings prior to 1750AD, the only climate driver would be the various Solar cycles including the 11 year cycle, and multiple overlapping orbital cycles which have varied the Earth's exposure to the sun. Volcanic cooling is transient and significant in short bursts, but being randomly distributed in time cannot be counted as part of a natural forcing cycle. The Earth is most probably never in equilibrium, but if you are trying to separate and quantify the effects of CO2GHG forcing - you must be able to accurately tell us where we are in the cycle of 'natural' solar forcing. In 1750AD the Earth was warming out of the LIA but this says nothing about whether Solar forcing was above or below the 'midpoint' of the natural oscillation in 1750AD. If you look at the time series forcing curves for warming and cooling forcings, the positive areas under the curves indicate the total energy added to the earth system and the negative areas the energy subtracted from it. These theoretical AG forcings are baselined about a zero axis. eg. in 2005 CO2 forcing was posed at 1.66W/sq.m and total aerosol cooling at about -1.2W/sq.m (ref Fig 2.4 AR4). If you are going to add Solar forcing into this mix you also need a zero axis baseline so the forcings can be added or subtracted correctly. Is not a zero basline for Solar the 'equilibrium' TSI where in the absence of AG forcings (pre 1750AD) the Earth was 'in balance'? We had a Solar maximum up to 1960 and a slow drop off in TSI since then (ignoring the 11 year cycle which oscillates on top of the basic Solar forcing signal). The total energy above the 'zero baseline' has to be in the system somewhere to obey the first law. Land and atmosphere has tiny storage capacity compared with the oceans which has thermal lags (depending on depth) of 10's to hundreds of years. Heat stored in the oceans can be exchanged with the atmosphere and land in complex circulations and cycles (ENZO, AMO etc) Unfortunately, the measurement of OHC is unable to track this heat with current technology despite the greater coverage of Argo, and the purported forcing imbalances are not showing up in the oceans above or below 700m more than about 60% of the theoretical amount of 0.9W/sq.m and even this is in doubt. Small OHC increase means small imbalance over time, and small imbalance could mean Solar forcing only or a smaller CO2GHG effect that theoretically claimed.
    0 0
  37. muoncounter #35 I was rather looking forward to your reply to my post #36. It also is directly relevant to the latest topic concerning the surface temperature record.
    0 0
  38. #37: "I was rather looking forward to your reply" Why? It seems as if you want to create some sort of straw man in the form of a quantitative branch for me to saw off. I had no idea that form of expertise was required in order to agree with a point raised in a 'basic version'. Your comment in 36: "small imbalance could mean Solar forcing only or a smaller CO2GHG effect that theoretically claimed" suggests that you would like someone to provide a number that will allow you to claim that CO2 effects are small; I'm not qualified to do that. However, the CO2 question is addressed in detail elsewhere. My observation in #28 still stands: a paper noted the long term cycle evident in the sunspot index. And I echo what kdkd said in #31: all this stuff can be estimated without estimating this 'equilibrium TSI'.
    0 0
  39. #39 "And I echo what kdkd said in #31: all this stuff can be estimated without estimating this 'equilibrium TSI'." No it can't muoncounter. All the 'anthropogenic forcings' in Fig 2.4 IPCC AR4 and repeated by Dr Trenberth's famous paper in Figure 4, are relative to a baseline of 'zero' in AD1750. The +0.12W/sq.m for 'natural' Solar forcing is baselined to what? Was it zero in AD1750? If it was not or we don't know; then it should not be added and subtracted from the AG forcings based on 'zero' in AD 1750. Figure 1 from this thread (1713-1996) seems to suggest a baseline TSI at 1365.5W/sq.m, but who is to suggest that the solar forcing was 'zero' in AD1713 given the complex orbital cycles which vary the Earth's exposure to the sun over interglacial time scales. Is 1365.5W/sq.m the 'zero' baseline? The bit you don't seem to get is that the energy accumulation of the Earth system does not necessarily stop when the TSI is flat. This energy is the integral of the 'forcing' in W/sq.m wrt time represented by the area under the forcing curve which rises linearly with time elapsed. A constant 0.12W/sq.m forcing over one year is 20E20 Joules, which over a century is 2000E20 Joules. 5-6E20 Joules/year covers all the arctic ice melt, land ice melt and land heating (according to Dr Trenberth). So if for example the Earth was warming in AD1713 at a small Solar forcing of say 0.06W/sq.m (half the current IPCC Solar forcing number), and we assume the same shape of the TSI curve since then is offset by an extra 0.06 x 4 /0.7 = 0.34W/sq.m then that would add an extra 10E20 Joules to the Earth system for nearly 300 years which is an extra 3000E20 Joules - a big number - most of which must go into OHC.
    0 0

You need to be logged in to post a comment. Login via the left margin or if you're new, register here.


The Consensus Project Website

THE ESCALATOR

(free to republish)


© Copyright 2024 John Cook
Home | Translations | About Us | Privacy | Contact Us