Climate Science Glossary

Term Lookup

Enter a term in the search box to find its definition.

Settings

Use the controls in the far right panel to increase or decrease the number of terms automatically displayed (or to completely turn that feature off).

Term Lookup

Settings


All IPCC definitions taken from Climate Change 2007: The Physical Science Basis. Working Group I Contribution to the Fourth Assessment Report of the Intergovernmental Panel on Climate Change, Annex I, Glossary, pp. 941-954. Cambridge University Press.

Home Arguments Software Resources Comments The Consensus Project Translations About Support

Bluesky Facebook LinkedIn Mastodon MeWe

Twitter YouTube RSS Posts RSS Comments Email Subscribe


Climate's changed before
It's the sun
It's not bad
There is no consensus
It's cooling
Models are unreliable
Temp record is unreliable
Animals and plants can adapt
It hasn't warmed since 1998
Antarctica is gaining ice
View All Arguments...


Username
Password
New? Register here
Forgot your password?

Latest Posts

Archives

A Big Picture Look at Global Warming

Posted on 5 January 2012 by dana1981

Let's take a step back and have a look at what the data say about the warming of the Earth's climate. 

Rising Heat Content

The most relevant figure when talking about global warming is the Earth's total heat content.  Data from Church et al. (2011) recently updated this picture, showing that total global heat content continues its steady climb upwards.  As Figure 1 shows, most of this heat (about 90%) has gone into the oceans, and the continuing rise of both global and ocean heat content is probably the best indicator that global warming hasn't even slowed down.

THC

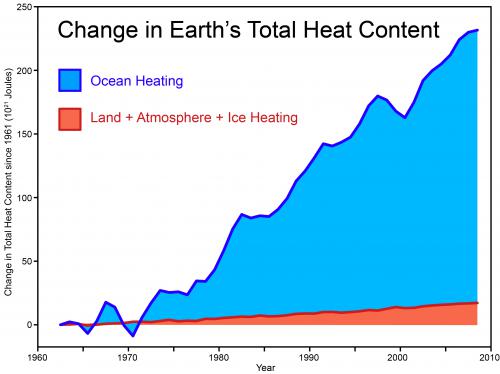
Figure 1: Total global heat content.  Data from Church et al. (2011).

Rising Surface Temperature

Although the rate of warming of surface air and lower troposphere temperatures appear to have slowed over the past few years, the same could be said at any virtually any point in time by cherrypicking short-term noise and ignoring the long-term trend (Figure 2).

skeptics v realists v3

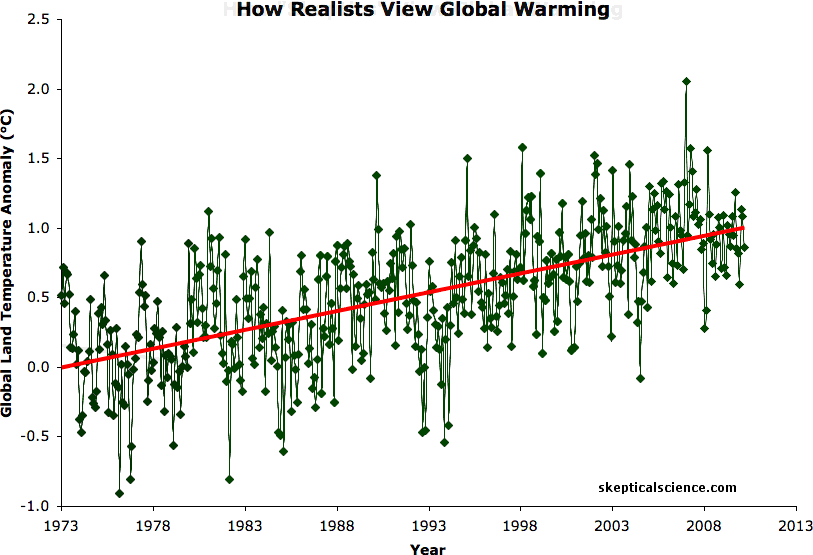
Figure 2: BEST land-only surface temperature data (green) with linear trends applied to the timeframes 1973 to 1980, 1980 to 1988, 1988 to 1995, 1995 to 2001, 1998 to 2005, 2002 to 2010 (blue), and 1973 to 2010 (red).  Hat-tip to Skeptical Science contributor Sphaerica for identifying all of these "cooling trends."

However, Foster and Rahmstorf (2011) found that when we filter out the short-term effects of the El Niño Southern Oscillation (ENSO) and volcanic and solar activity, the underlying global warming signal has remained remarkably steady.  Kaufmann (2011) similarly found that virtually every short-term effect has been in the cooling direction over the past decade.

Some question remains as to how much of the temporary slowdown in surface warming is due to human aerosol emissions, how much due to ENSO, how much due to heat being transferred to the deep oceans, and so forth.  Although these questions still need to be resolved through future research, the underlying global warming trend remains, and the short-term dampening won't last forever.

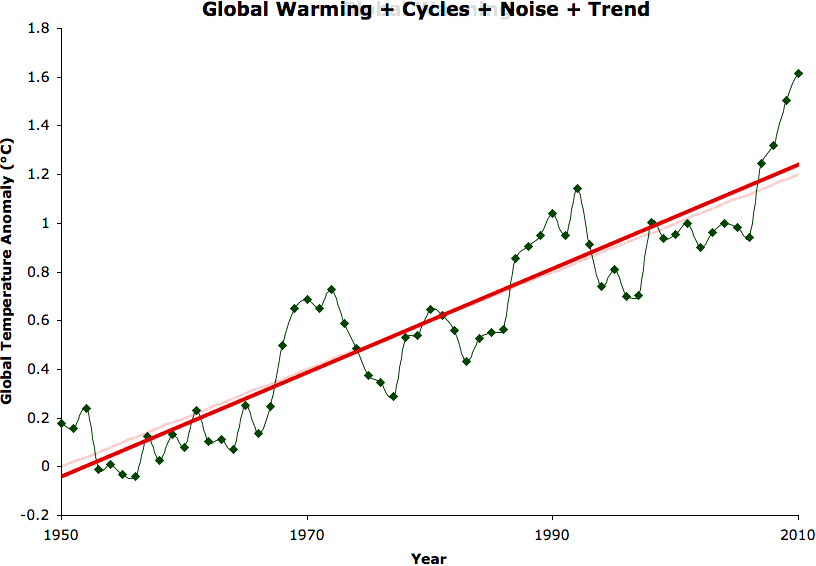
Step Change Curve Fitting Delusions

Some climate denialists continue to try and argue that rather than with a steady man-made warming signal, the data are better fit with abrupt step changes caused by El Niño events, followed by flat periods.  This is a physically incorrect argument which is easily refuted with one simple question - if El Niños cause abrupt temperature step changes upward, why wouldn't La Niñas cause equivalent abrupt temperature step changes downward?  However, as long as we don't mind disregarding physical reality, it's easy to pretend global warming just boils down to these El Niño step changes by playing the denialists' favorite game - curve fitting.

Sea Ice Decline

Some of the increase in global heat content has gone into melting ice, particularly in the Arctic, where the rate of warming is the largest on the planet.  Although Antarctic sea ice extent has modestly increased for various complex reasons, the loss of Arctic sea ice extent has been far more rapid, resulting in a net decrease in global sea ice extent (Figure 3).

global sea ice extent

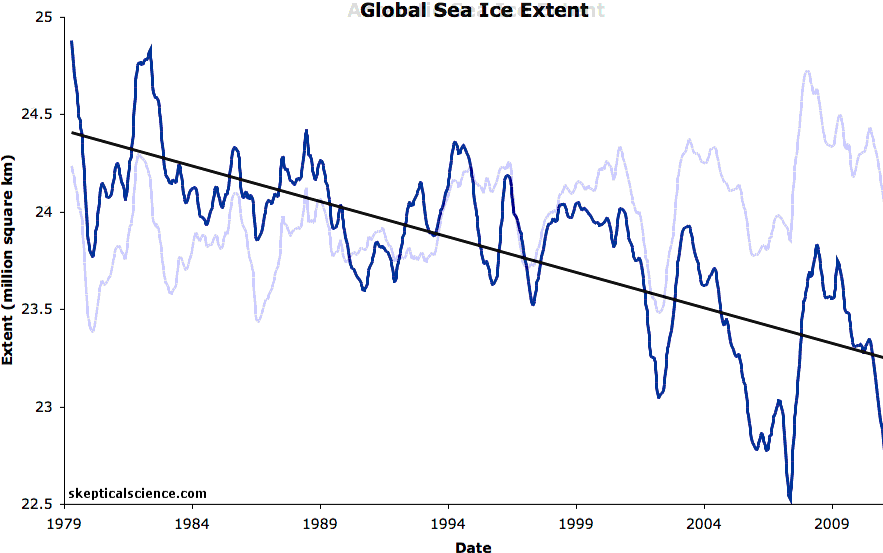
Figure 3: National Snow and Ice Data Center (NSIDC) Antarctic, Arctic, and global (sum of the two) sea ice extents with linear trends.  The data is smoothed with a 12-month running average.

Moreover, ice is a three-dimensional quantity, and Arctic sea ice volume has been declining even more rapidly than its extent.  Antarctic ice mass has also declined.

Snow Cover Extent Decline

Snow extent has fallen as well, though climate denialists argue otherwise by focusing on the winter months, while ignoring the spring and summer months.  A warming planet will not necessarily result in less winter snowfall, as more atmospheric water vapor will tend to lead to more precipitation, and in the winter that precipitation will often fall in the form of snow.  However, in a warming world, that snow will tend to melt earlier in the year, and thus we expect to see spring and summer snow cover extent decline.  That is indeed what we have observed.  As a result, annual northern hemisphere snow cover extent is declining at a rate of 325,000 square kilometers (km) per decade (Figure 4).

snow extent

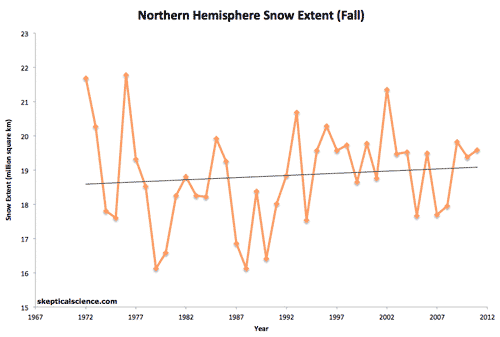
Figure 4: Seasonal and annual (with a 12-month running average) northern hemisphere snow cover extent (data from Rutgers University Global Snow Lab)

Rapid Global Warming

Certain climate denialists have also recently tried very hard to argue that the planet is not "rapidly warming," although "rapid" is a highly subjective term, which they have failed to define.

We can use paleoclimate data to create an objective gauge of what may be considered "rapid warming."  For example, transitions between glacial and interglacial periods are among the most rapid warming/cooling events in the paleoclimate record, and occur over several thousand years.  During these transitions, the Earth's average surface temperature changes by approximately 5°C.  Thus the average rate of warming during a glacial-interglacial transition is approximately 1°C per millenium, or 0.01°C per decade.  Our current rate of warming is approximately 0.08°C per decade over the past 100 years, 0.17°C per decade over the past 30 years, and is expected to increase in upcoming decades unless we get our greenhouse gas emissions under control.  Thus by an objective measure, the planet is indeed warming rapidly.

Reality Check

The bottom line is that no matter how hard we might try to convince ourselves otherwise, every line of observational evidence shows that the planet is warming, and from an objective geological perspective, it's warming at a rapid rate.

0 0

Printable Version  |  Link to this page

Comments

Comments 1 to 41:

  1. ...the planet is not "rapidly warming," although "rapid" is a highly subjective term, which they have failed to define. Per IPCC: Best estimate for a 'high scenario' is 4.0 °C per century Best estimate for a 'low scenario' is 1.8 °C per century Actual trend for CRU since Jan 1979 is 1.5 °C per century. Per IPCC: A temperature rise of about 0.2 °C per decade is projected for the next two decades for all SRES scenarios. Actual trend for CRU since Jan 2001 is -0.05 °C per decade (cooling). By the objective measure of the longer term trend, the planet is not "rapidly warming" but is "slowly warming".
    0 0
    Moderator Response: [Rob P] You seem to not understand the 'big picture.' Note figure 1 - labeled - Change in Earth's total heat content. Since 2001 that has increased substantially - as we would expect given our understanding of physics. See also:

    There has been a massive increase in ocean heat content since 2001. The ocean heat content will likely decline temporarily if we have another large El Nino or sequence of El Nino. La Nina is when the ocean actually gains heat, and since we have been in a largely La Nina dominated period since 2005-2006, it's little wonder global surface temperatures have not changed much. If we see a change to an El Nino-dominant period, we're going to get warming of global surface temperatures quick smart.

    [dana1981] You have committed two errors in this comment, (1) cherrypicking (both the data set and the timeframe - see Figure 2 above regarding the latter), and (2) comparing current warming rates to future projected warming rates.  Thus you have not justified your (incorrect) conclusion.  At best your argument is that the planet is warming more slowly than expected (although even that point is incorrect), but this would not prove that the planet is not warming rapidly.

  2. CW, For your IPCC references, could you tell use what the context is for 'high' and 'low'? I'm thinking there are scenarios for high and low emissions paths, and maybe high and low climate sensitivities, but I'm not sure I've heard of any 'rapid' versus 'slow' warming scenarios, strictly speaking. What I'm saying is that you are comparing apples and oranges. If you examine the all the rates of change over the earth's history, would the rate of change since the industrial revolution began fall near the upper end of that range, or the lower? Aside from some other candidates like major impact events or super-volcano eruptions, I'm pretty sure the current rate is very near the upper limit of the range. Any reason you choose CRU rather than GIS or BEST? I was kind of under the impression skeptics did not trust the results from that unit, given the controversy surrounding Dr. Jones and all. Dana, Thanks! I had a thought though that what really matters is ice mass or ice volume. So, rather than say southern sea ice extent growth is more than eclipsed by northern ice extent loss, you could say that both are loosing mass at an accelerating rate. I understand that isn't a simple comparison though because mass loss for Antarctica and Greenland is measured with gravity satellites (GRACE) and it is harder to measure Arctic sea ice volume than it is extent. However, losses in both hemispheres is a simpler message.
    0 0
    Response:

    [dana1981] Good point - text revised to reference Arctic sea ice volume and Antarctic ice mass declines.

    As I noted in response to CW's comment, he is comparing future projected temperature changes to past/current temperature changes.  As you note, it's an apples to oranges comparison.  Showing that the planet isn't yet warming as fast as we expect it to in the future most certainly doesn't demonstrate that the warming thus far isn't rapid.  It's just expected to become more rapid in the forthcoming decades.

  3. Geez, the troll patrol really sent out a flopper this time. The 'scenarios' aren't ranges, they're forcing expectations under different pollution conditions. There is no "CRU", there is a HADCRUT3 - and leaving out the polar regions is warning bell 1 for troll alert. Warning bell 2 is the "since Jan 2001". The pathos here is that it's not "since Jan 2001", it's 'since 2001' - which is a hoodwink to take advantage of the anomaly temperature peak in Dec 2001. Using a combined set with the rotten cherry-pick produces a flatline - only because of two double-dip La Nina's in the latter half of the decade: http://www.woodfortrees.org/plot/hadcrut3gl/from:2000/plot/hadcrut3gl/from:2000/trend [inflammatory snipped]
    0 0
    Moderator Response: [Rob P] - try to keep it civil thanks. We understand the frustration, but this is not the blog for venting.
  4. @Moderator - there was no frustration. Climatewatcher got the same respect from me that he gave the science.
    0 0
  5. @Climate watcher #1 I think the problem is one of thinking in human time scales. As I understand it, speaking geologically, a temperature rise equivalent to 15degreesC in just 1,000 years is very rapid. According to the IPCC "although large climate changes have occurred in the past, there is no evidence that these took place at a faster rate than present warming". (IPCC FAQ 6.2)
    0 0
  6. 1. Dana wrote "comparing current warming rates to future projected warming rates." One cannot use future projections to validate future projections. If temperature trends are to reach the future projected trends, they must accelerate. That could still happen, but instead, for the last eleven years, warming trends have decelerated.
    0 0
    Response:

    [DB] "for the last eleven years, warming trends have decelerated"

    The point is without statistical merit and amounts to being specious and argumentative.

  7. 5. John Russel the GISP record is regional not global, but it does indicate a fair number of temperature spikes: "http://upload.wikimedia.org/wikipedia/commons/5/57/Greenland_Gisp2_Temperature.svg"
    0 0
    Response:

    [DB] Your reference is to local/regional data and is thus off-topic for a global thread such as this one.  Please keep in mind the nature of the OP.

  8. CW @6 - you continue to miss the point. If you're going to argue that the planet isn't "warming rapidly", you need an objective definition of what that phrase means. My solution was to use the paleoclimate record. Your solution is to compare current warming rates to projected future warming rates. Your argument is thus equivalent to "if the planet isn't currently warming as fast as we expect it to warm in the future, then it's not warming rapidly." To be blunt, that argument makes no sense whatsoever. Moreover, you continue to focus on short-term noise while ignoring the long-term trend. I again refer you to the 'Rising Surface Temperature' section of the above post.
    0 0
  9. Climate Watcher criticizes paleo ice-core records as regional while resting on HadCrut which has its own limitation of eliminating polar regions. Dana's context is valid to the point of extremely conservative: glacial to inter-glacial 8dC over 5k years is a stability crawl compared to a 2dC rise over a century. It isn't 'climate change', it's 'biosphere disruption'. The big picture is that graph showing heat transfer to the deeper layers of the oceans - 3D AGW at a measurable rate in a human-observable period.
    0 0
  10. To @ ClimateWatcher. Please compare paleoclimate quantities of CO2 in the atmosphere to average global temperature. Assuming you accept CO2 is the main level of the Greenhouse effect you can then be left in no doubt that a substantial and rapid Earth System warming is inevitable given the relative atmospheric lifetime of CO2 when compared to manmade aerosols. If you do not accept that CO2 is the main lever for the greenhouse effect please consult with the following papers: http://pubs.giss.nasa.gov/cgi-bin/abstract.cgi?id=la09300d http://pubs.giss.nasa.gov/cgi-bin/abstract.cgi?id=sc05400j http://pubs.giss.nasa.gov/abs/ha05510d.html When discussing the future of the species or climate and ecosystem health it is not very helpful to focus on decadal variations.
    0 0
  11. By the way an excellent post by Dana.
    0 0
  12. CW#6: "for the last eleven years, warming trends have decelerated" [DB] reply: "The point is without statistical merit... " Not to mention the fact that the point is also incorrect. See Foster and Rahmstorf: There is no indication of any slowdown or acceleration of global warming, beyond the variability induced by these known natural factors."
    0 0
  13. From "The Gathering Storm" (May,1935),WS Churchill's first book in his "The Second World" series,page 112,Reprint Society,1951. "There lay in my memory at this time some lines from an unknown writer about a railway accident.I had learned them from a volume of Punch cartoons which I used to pour over when I was eight or nine years old at school at Brighton. Who is in charge of the clattering train? The axles creak and the couplings strain; And the pace is hot,and the points are near, And Sleep has deadened the driver's ear, And the signals flash through the night in vain, For Death is in charge of the clattering train."
    0 0
  14. Scientifically I don't like this post. Nothing here has enough detail to be refuted. Graphs claim "this is what the skeptics think" without actually sourcing the graph. Since I have never seen this graph on a skeptic site I am guessing no skeptics think that. In which case what is the integrity level of the Global Warming researcher that produced this? (-Snip-) Changes in total earth heat content are pretty meaningless. Let's say our margin of error in measurement is 10 digits of mantissa. Now lets draw error bars on the graph. They are bigger than the entire graph. -> Waste of time graph. Put another way how would you calculate the amount of joules entering and leaving the earth with any degree of accuracy? (-Snip-). That doesn't mean it is wrong. Just a meaningless graphed numerical model like the Mandlebrot set. Pretty but pointless.
    0 0
    Response:

    [DB] "Scientifically I don't like this post."

    Then give us some scientific specifics.

    "Nothing here has enough detail to be refuted."

    Incorrect.  All of this is considered in individual posts here at SkS and the entire OP contains specific links to the peer-reviewed literature it cites.

    "Since I have never seen this graph on a skeptic site I am guessing no skeptics think that."

    Straw man.  Because you have never seen the Emperor Caesar Augustus then that therefore means he was made up, right?

    "Changes in total earth heat content are pretty meaningless."

    Meaningless?  It is the entire point.  If you cannot understand this fundamental point then you need to comment less and learn more.  QED.

    Claims of falsification snipped.

  15. How does a La Nina or El Nino event effect the global mean temperature. My understanding is that they cause cooling and warming effects on a regional basis for a short term only.
    0 0
    Response:

    [DB] It is insisted that you must first respond to the unsupported assertions you made in this comment before you can then move on to other subjects.

  16. JamesWilson: You're kidding, right? Right? Try reading the comments on your average WUWT post, or perhaps the comments on almost any news article, blog post, &c where pseudoskeptic tripe & nonsense is allowed free reign. Try reading the comments of the likes of ClimateWatcher, TOP, Fred Staples, RW1, and many others on this site alone. All over the Internet, the airwaves, and newsprint there are pseudoskeptics cherry-picking data to claim that global warming has "flattened" (or there has been "no warming since 1998" or whatever you want). The graph, showing the various decadal periods of cooling, is a satire by reductio ad absurdum. Please also substantiate your claims regarding total Earth heat content with reference to peer-reviewed scientific publications or by appeal to widely-accepted physics. Without such support, they can be safely dismissed as nonsense.
    0 0
  17. JamesWilson, the graph rebuts claims that 'it has not warmed since 1998' and the like... which is currently #9 on the list of frequent 'skeptic' claims. If you truly have never heard that then you simply haven't been paying attention. In any case, examples of this false claim can be found in that link and many other pages on this site. The fact that you assume the lack of documentation of false claims in this overview post means that no such documentation exists, rather than that it is an overview / summary and thus not covering all the details, is indicative of interpretative bias on your part. As to your claim that margins of error in heat measurements are greater than anomalies... you provide no basis for this claim and it contradicts numerous scientific studies, including those cited for the graphs. It thus appears to be a false claim which you choose to advance and/or believe rather than dealing with the actual evidence.
    0 0
  18. JamesWilson @14 - if you're referring to Figure 2 (there are 4 figures, and thus saying "the graph" is entirely too vague), then I guarantee you have seen it on a 'skeptic' site. Any graph or claim of 'no warming since 2001' or 1998 [insert date] is illustrated by the segments (with blue lines) in Figure 2. As DB notes, making general disparaging comments without any specifics is not constructive. mace - El Nino and La Nina result in short-term warming and cooling (respectively) of global (and regional) surface temperatures.
    0 0
  19. JamesWilson - "Scientifically I don't like this post" I'm sure you don't like it, but where's the 'scientific' argument to support your claims? "Changes in total earth heat content are pretty meaningless" Clearly the world's ice sheets, glaciers, sea level, and plants/animals don't share that ill-informed opinion.
    0 0
  20. @dana1981, but I don't understand that bit. Why would an oscillating ocean current contribute to global mean temperature. El Nino warms America and cools Australia, La Nina does the opposite. i.e. on a regional basis it has an effect but should have no net effect globally.
    0 0
    Response:

    [DB] A Reminder:  It is insisted that you must first respond to the unsupported assertions you made in this comment before you can then move on to other subjects.

  21. @DB. I keep responding. The posts disappear. Not sure why. Still this seems to me to be a good scientific question to ask, bearing in mind that 2011 being only the 11th warmest year is accounted for by a moderate La Nina event cooling the planet. I'd include links but assume that most people on here are familiar with this information and it just takes too long to keep googling the sites and copying and pasting the urls.
    0 0
  22. mace... Because the ocean is such a large reservoir of heat, any change in how much heat gets into (or comes out of) the oceans has a significant impact on the amount of heat in the atmosphere. El Nino actually releases heat from the ocean to the atmosphere under normal conditions, La Nina does the opposite. So there is more heat in the atmosphere after El Nino and less after La Nina. The heat in the atmsopshere is what we on land experience. Capiche? Even Spencer, Christy and Lindzen would not argue against this.
    0 0
  23. Mace @ 20 - wrong. ENSO affects global temperatures because the Pacific Ocean is very large, and the two phases (La Nina/El Nino) distribute heat in the water column in two distinct ways. Thus: La Nina = strengthening trade winds blow warm surface water across to the western Pacific where it 'bunches up" and a substantial proportion ends up below the surface layer. The strengthening winds promote the upwelling (ekman pumping) of deeper colder water along the coast of South/ Central America. The combination of these two processes and the air-sea exchange is sufficient to cool surface temperatures globally. El Nino = the easterly trade winds shut down and heat accumulates in the eastern and central Pacific Ocean. Upwelling along the coast of America shuts off. Net result is a lot of warm water in the surface layer of the ocean. Once again because of the air-sea exchange of heat, global surface temperatures rise as heat is lost from the ocean. This meme is popping up a lot recently in the threads, so I guess I'll have to write up a post/rebuttal.
    0 0
  24. @Stephen Baines. Ok but the global mean temperatures are usually a combination of ocean and air temperatures. If the ocean is releasing heat to the air, why would this increase the mean temperature?
    0 0
  25. An important qualifier to the effect that ENSO has on global surface temperature is that all ENSO does is move energy around in the Earth climate system (e.g. warming atmospheric & surface temps by cooling ocean temps or vice versa). This is contrasted with the energy imbalance caused by adding IR-trapping gases, which cause the Earth climate system to accumulate more energy in all components.
    0 0
  26. No the graph produced is meaningless scientifically. Let me explain what I mean. I can draw a graph about something relevant. Let's say I draw a graph for the UN that shows the population peaking before 2050 and dropping. Now I ran 75 numerical series picking and choosing methods to refine the graph and my margin of error is to the nearest Trillion. (1000 times larger than to the nearest billion). What it represents is meaningful. The way it was produced although mathematically sound was not meaningful. Do you get the scientific difference? Trying to calculate the number of joules retained by the earth is by definition an almost impossible job. The numerical methods to do it might be logically sound but if you understand the math behind it it is similar to multiplying both sides of the equation by zero. Mathematically fine but not meaningful. How do you measure the joules the earth loses every day? How do you measure the incoming energy? What is the error margin on both? Every time you numerically manipulate data from the original source you introduce two problems. Error and bias. I like I think the majority of people on both sides believe the peer review process is inherently broken. Why? Because of the number of papers retracted after the peer review process verified them. So my goal is to look for the *least* processed/manipulated numbers. Not things that show what I want to see but which can't be argued with. Unfortunately that seems to leave very slim pickings.
    0 0
  27. @Rob Painting, Ok, I can see that if we measure ocean temperature close to the surface, and a La Nina causes upwelling from deep, this would have a cooling effect. Would we not see a stronger cooling effect in the southern hemisphere than the northern hemisphere, however? I'm assuming here that the cooling effect of the La Nina doesn't dissipate around the whole globe rapidly.
    0 0
  28. JamesWilson - the ocean heat content represents the most up-to-date estimates. Armwaving because you don't like the results is unconvincing. Many fake-skeptics have trumpeted the ocean heat measurements down to 700 mtrs when they thought it showed cooling. But now that measurements going deeper (2000 mtrs) show massive ocean warming, it's suddenly meaningless. You strain credulity.
    0 0
  29. JamesWilson: Let's say you start doing the following: (a) learning enough about what you are arguing against instead of arguing from what appears to be ignorance (e.g. "How do you measure the joules the earth loses every day? How do you measure the incoming energy? What is the error margin on both?" - have you even bothered to follow the links provided in the OP to the literature describing how climatologists calculate these things?); (b) coming up with specific examples instead of vague, unsubstantiated claims (e.g. "Because of the number of papers retracted after the peer review process verified them" or, even better "I think the majority of people on both sides believe the peer review process is inherently broken."). You can say what you like about this or that graph being "meaningless scientifically" but if that's all you do (e.g. no reference, maths, or physics to back it up) you're not going to get very far here, I'm sorry to say.
    0 0
  30. JamesWilson wrote: "I like I think the majority of people on both sides believe the peer review process is inherently broken. Why? Because of the number of papers retracted after the peer review process verified them." I can't think of a single paper on global warming which has been retracted because it overstated the AGW case. Yes, there have been several which disputed the AGW consensus which were complete nonsense... but in every case they were published in relatively obscure journals that were ill equipped or unwilling to perform proper peer review. Thus, I think that most informed people understand that the peer review process is just fine. The occasional instances of unscientific nonsense slipping through the cracks are invariably identified and dealt with in short order. Unless you can cite evidence to the contrary (i.e. examples of papers being retracted for incorrect promotion, rather than denial, of AGW) this just looks like more of your, 'I want to believe something, so I will first believe many false things to build up a 'case' for it'. The claims of massive error margins are equally baseless. Cite an example and back it up. The papers cited as the basis for the graphs in the article above explain how they arrived at those numbers and why the error margins are constrained. You simply assume otherwise with no apparent basis at all.
    0 0
  31. @mace. ENSO is largely an equatorial phenomenon. That said, I don't think your concern about the hemispherical distribution of heat has much relevance in a thread about global patterns and the big picture. @JamesWilson Frankly, I can't make heads or tails of what your saying regarding uncertainty, partly because it is completely unconstrained by the actual calcuylations in the paper being referenced. I'd read Church et al, and make sure to understand it before heaving such wild criticisms about. Also, a very very small percentage of papers in the scientific literature actually get retracted, so I don't understand your point there either.
    0 0
  32. @Stephen Baines. Thanks. That's a logical answer which appears to match the data. The NASA GISS website produces graphs for northern hemisphere, southern hemisphere and tropical ranges, so you'd imagine that El Nino and La Nina events would have a more dramatic effect on the tropical ranges and a less dramatic effect on the rest of the planet based on the info you've supplied. The ENSO events are mapped against the tropical and global data in the "seasonal mean temperature change" graph at the bottom of this link. Nasa GISS data
    0 0
  33. Mace -"so you'd imagine that El Nino and La Nina events would have a more dramatic effect on the tropical ranges and a less dramatic effect on the rest of the planet based on the info you've supplied" Really? Here's the current La Nina. What do you think should happen to the distribution of global temperatures? And what peer-reviewed paper supports this?
    0 0
  34. Simplified I know BUT No need to argue the graphs. If you can accept that Earth has an atmosphere that allows for life. If you can accept the 19thC science that CO2 & water vapour are the principle agents in sustaining a temperate atmosphere that allows life to flourish. distinguishing Earth from our neighbours Mars or Venus you can work the rest out for yourself. Coal & Oil are stores of Carbon laid down over geological time that human creativity has found a way to use for productive work. Basically we burn both coal & oil to transform the stored Carbon into energy we control. Next time you jump in the SUV to go to work think stored energy in the tank gets burnt in the engine to produce energy to move the vehicle plus exhaust gases out the back. Every other vehicle you see on the Freeway is also pumping exhaust gases out the back and have been doing since before Henry Ford. What's in those gases and where do they go. Principally CO2, water vapour and nitrous oxides ( another known greenhouse gas). The measurement of atmospheric CO2 done at Mona Kea shows a continuing rise in recorded levels of CO2 which would suggest a good portion of exhaust gases stay in the atmosphere. Measurements of CO2 in oceans shows a similar rise suggesting that another portion is taken up by the worlds oceans. We know from the 19thC that increasing CO2 warms the atmosphere and decreasing CO2 cools the atmosphere. With increasing levels of CO2 unsurprisingly we have a warming atmosphere. A warmer atmosphere evaporates more water increasing atmospheric water moisture . My pond loses more water in summer than winter. More water vapour in the atmosphere also produces more warming. Put a pan of water on a stove and add a little heat and the water starts to gently circulate as it warms. Same with the atmosphere,in simple terms that's where we get wind and weather from. Add heat to the water in the pan and the water circulates faster, the atmosphere is no different. There's the problem, more exhaust gases more atmospheric heat, more atmospheric water, ever increasing temperatures and atmospheric circulation. American science has just told us that the volume of greenhouse gases entering the atmosphere last year showed an increase of approx. 6 % . Now with money a 6% rate of interest compounded doubles your money in 12 years. If you don't like a single years figures then the average increase over 10 years comes in at 3% which gives us a doubling in 24 years. How much additional heat, water vapour and atmospheric turbulence will these numbers generate. Your call. Johnb
    0 0
  35. dana1981 and mace, moderator Rob P stated at #1 that nino has ocean cooling tendencies and nina has ocean warming tendencies. It seems that many ninas can lead to the earth system heat gains manifesting themselves in the water rather than in the air. So if you only look at air temperatures, globally it may appear to go down during a nina. I think mace's implication was that a local shuffling of (air) temps, as nino/nina might involve, should affect regions but the globals should not be affected. As Rob P might suggest, that observation ignores the oceans. If we look at air+ocean temps, then nino/nina may not have much or any global trends all by themselves.
    0 0
  36. James Wilson: Trying to calculate the number of joules retained by the earth is by definition an almost impossible job. The numerical methods to do it might be logically sound but if you understand the math behind it it is similar to multiplying both sides of the equation by zero. The nice things about mathematical arguments like this one is that they can be presented in mathematical terms and then checked for accuracy. In other words, please show your work.
    0 0
  37. Also, I'm sure I've said this before, but people who make unsubstantiated claims about things like "the number of papers retracted after the peer review process verified them" really shouldn't be allowed to post any further comments until they support their accusations with hard evidence. If they can't do that, they really shouldn't be allowed to post further comments until they acknowledge being mistaken. If they won't do that, they really shouldn't be allowed to post any further comments, period. I know moderators have their hands full, but this situation where people like James Wilson can indulge in this kind of basically irresponsible behavior, ignore corrections and then move blithely on to the next bit of misinformation is intolerable and really needs to stop. This behavior's at least as socially disruptive as name-calling or political ranting, and far more destructive to the actual purpose of this site. That's what I think, anyway.
    0 0
  38. @Phila - in some disciplines, notably medical research, retractions are not uncommon at all. Retraction Watch is dedicated to the theme. Nature has not only engaged in retractions, but noted the increase and dedicated an article to the theme: http://www.nature.com/news/2011/111005/full/478026a/box/2.html The ironic part about the attention drawn to the area of climate science is that the most notorious retractions are the Remote Sensing scam of 2011, and the Soon/Baliunis rewrap of 'The Petition' document: http://www.realclimate.org/index.php/archives/2011/09/resignations-retractions-and-the-process-of-science
    0 0
  39. @ Dana: There's a broken link embedded in "climate denialist" -- first sentence of first paragraph in the Rapid Global Warming section.
    0 0
  40. Hmmm, somehow I missed the 'Fall snow cover' graph in the top article until now. It is interesting that this shows a slightly increasing trend. This would seem to support ideas about increased atmospheric water vapor content and airflow leading to more snowfall. There have been some 'freak' early snow storms in the past few years which may not be all that unusual in the future. If a stronger hydrological cycle means Arctic air gets pulled down to mid-latitudes and mixes with warmer, water-laden, air more often then we may be seeing alot more Fall snow storms. The basically flat Winter results are also interesting. More snow in the Fall should lead to more snow cover in Winter... that it hasn't suggests that we are seeing more Winter snow melt than we used to. The declining trends in Spring and Summer are consistent with increased melt from the rising temperatures.
    0 0
  41. I realize this is late, but perhaps it can be answered. In the graph in the moderator response to comment #1, we see a sharp rise in OHC700 and OHC2000 from roughly 2002-2005. That time period was one of a lengthy El Nino. Seem odd. Any explanation? Also, how was OHC2000 measured before ARGO in the year 2000? Thanks.
    0 0

You need to be logged in to post a comment. Login via the left margin or if you're new, register here.


The Consensus Project Website

THE ESCALATOR

(free to republish)


© Copyright 2024 John Cook
Home | Translations | About Us | Privacy | Contact Us