Climate Science Glossary

Term Lookup

Enter a term in the search box to find its definition.

Settings

Use the controls in the far right panel to increase or decrease the number of terms automatically displayed (or to completely turn that feature off).

Term Lookup

Settings


All IPCC definitions taken from Climate Change 2007: The Physical Science Basis. Working Group I Contribution to the Fourth Assessment Report of the Intergovernmental Panel on Climate Change, Annex I, Glossary, pp. 941-954. Cambridge University Press.

Home Arguments Software Resources Comments The Consensus Project Translations About Support

Bluesky Facebook LinkedIn Mastodon MeWe

Twitter YouTube RSS Posts RSS Comments Email Subscribe


Climate's changed before
It's the sun
It's not bad
There is no consensus
It's cooling
Models are unreliable
Temp record is unreliable
Animals and plants can adapt
It hasn't warmed since 1998
Antarctica is gaining ice
View All Arguments...


Username
Password
New? Register here
Forgot your password?

Latest Posts

Archives

Lindzen's Junk Science

Posted on 8 March 2012 by dana1981

This is a re-post from Gavin Schmidt at RealClimate regarding another Lindzen misrepresentation in the seminar discussed in Lindzen's London Illusions.  As noted by Skeptical Science reader WheelsOC, the graphic in question used by Lindzen in his London presentation appears to have been created by Howard Hayden and posted on Junk Science.  This suggests that the error discussed by Schmidt was actually made by Hayden and then uncritically reproduced by Lindzen (who also did not provide a reference citation for the faulty graphic in his presentation).

Richard Lindzen is a very special character in the climate debate – very smart, high profile, and with a solid background in atmospheric dynamics. He has, in times past, raised interesting critiques of the mainstream science. None of them, however, have stood the test of time – but exploring the issues was useful. More recently though, and especially in his more public outings, he spends most of his time misrepresenting the science and is a master at leading people to believe things that are not true without him ever saying them explicitly.

However, in his latest excursion at a briefing at the House of Commons in the UK, among the standard Lindzen arguments was the following slide (which appears to be a new addition):

junk graphic

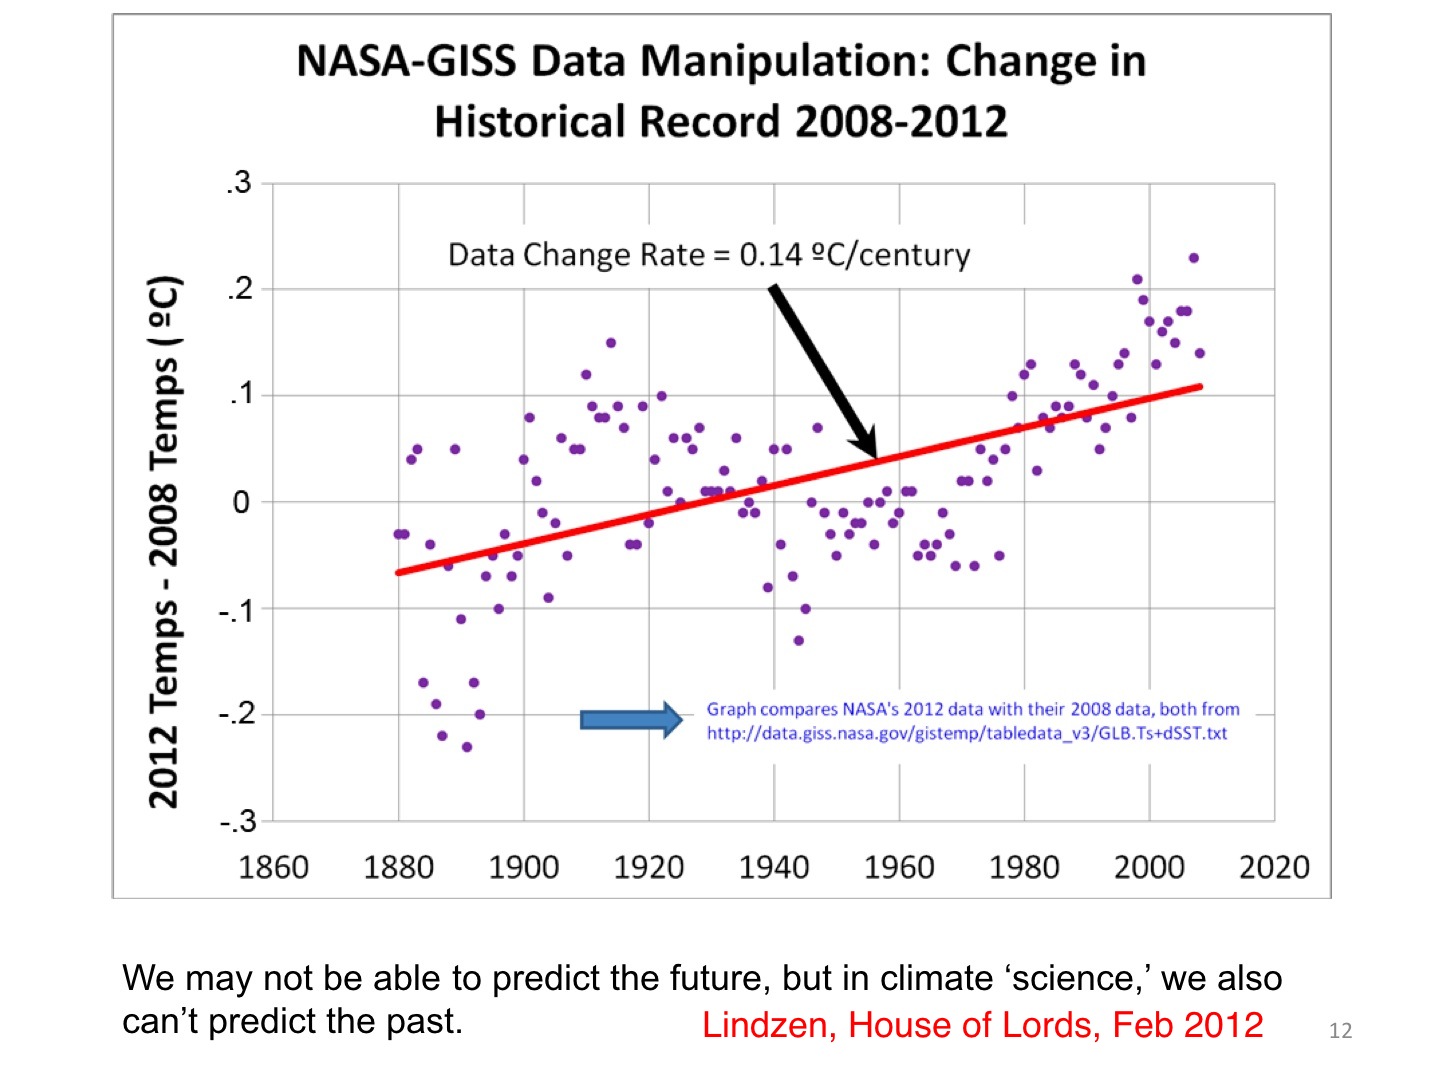
What Lindzen is purporting to do is to compare the NASA GISS temperature product from 2012 to the version in 2008 (i.e. the y-axis is the supposedly the difference between what GISS estimated the anomaly to be in 2012 relative to 2008). A rising trend would imply that temperatures in more recent years had been preferentially enhanced in the 2012 product. The claim being made is that NASA GISS has ‘manipulated’ (in a bad way) the data in order to produce an increasing trend of global mean temperature anomalies (to the tune of 0.14ºC/Century compared to the overall trend of 0.8ºC/Century) between the 2008 and 2012 versions of the data, which are apparently shown subtracted from each other in Lindzen’s figure. Apparently, this got ‘a big laugh’ at his presentation.

However, this is not in the least bit true: the data are not what he claims, the interpretation is wrong, and the insinuations are spurious.


The annotation indicates that Lindzen is using the GISTEMP Land-Ocean Temperature index (LOTI, i.e. the index that includes weather station data and sea surface temperature data to give a global anomaly index with wide spatial coverage) (“GLB.Ts+dSST.txt”). There is another GISTEMP index (the Met station index) which only uses weather station data (“GLB.Ts.txt”) which doesn’t have as much coverage and has a substantially larger trend reflecting the relative predominance of faster-warming continental data in the average.

Old versions of the data can be retrieved from the wayback machine quite readily, for instance, from February 2006, October 2008 or December 2007. The current version is here. I plot these four versions and their differences below:

gistemp evolution

As should be clear, the differences are tiny, and mostly reflect slightly more data in the earlier years in the latest data and the different homogenisation in GHCN v3 compared to GHCN v2 (which was used up to Dec 2011). This is however in clear contradiction with Lindzen – the biggest difference in trend (between 2006 and today), is a mere 0.05ºC/Century, and from 2008 to 2012 it is only 0.003ºC/Century – a factor of 40 smaller than Lindzen’s claim. What is going on?

The clue is that the transient behaviour of Lindzen’s points actually resembles the time evolution of temperature itself – not homogenisation issues, or instrumental or coverage changes. Indeed, if one plots the two GISTEMP indices and their difference (using current data), you get this:

current gistemp

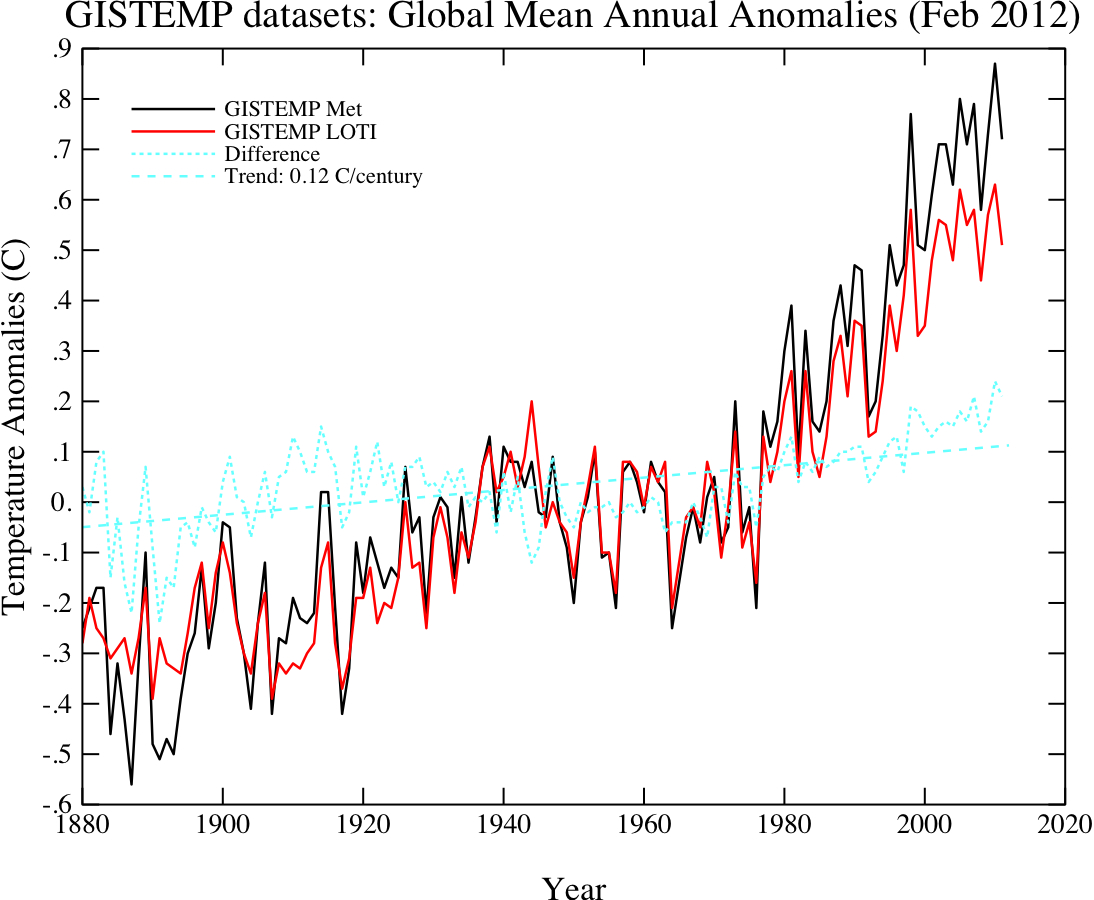
Thus it looks very much like Lindzen has plotted the difference between the current Met Station index and an earlier version of the LOTI index. I plotted the Feb 2012 Met index data minus the Feb 2009 LOTI index, and I get something very close to Lindzen’s figure (though it isn’t exact):

replicating lindzen
lindzen junk

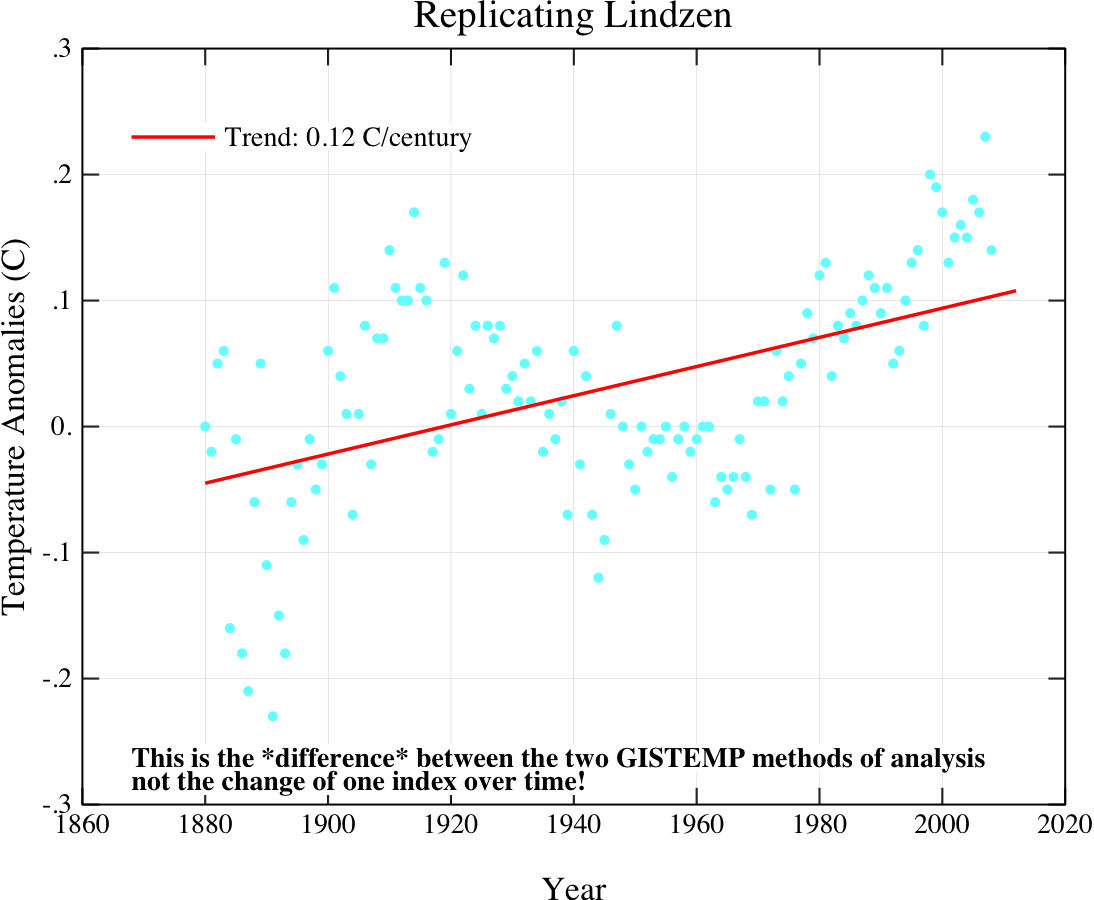
This is sufficient to conclude that Lindzen did indeed make the mistake of confusing his temperature indices, though a more accurate replication would need some playing around since the exact data that Lindzen used is obscure.

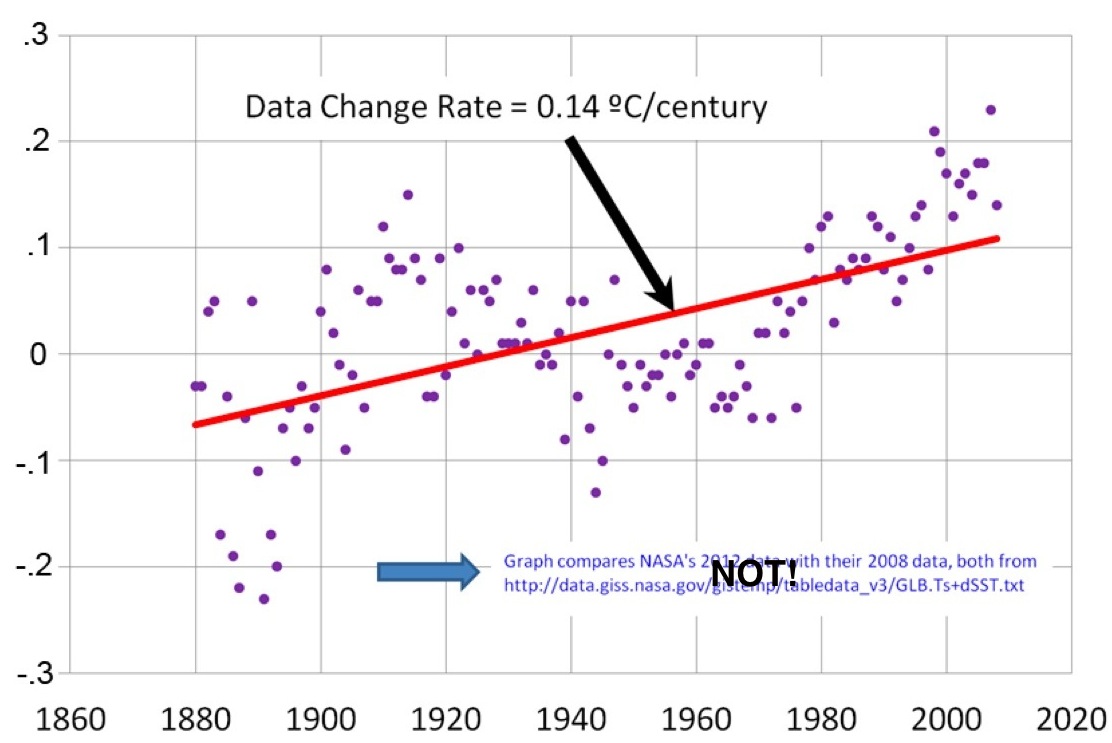
Thus, instead of correctly attributing the difference to the different methods and source data, he has jumped to the conclusion that GISS is manipulating the data inappropriately. At the very minimum, this is extremely careless, and given the gravity of the insinuation, seriously irresponsible. There are indeed issues with producing climate data records going back in time, but nothing here is remotely relevant to the actual issues.

Such a cavalier attitude to analysing and presenting data probably has some lessons for how seriously one should take Lindzen’s comments. I anticipate with interest Lindzen’s corrections of this in future presentations and his apology for misleading his audience last month.

1 0

Printable Version  |  Link to this page

Comments

Comments 1 to 24:

  1. If Lindzen had a real & robust case to support his claims re: contemporary climate changes, he would have published it in the peer-reviewed lterature, received the gratitude of almost every other climate scientist (who would be relieved to find that their concerns were no longer supported) and on the way to Stockholm for a Nobel prize. Instead, he's stuck presenting junk science such as documented here (or in the London Illusions post) to political figures and, for lack of a better term, celebrities, with political, ideological or financial interests in preventing effective policy action to avert warming.
    0 0
  2. Me thinks I should be emailing Dr. Hansen about this. In fact, I will.
    0 0
  3. Lintzen making an accusation of deliberate falsification by NASA is repugnant. Tony T. Watt holds court with this kind of smear tactic. Lintzen has drifted so far from his academic roots, it's MIT that needs to splain things to him. Historical records are revised whenever new data or errors of interpretation are uncovered (ask the guys at UAH about a career in it). Lintzen should accuse Spencer and Roy of the same thing. The U.S. Government just cancelled a NOAA project to do a detailed reconstruction of American weather conditions for the entire 20th century. That certainly would have revised the ddata sets, and by extension the global data sets. There is a current blog-buzz over apparent temperature adjustments to Icelandic data - without consulting the meteorologists in Reykjavik. Lintzen is no better than the blogs. The MET is coming out with a 'new and improved' HadCrut4. Ricky MIT might want to leave England before he smears that one. Lintzen, beyond whatever data-selection errors he may or may not have had, is playing the Janus when he points at inaccurate or insufficient data, and then cries 'fix' when the dataset is upgraded. He's jumped the shark on this one.
    0 0
  4. Sorry, this is somewhat off topic, so you can delete this after reading. Your excellent Escalator graph seems to have a small bug: in the 'Skeptical' version the temperature drops completely at the right end of the graph (but without a point??). I know we have had some 'flattening' over the last decade, but we didn't drop to the 1973 value, did we? Also in the 'Realist' version I don't see the drop. P.S. Of course if the value really occurred, we should include it!
    0 0
  5. Dick @4, There is no bug. The "skeptical" (==ignorant or willfuly misleading) version draws from incomplete 2011 data and goes out of whack. The realist version draws from complete data. It is explained in this thread: http://www.skepticalscience.com/going-down-the-up-escalator-part-2.html
    0 0
  6. @5 Chriskoz Thank you for your explanation. However I do not see any mention of the weird end point in the link you give; only the general mechanism is given (which is of course perfectly obvious to anybody unbiased). It may be good to explain the weird end point explicitly, because a small thing like that is used by the denialists to cast doubt on the whole graph. PS If I overlooked something, apologies.
    0 0
  7. Dick - the weird end point is due to data only from Antarctica temperature stations being incorporated into the BEST temperature series at that time. Why they didn't wait for further data to come in before release is unknown. I agree - it creates confusion. Dana's very busy at the moment, but maybe he'll update the animation in the coming months.
    0 0
  8. Dick, that version of the graph was used by 'sceptics' (e.g. in the Daily Mail here)
    0 0
  9. The final 2 data points in the Escalator, which are only based on ~40 Antarctic stations, are kept intentionally because the 'skeptics' used those data points to argue that global warming had stopped. However, if you prefer, there is a version using NOAA data which is more up-to-date and does not have the incomplete data points.
    0 0
  10. If I understand correctly, Dr. Lindzen is plotting the difference between two datasets but presenting it as the difference between two versions of the same dataset. Is this correct? (I am a biologist, not a climate scientist, so I am asking for verification.) If so, I can't explain how a scientist would do such a thing.
    0 0
  11. pvincell - correct, except that it appears to be Howard Hayden who made this error, and Lindzen simply used Hayden's plot without verifying its accuracy (see the green box at the top of the post). It's certainly possible that Hayden simply clicked the wrong data set in one instance, but Lindzen should have known better than to uncritically accept a plot posted on Junk Science (or wherever he got it) which accuses other scientists of data manipulation without verifying its accuracy.
    0 0
  12. Ah, thanks for clarifying. Either way, if it were me, I would issue a retraction, even if it were a trivial issue (which this is not, of course). Thanks for keeping us educators informed, Skeptical Science folks.
    0 0
  13. Albatros @ 2 Hanson has been giving a talk at TED2012 and it is well worth watching, especially by those who are still in doubt about Climate Change. He not only talks from the heart, but as we on this side of the fence are fully aware, he actually knows what he is talking about. Perhaps a better description would be that he is the exact opposite of Monckton.
    0 0
  14. I'd like to clarify that it was Hank Roberts who pointed out the early origin for the graph in comments at the original RC post. I just brought his discovery to the discussion in the comments over here. I haven't watched Lindzen's presentation or read his slides, so I don't know how he handled Hayden's argument or attributed the graph.
    0 0
  15. #7 #8 #9 Thanks for clearing this up guys. I appreciate it.
    0 0
  16. According to Gavin Schmidt regarding : "Note that I have received a note from Lindzen apologising for the error (and I have passed it along to the people involved in GISTEMP). - gavin" My compliments to Dr. Lindzen for this - not everyone is willing to acknowledge an error.
    0 0
  17. It's commendable to admit it and take steps to correct the mistake. It's also unfortunate that he has a litany of long-standing mistakes that are not corrected even after being exposed repeatedly, mistakes that continually show up in his popular writings and editorials.
    0 0
  18. Yes, while it's nice that Lindzen has admitted to one mistake, there are a whole lot more that he not only fails to correct or apologize for, but has been making for over 2 decades.
    0 0
  19. @KR - That was decent of Lintzen - he did the right thing. Great that you posted this - the myth will likely have legs among the pollutionist blogs, so it's nice to have a flyswatter response.
    0 0
  20. dana1981@18, Could you list them?
    0 0
  21. jzk - see Lindzen Illusions top left-hand corner of the SkS page.
    0 0
  22. #1 Composer99 As I have said elsewhere, Lindzen's talk was given to an audience comprised mainly of Repealtheact rentamob (i.e. members of the supposedly "sceptical" public) and scientifically-illiterate journalists. Apart from Lord Monckton and Sammy Wilson, the only other MP present (in the audience) was former Trade and Industry secretary Peter Lilley. The closest one could possibly get to celebrity status would be James Delingpole. When I last checked, the Repeal the Act ePetition had just over 1000 signatures so they are never going to change policy that way (100k required to trigger Debate) but what is more concerning is Monckton's claim that Lindzen was whisked away afterward to brief a Cabinet Minister. This is clear interference in UK politcs and I would love to know what MIT think about it.
    0 0
  23. The site What's Up With That Watts? has a point by point dissection of a 2009 lecture by Richard Lindzen: Part 1, Part 2, Part 3.

    0 0
  24. Thanks for the plug Tom.

    I've just finished another one that's worth mentioning here:


    Saturday, March 8, 2014

    Howard Hayden’s one-letter disproof of global warming claims - examined

    http://whatsupwiththatwatts.blogspot.com/2014/03/hayden-disproves-global-warming-claims.html#more

    0 0

You need to be logged in to post a comment. Login via the left margin or if you're new, register here.


The Consensus Project Website

THE ESCALATOR

(free to republish)


© Copyright 2024 John Cook
Home | Translations | About Us | Privacy | Contact Us