


 Arguments


Sea level rise: coming to a place near you
Posted on 18 March 2011 by Daniel Bailey
It has been said that our coastal cities are but castles made of sand. And like sand, they will fall into the sea, eventually. No one can tell the day or the hour, but with the expected rise of sea levels from the warming of the world and the measured melt of its polar regions, we know that it will happen.

Figure 1 (Vermeer & Rahmstorf 2009). Current projections call for 1 or more meters of sea level rise by 2100
Currently we're on track to reach 1 meter sometime between 2070 and 2090 in business as usual (the A scenarios), and even most likely by 2100 in Scenario B1 (which assumes a major move away from fossil fuels toward alternative and renewable energy as the century progresses).
A wise man once asked:
"How many roads must a man walk down before you call him a man?
How many years must a mountain exist before it's washed to the sea?
How many times can a man turn his head pretending he just doesn't see?
How many deaths will it take till he knows too many people have died?
The answer my friend is blowin' in the wind..."
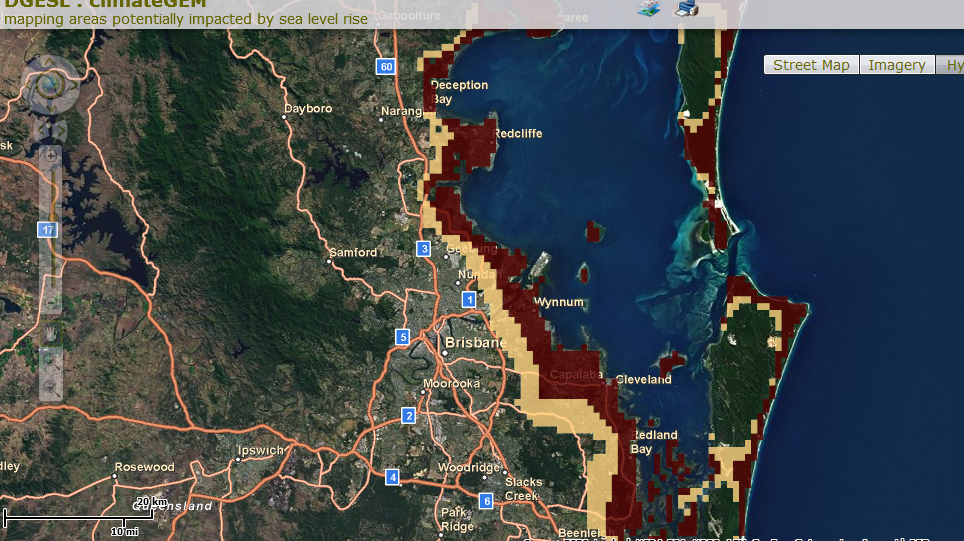
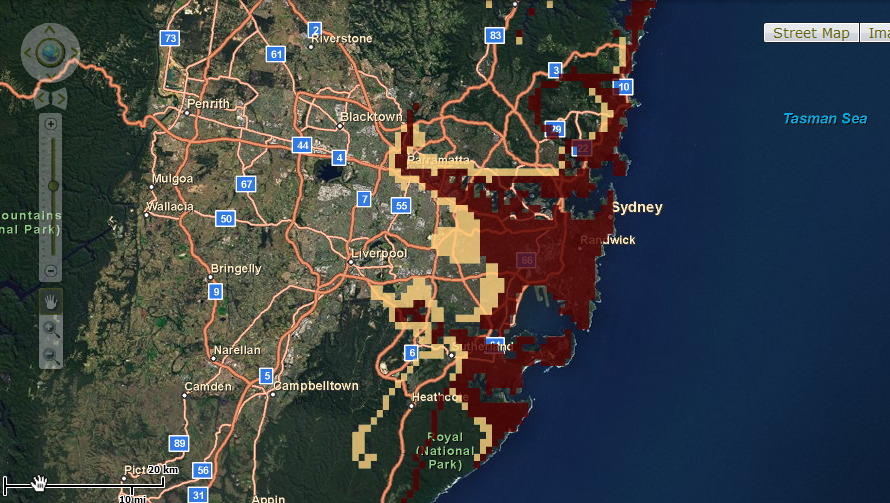
The effects of sea level rise, like the meaning of the song above, is different to each of us. So what will sea level rise look like where you live, when it does come? Using the map visualization tools provided from the Department of Geosciences at the University of Arizona, we can figure that out. Let's take a look, shall we?
America the Soggy
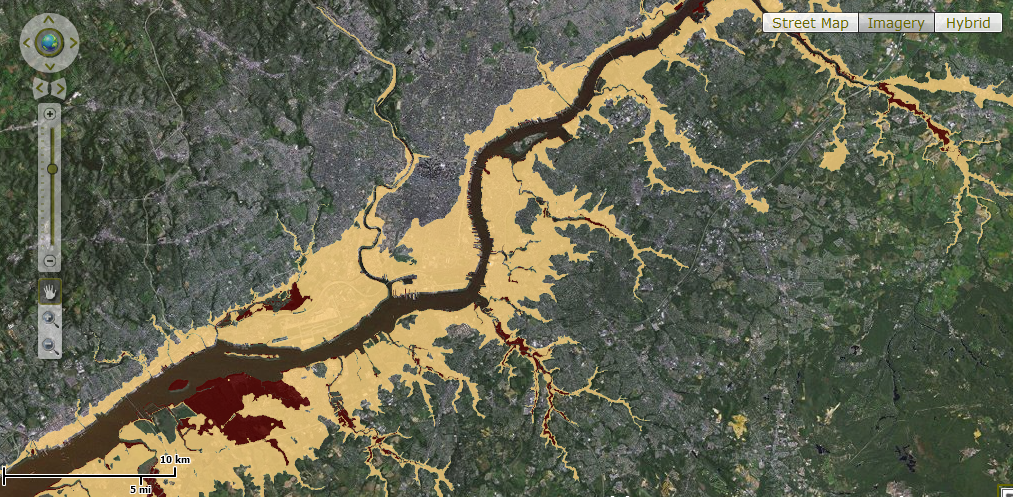
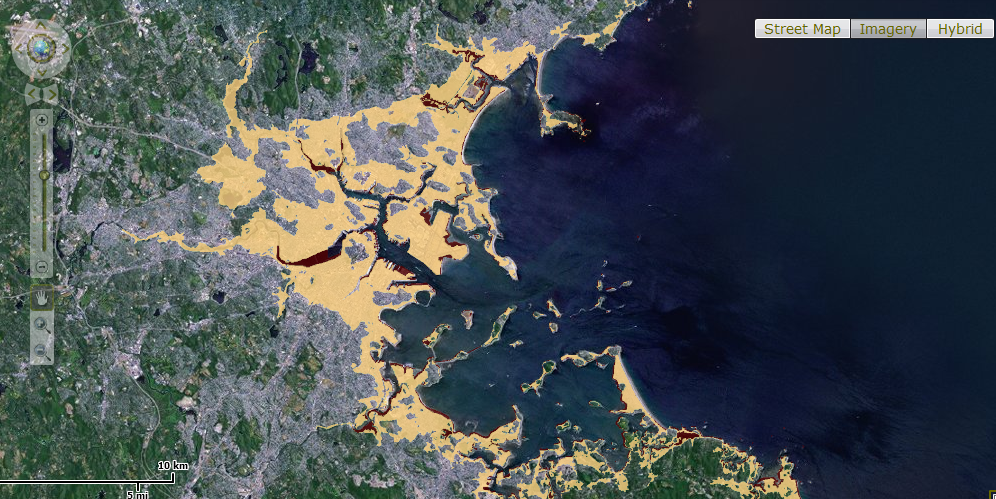
Portions of the United States stand to be hard-hit by sea level rise. None will be more impacted than New Orleans, Louisiana and Miami, Florida. Note that the areas in red delineate those inundated by the first meter of sea level rise, those in tan (sorry, didn't pick the colors) by an additional 5-meter rise in sea levels above and beyond the first meter of rise (for a total of 6 meters of rise).

Map 1. New Orleans This time, the story's over.

Map 2. Miami and south Florida. Our memories of South Beach will only come from reruns of Miami Vice.
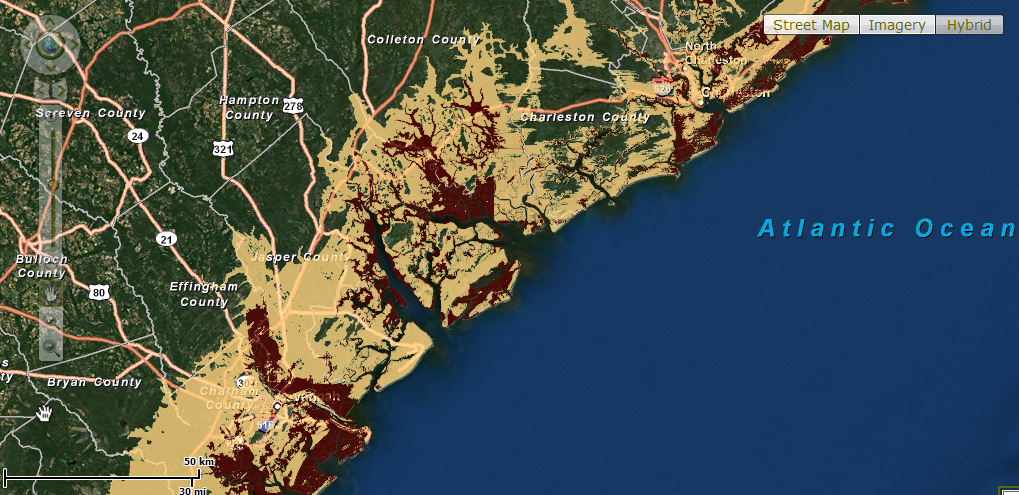
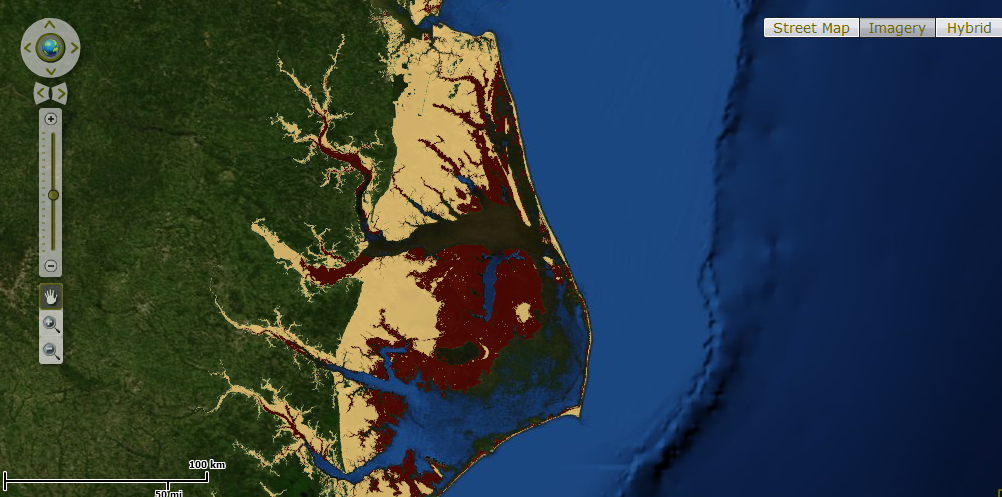
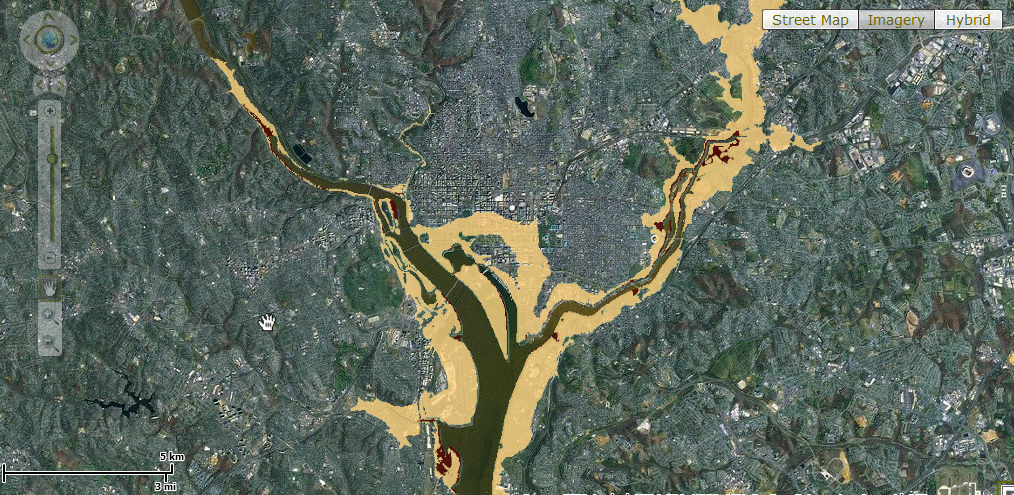
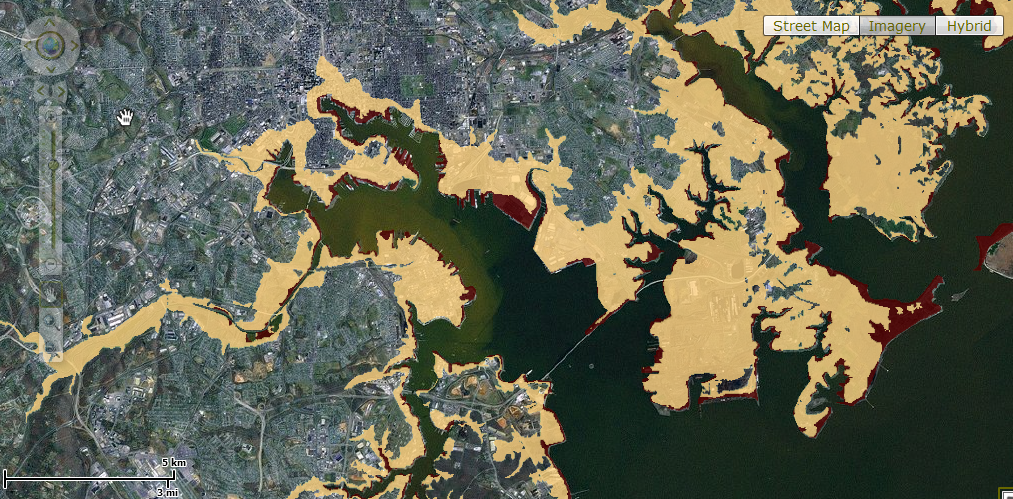
Moving up the Atlantic coast, other impacted areas include: Savannah - Charleston, Cape Hatteras, Washington DC (see below for the close-up of the Nation's Capital), Baltimore, Philadelphia, New York City and Boston.

Map 3. Washington DC (closeup). Yes, we did (it).
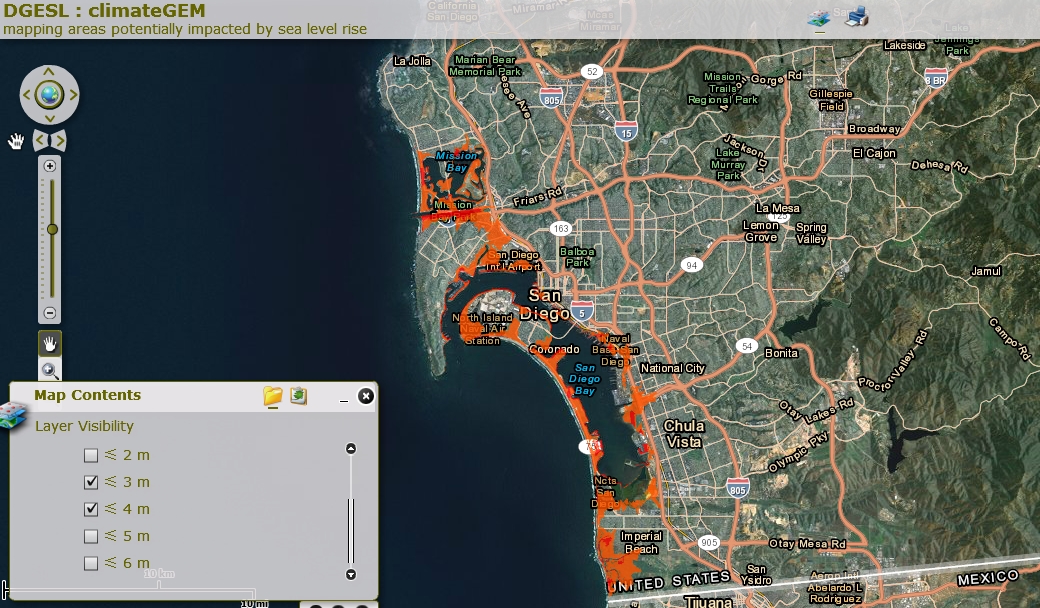
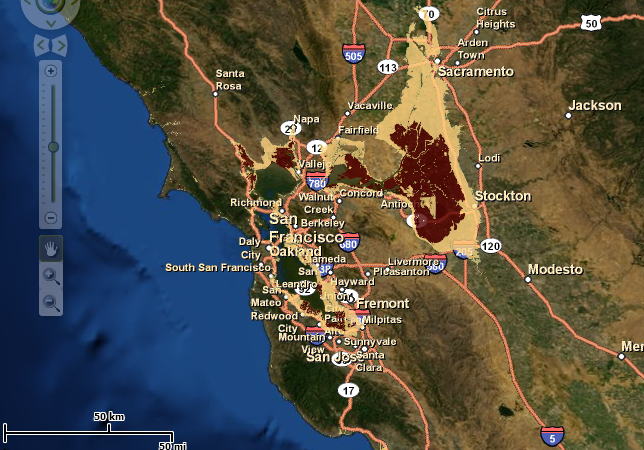
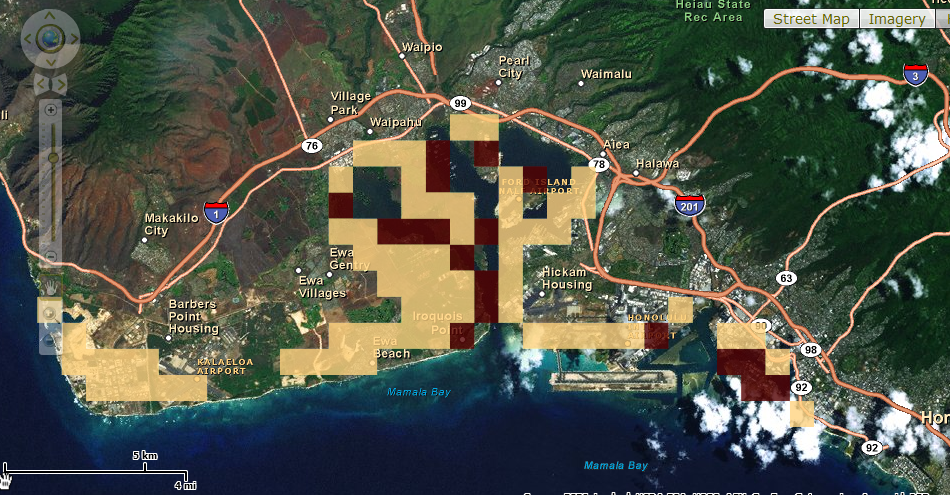
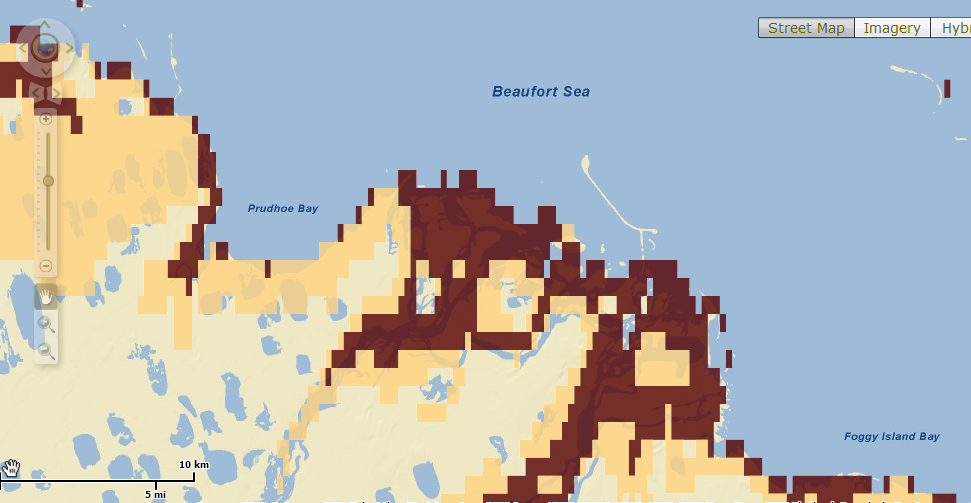
A look at the rest of the US: San Diego, San Francisco, Honolulu, and Prudhoe Bay of Alaska
Water World

Map 4. One meter of sea level rise wipes out the International Court at The Hague; 6 meters, most of the Netherlands.
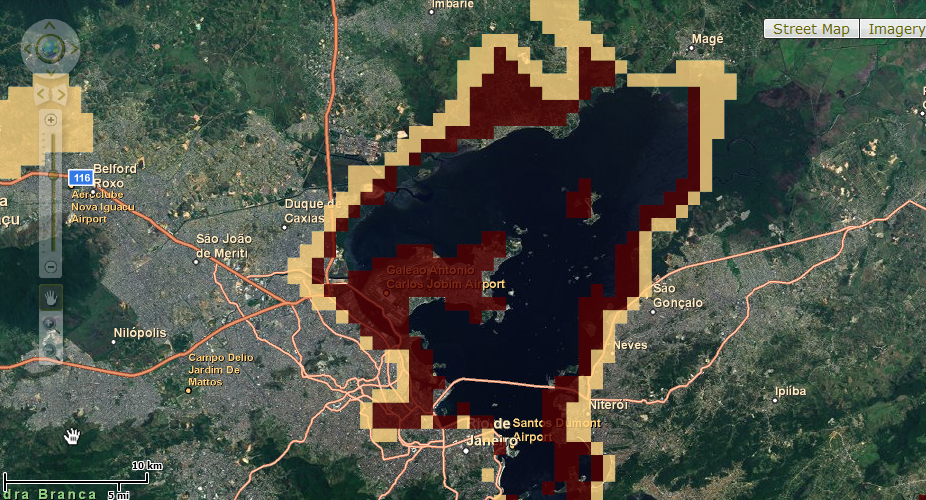
Brazil: Rio de Janeiro
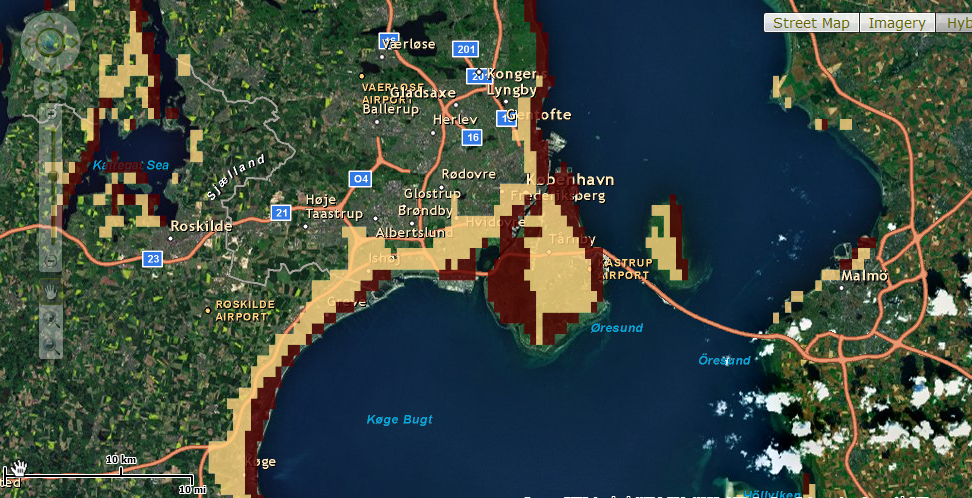
Denmark: Copenhagen
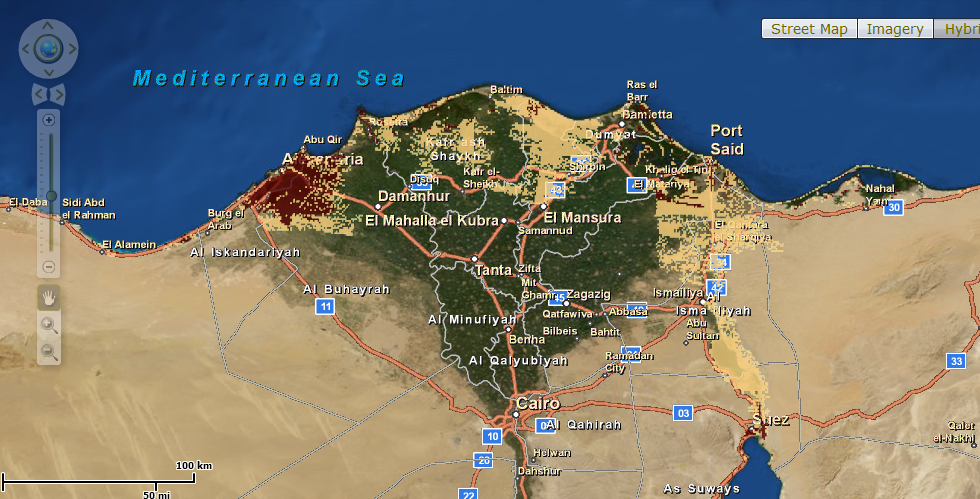
Egypt: Cairo
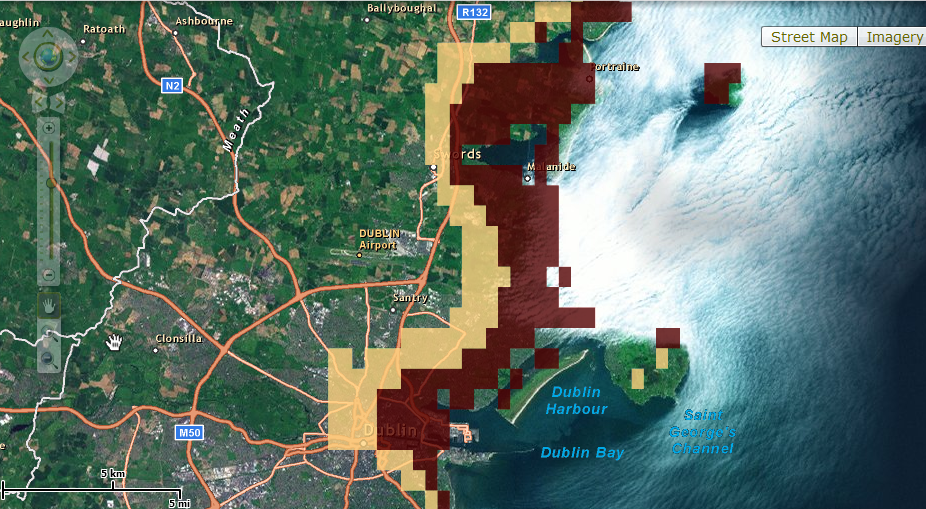
Ireland: Dublin
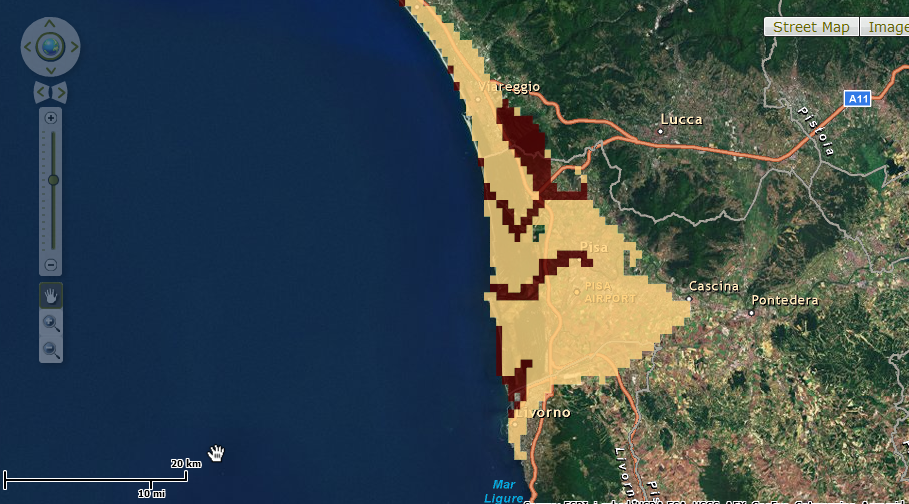
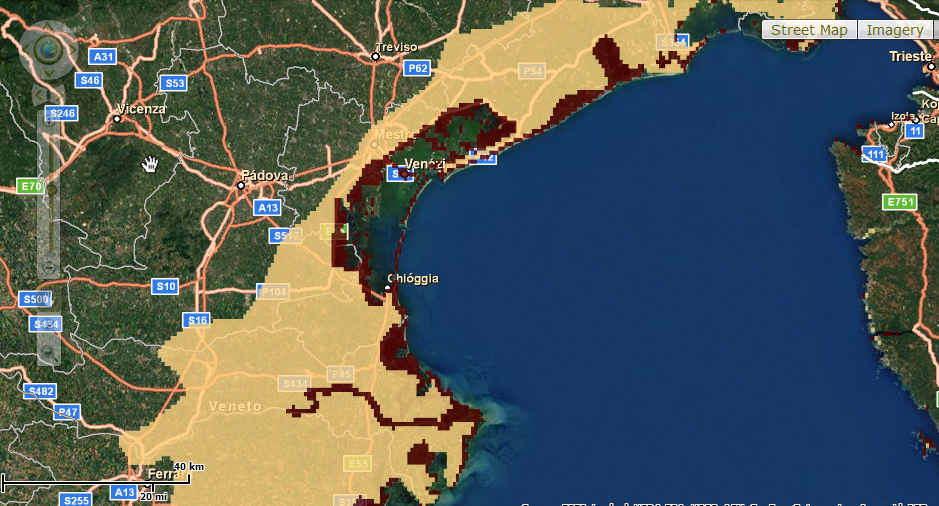
Italy: Pisa, Venice, downtown Venice
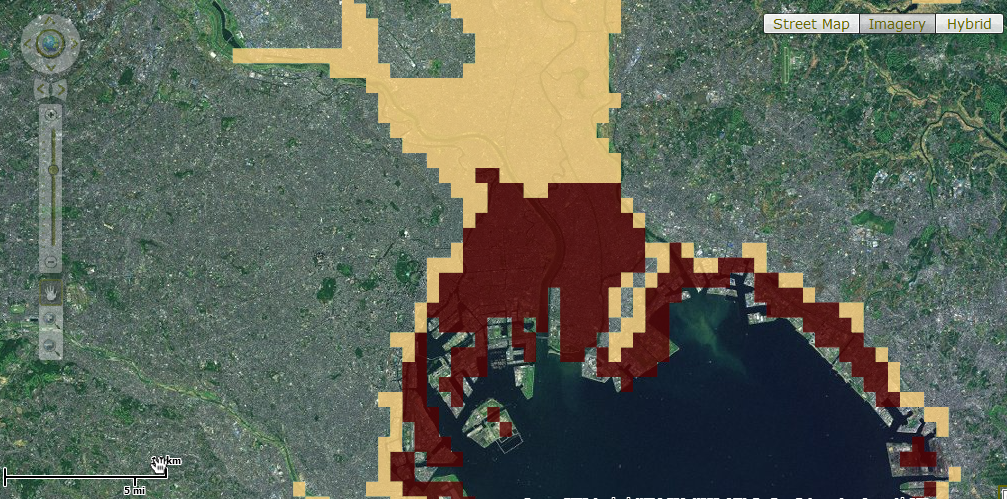
Japan: Tokyo, downtown Tokyo
New Zealand: Christchurch

Map 5. The poster child for sea level rise, the Maldives was once a vast island during the last glacial maximum, when sea levels were at their lowest ebb. Reduced now to but a string of island dots on a map, the Maldives will soon cease to be anything but a distant memory for our descendants. And a lasting testament to the willful folly of mankind.
We live now, in the present. Here in the present, sea level rise of the magnitudes portrayed above have yet to come to pass. But they will, eventually. Perhaps not in our lives but in that of those that yet live, or have yet to be. But come, it will.
And how many nations will cease to be before mankind acts? How many cities inundated? How many lives lost? The answer, my friends, is blowin' in the wind...


[DB] Rates of isostatic rebound experienced thus far will be dwarfed by the rates of SLR to get to the 1 meter SLR expected by 2100 (1,000mm over 90 years). Unless Hansen is right about the nonlinearity of ice sheet loss to come, in which case that rate jumps to 5,000mm over 90 years.
The current mapping tool does not reflect impacts from isostatic rebound; some future iteration will (it is being looked at).
it looks like there should be close to 5 cm/decade, but we are only measuring 3 cm/decade.
[DB] Sorry for that, Eric. I had to compromise with what to show or not show for the exact same reason. When I created the original files, I used cartographic license to decide the optimal scales to visually depict each area affected by SLR. Too small a resolution would have compromised many a picture.
Anyone can use the linked mapping program to look at any location in the world themselves (for those feeling left out because I didn't choose their city). It's actually pretty simple to use.