


 Arguments


More wind, bigger waves, changing marine ecosystems
Posted on 13 April 2011 by John Bruno
There has been lots of science and even more debate about how anthropogenic climate change will alter the frequency and intensity of cyclonic storms. But you don't hear much about how ocean wind and waves in general are changing and how this might impact marine ecosystems. Some new work is beginning to address this important topic.
Lets start with the physical changes.
A paper recently published in ScienceExpress (Young et al 2011) reports that ocean wind and waves increased substantially over the last two and a half decades. The authors used satellite altimeter measurements to test for trends in wave height from 1985 to 2008 and wind speed from 1991 to 2008. There was a positive trend in average wind speed and wave height, especially at higher latitudes (note the weaker trends in equatorial regions are not statistically significant):
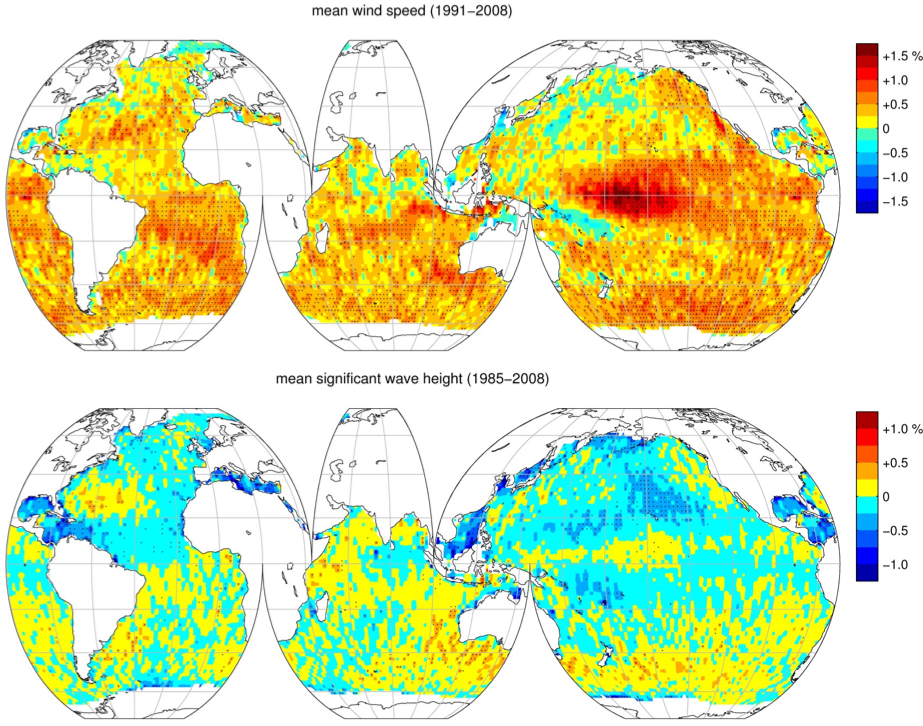
Fig. 1. Colour contour plots of mean trend (% per year). Wind speed is shown at the top and wave height at the bottom. From Young et al 2011.
The change in significant wave height is more pronounced when you look at the 99 percentile (the very biggest waves):
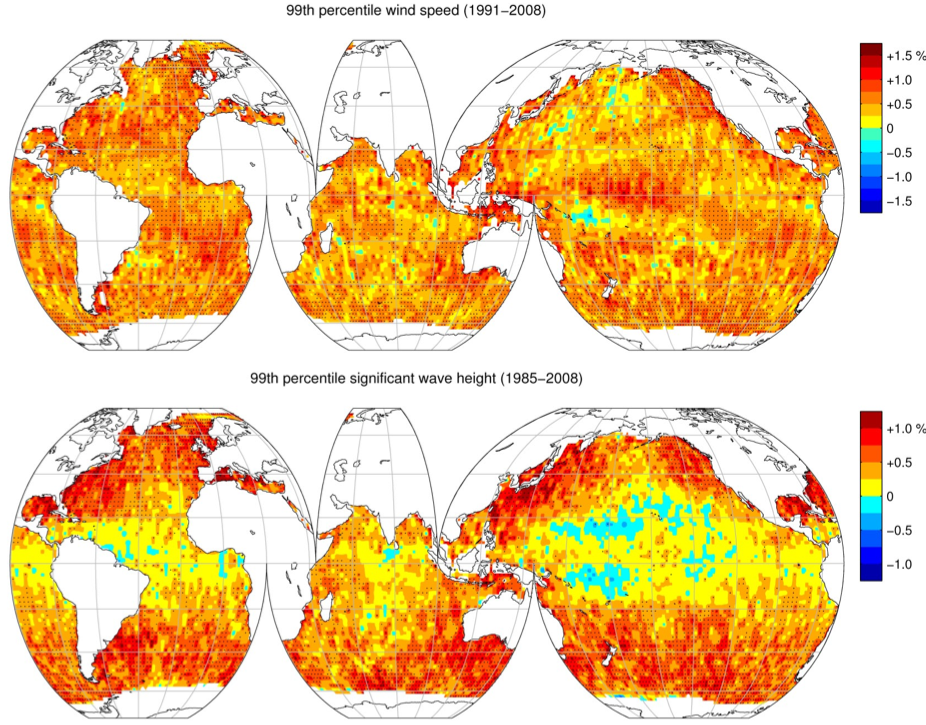
Fig 2. Colour contour plots of the 99th percentile trend (% per year). Wind speed is shown at the top and wave height at the bottom. From Fig. 3 in Young et al 2011.
The Young et al study mirrors a number of smaller scale studies based on more direct measurements or estimates of wave height trends. For example, Bromirski et al. (2003) used tide gage data from San Francisco to assess "meteorologically forced nontide residuals" (NTR), ie, ‘‘storminess’’ from 1858 to 2000 along the central california coast. They found an increase of both degree and duration since 1950, consistent with other local and regional studies:
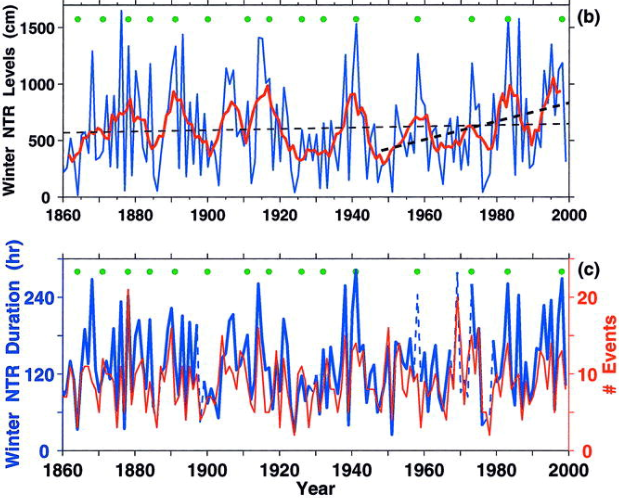
Fig. 3. (b) Cumulative extreme NTR (exceeding the 98th percentile level of 11.5 cm for the entire hourly NTR time series) during winter months (Dec–Mar), with its 5-yr running mean (red line). Least squares trend estimates for the entire winter record and since 1948 (dashed lines). (c) Cumulative extreme winter hours (blue line) and events (red line). Dashed blue line indicates less than 90% of the hourly data were available, indicating that these periods may be underestimated. Times of strong, moderately strong, and very strong El Ninos (Quinn and Neal 1987) are indicated by green dots. From Fig. 6 in Bromirski et al. (2003).
So, the picture emerging from the complete scientific body of evidence is that wave height, wind and "storminess" have been increasing at sea and along the coasts over the last several decades, at least in non-tropical regions. Although in some cases the record is fairly long (for direct physical measurements), it isn't really long enough to strongly attribute these changes to ACC. Furthermore, predicting changes in mid-latitude or "extra-tropical" storms (such as would have been measured in the Bromirski et al study) is tricky. But regardless of the cause, why should we care?
One reason is that by impacting habitat-forming "foundation" species, physical disturbance, especially by waves, plays a hugely important role in structuring coastal marine communities. For example, Byrnes et al (2011) just published a paper that assessed how changes in the frequency of coastal storms would affect kelp forest communities off of the central California coast.
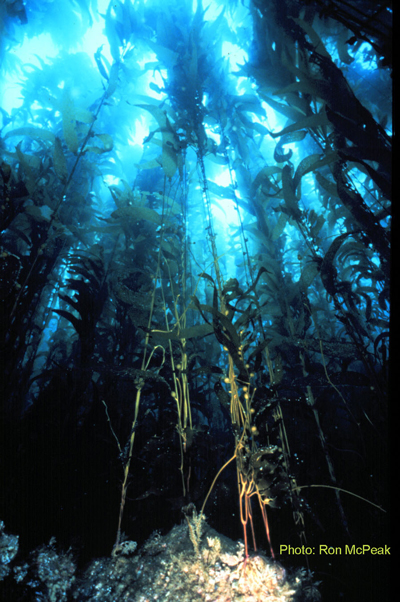
Giant kelp (Macrocystis pyrifera) are the "foundation species" of the California kelp forest communities. This species creates the biotic structure that thousands of other organisms depend on. Other examples of marine foundation species are corals, oysters, seagrasses and mangroves. Trees are a great terrestrial example. Due to their size, foundation species are often susceptible to physical disturbances, such as waves, that can dislodge and remove them.
The authors used structural equation modeling (SEM) to statistically relate the impacts of storms on kelp forest community structure (ie, in situ measurements of invertebrate species richness, kelp cover, fish abundance, etc. collected with SCUBA by the Santa Barbara coastal LTER). They also compared the predictions of the SEM (depicted in Fig. 4) with the effects of experimental kelp removal (from 2000 m2 plots!) on kelp forest communities. The SEM and the experimental manipulation both found that decreased kelp cover leads to a decrease in the diversity and complexity of kelp forest food webs.
If large storms remain at their current annual frequency (roughly one major kelp-removing storm every 3.5 years), periodic storms help maintain the complexity of kelp forest food webs. However, if large storms increase in annual frequency and begin to occur year after year, kelp forest food webs become less diverse and complex as species go locally extinct. The loss of complexity occurs primarily due to decreases in the diversity and complexity of higher trophic levels. Our findings demonstrate that shifts in climate-driven disturbances that affect foundation species are likely to have impacts that cascade through entire ecosystems.
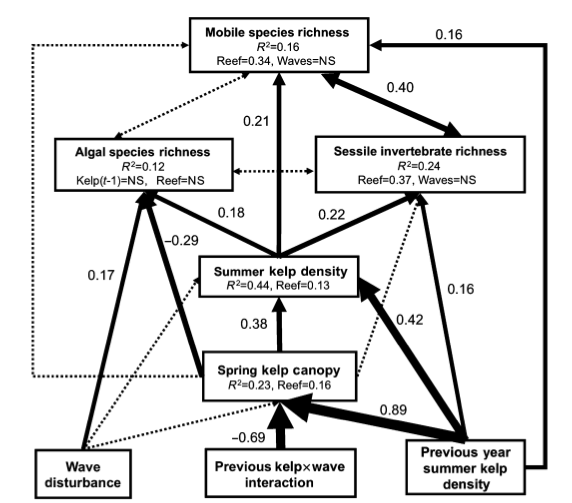
Fig. 4. Path diagrams showing how algal, sessile invertebrate, and mobile species richness are associated with winter wave disturbance from storms and the abundance of kelp in the past year. Results are from a fitted structural equation model that adequately reproduces the observed covariance matrix. Solid paths are statistically different from 0 at P 0.05. Dashed paths are not. Path widths are proportional to standardized regression coefficients (shown next to each path). For clarity, some path coefficients are included in variable boxes rather than being drawn directly on the diagram. From Fig. 4 in Byrnes et al (2011).
Countless studies have investigated/documented the impacts of storms and other physical disturbances on kelp and many other marine foundation species. The effects are not always negative; a moderate level of disturbance can help maintain the diversity of foundation species and of community inhabitants by preventing competitively dominant species from excluding their neighbors (via the monopolization of resources) and by maintaining a "patch mosaic" of microhabitats that promotes diversity.
One novel aspect of this work, in addition to combining a field manipulation with a statistical data-crunching approach, was the focus on the entire food web rather than just one trophic level. Yet this study builds on decades of work indicating how sensitive coastal communities are to intense disturbances. If storms, wind and waves are causally linked with ACC and do continue to increase, I think there is little question that we will see direct effects on marine ecosystems and the services they provide to people.
Beyond that, you could imagine a variety of other ecological and socioeconomic impacts of increased ocean wind, waves and storminess. For one, this could result in more ocean mixing and less stratification, thereby enhancing primary production (by supplying more nutrients for phytoplankton in generally nutrient-poor surface waters). You might also expect greater coastal erosion (which is compounded by sea level rise) and effects on shipping, ocean oil refineries, wind farms, etc.
Ocean winds are not exactly the first thing you think about when the topic of climate change comes up. Yet if they do continue to increase, the knock on effects will be large and costly. Yet another reason I like to call it "Ocean Change" rather than "Climate Change".
Be sure to check out SeaMonster for more news about the oceans including impacts of climate change on ocean critters.


 0
0  0
0


Comments