


 Arguments


Esper Millennial Cooling in Context
Posted on 21 July 2012 by dana1981
A new paper in Nature Climate Change from Esper et al. (2012) develops a 2,000-year local summer temperature reconstruction based on 587 high-precision maximum latewood density (MXD) tree ring series from northern Scandinavia, using living and subfossil pine trees from 14 lakes and 3 lakeshore sites in the region (>65° N). The results are shown in Figure 1.
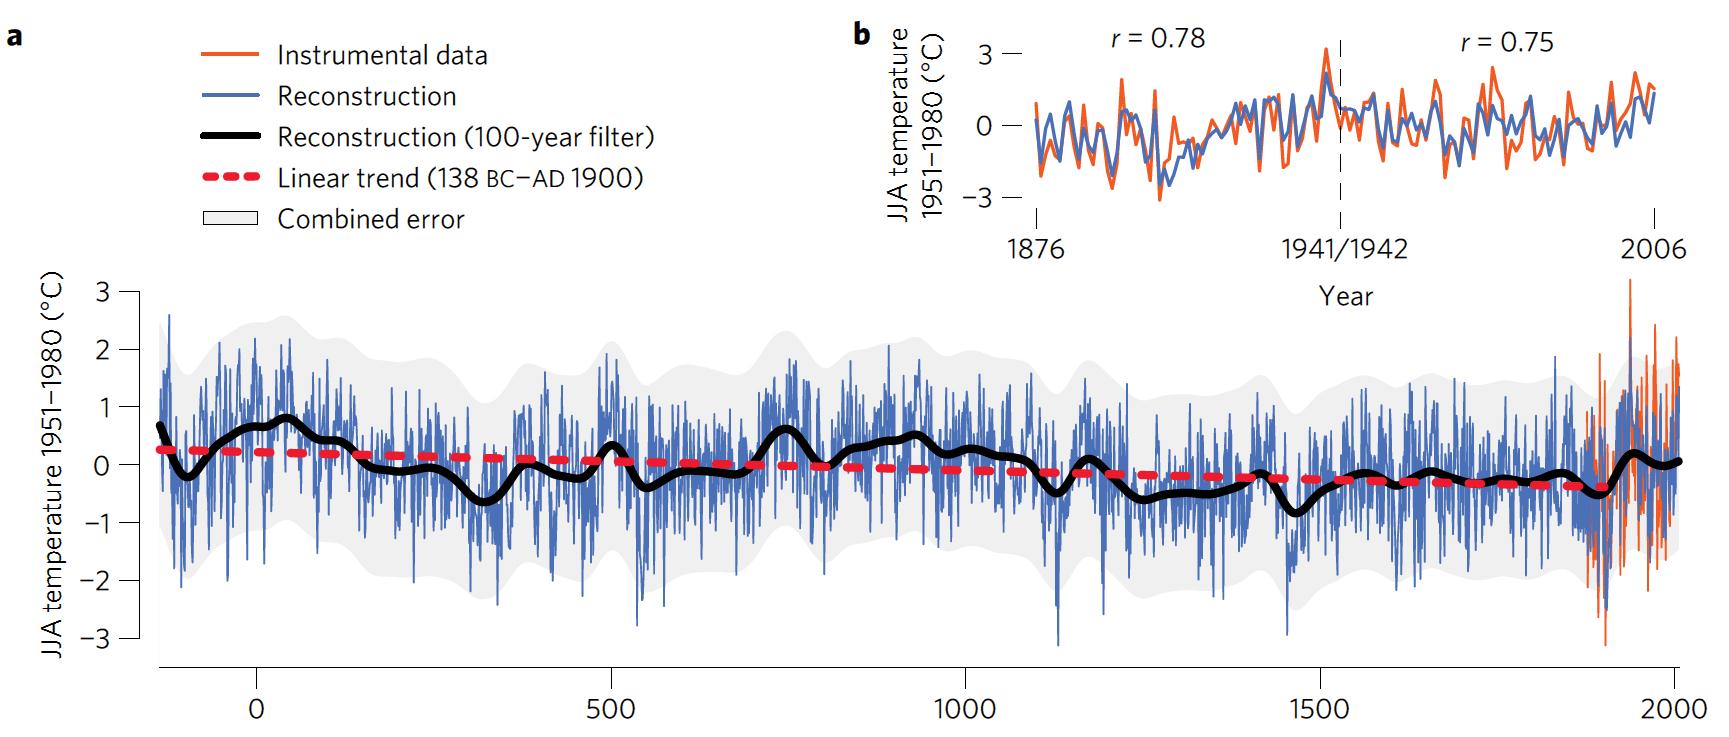
Figure 1a: The Scandanavian summer temperature reconstruction extends back to 138 BC highlighting extreme cool and warm summers (blue curve), cool and warm periods on decadal to centennial scales (black curve, 100-year spline filter) and a long-term cooling trend (dashed red curve; linear regression fit to the reconstruction over the 138 BC–AD 1900 period). Estimation of uncertainty of the reconstruction (grey area) integrates the validation standard error (±2 × root mean square error) and bootstrap confidence estimates. Figure 1b: Regression of the MXD chronology (blue curve) against summer temperatures (red curve) over the 1876–2006 common period. Correlations between MXD and instrumental data are 0.77 (full period), 0.78 (1876–1941 period), and 0.75 (1942–2006 period). Figure 2 from Esper et al. (2012)
The reaction from climate contrarians in the popular media has been predictable; for example, they have made various outlandish claims about the study somehow debunking global warming and suggested that other climate scientists will have to "poo-poo" the results of Esper et al. Unfortunately, Jan Esper himself fueled this climate contrarian confusion by exaggerating the impact of his study's results in a press release, where he proclaimed:
"Our results suggest that the large-scale climate reconstruction shown by the Intergovernmental Panel on Climate Change (IPCC) likely underestimate this long-term cooling trend over the past few millennia."
However, as we discuss below, this conclusion does not follow from Esper et al. (2012) for several key reasons.
Putting Esper et al. in Proper Context
Most importantly, as noted above, the Esper et al. temperature reconstruction is a local one (from northern Scandanavia), and of summer temperatures. The IPCC on the other hand focused on annual Northern Hemisphere temperature reconstructions; thus the Esper et al. results are not directly comparable to those discussed in the IPCC report.
In another Arctic regional temperature study, Kaufmann et al. (2009) discussed the same Arctic summer cooling over the past several millennia noted by Esper et al., which they find is primarily due to the Earth's elliptical orbit:
"The millennial-scale cooling trend in our temperature reconstruction correlates with the reduction in summer insolation, which was primarily driven by the precession of the solstices around Earth’s elliptical orbit. Over the past 2000 years, summer (JJA) insolation at the top of the atmosphere decreased by about 6 W m−2 at 65°N. The forcing was weaker at lower latitude, especially for the early summer."
Kaufmann et al. suggested that a decrease in incoming solar radiation in the Arctic due to the Earth's orbital changes was amplified by various feedbacks like expanding Arctic sea ice and increased snowfall, both of which increase the local surface albedo, reflecting more sunlight and causing additional cooling.
In fact, Esper et al. note that the orbital forcing and feedbacks identified by Kaufmann et al. are a key difference between Arctic and Northern Hemisphere temperatures:
"the [orbital] forcing and radiative feedbacks decrease towards equatorial regions."
As noted by the climate scientists at RealClimate,
"insolation forcing is near zero at tropical latitudes, and long-term cooling trends are not seen in non-tree ring, tropical terrestrial proxy records such as the Lake Tanganyika (tropical East Africa) record (Tierney et al, 2010)"

Figure 2: Lake Surface Temperature from Lake Tanganyika palaeorecord for the past 1,500 years, measured in core KH1 (red line) and MC1 (dark red line) with 95% error bars (orange shading).
Thus we should expect annual Northern Hemisphere reconstructions - which include data from both the Arctic and equatorial regions - to exhibit less of an orbitally-caused cooling trend than reconstructions of summer Arctic temperatures like those in the Kaufmann and Esper studies. In an interview with Bud Ward, one of the co-authors of Esper et al., Robert Wilson noted:
"Our paper is for northern Scandinavian summer temperatures so extrapolating to large scale annual temperatures is not really correct."
Esper's Divergence Non-Problem
As the RealClimate post also notes, perhaps the most useful contribution of Esper et al. lies in the fact that they may have resolved the so-called "divergence problem." This refers to the fact that in some tree rings, mostly from high northern latitudes like those examined by Esper et al., temperatures appear to have declined since about 1960, whereas we know from thermometer measurements that real-world temperatures have actually increased over this period. However, the MXD data in Esper et al. appear to track instrumental temperatures quite well even in recent decades, as illustrated in Figure 1b above. Note the strong correlations between MXD and instrumental temperature data in the Figure 1b caption.
MXD vs. TRW
Esper's claims that he has identified a shortcoming in Northern Hemisphere millennial temperature reconstructions stem from the fact that tree ring width (TRW) temperature reconstructions exhibit less of a long-term cooling trend than their maximum latewood density (MXD) reconstruction. Thus Esper suggests that including TRW data will lead to an underestimate of the long-term Northern Hemisphere cooling trend.
However, the RealClimate post notes that this hypothesis is not borne out in the data. For example, Moberg et al. (2005) created a Northern Hemisphere millennial temperature reconstruction without using any tree ring data, and it has among the smallest long-term cooling trends of all such reconstructions (just -0.06°C per millennium from 0 to 1900 AD, as opposed to the -0.31°C per millennium trend in Esper et al.). The long-term annual Northern Hemisphere cooling trends in Ljungqvist et al. (2010) (-0.18°C per millennium from 0 to 1900 AD) and Mann et al. (2008) (-0.19°C per millennium from 300 to 1900 AD) are similar to but less than the summer northern latitude trend in Esper et al., as we would expect.
Another Hockey Own Goal
There is a key point that often gets lost in discussions about 'hockey sticks' - larger long-term natural variability is inconsistent with a low climate sensitivity. Low climate sensitivity is the lynchpin for all climate contrarianism; therefore, arguing for a highly variable climate is a contrarian own goal (meaning they accidentally score against their own team).
Climate contrarians tend to tie themselves up in knots trying to argue that the hockey stick is broken and the Medieval Warm Period was warmer than today. We'd be better off if temperatures were relatively stable and invariable as in the original 1999 'hockey stick,' which would indicate that the climate is relatively insensitive to CO2 and other forcings, which in turn would suggest that we have relatively more time to reduce our greenhouse gas emissions before we're hit by the really nasty consequences of climate change.
We also need to bear in mind that the relative absolute global temperatures of Medieval and Roman times as compared to current temperatures are not all that important. In all likelihood we have already matched or exceeded the peak average global temperature during those prior periods, but far more important is the current rate of warming, which greatly exceeds anything in the prior several thousand years. Even if we hadn't quite yet matched peak Medieval temperatures, we would certainly blow past them very soon, with several degrees more global warming likely to come this century. Current temperatures are not the concern - everybody involved would be happy if we could maintain the current average global temperature. It's the rapid rate of warming that concerns climate scientists.
Esper et al. - A Valuable but Overstated Contribution
In the end, Esper et al. did produce a valuable result by potentially resolving the divergence problem and identifying the apparent shortcomings of TRW data. However, it's also important not to overstate the relevance of the study's results, which do not appear to have identified any significant shortcomings in annual Northern Hemisphere millennial temperature reconstructions, and certainly have not undermined the robust human-caused global warming theory.


 0
0  0
0


Comments