


 Arguments


Did bombing during second world war cool global temperatures?
Posted on 21 November 2018 by Guest Author
This is a re-post from Carbon Brief
Prof Alan Robock is a distinguished professor of climate science in the Department of Environmental Sciences at Rutgers University in New Jersey, US.
Between 3 February and 9 August 1945 during the second world war, an area of 461 square kilometres in 69 Japanese cities was burned by US bombing raids. This included the nuclear bombs dropped on the cities of Hiroshima and Nagasaki.
The resulting fires saw plumes of thick, dark smoke rise high into the atmosphere. Much like the cloud and ash thrown into the air by volcanic eruptions, this soot had the potential to block out incoming sunlight, cooling the Earth’s surface.
In a recent paper, published in Journal of Geophysical Research: Atmospheres, we investigate whether the smoke from these fires was enough to change global temperatures.
Nuclear winter
I’ve been working on the threat of nuclear winter for 35 years now. In the 1980s, using simple climate models, we discovered that global nuclear arsenals, if used on cities and industrial areas, could produce a nuclear winter and lead to global famine.
Smoke from the fires would last for years in the upper atmosphere, blocking sunlight, and making it cold, dark and dry at the Earth’s surface. It would also destroy ozone, enhancing ultraviolet radiation reaching the surface.
While the immediate effects of nuclear strikes might kill hundreds of thousands, the numbers that would die from starvation in the years that followed could run into billions.
Normally scientists test their theories in a laboratory or with real world observations. Fortunately, we do not have a global nuclear war to examine. So how can we test nuclear winter theory?
One option is to look at the impact of forest fires. Large wildfires have been observed to pump smoke into the upper atmosphere – the stratosphere – above where rain can wash it out, and then be further lofted by solar heating. Such was the case with a massive fire in British Columbia in August 2017.
We also have many examples of cities that have burned in the past. Accidental fires burned numerous cities, such as London in 1666, Chicago in 1871 and San Francisco in 1906.
But while we don’t have a global nuclear war to study, we do have two cases where nuclear weapons were deployed – Hiroshima and Nagasaki during the second world war.
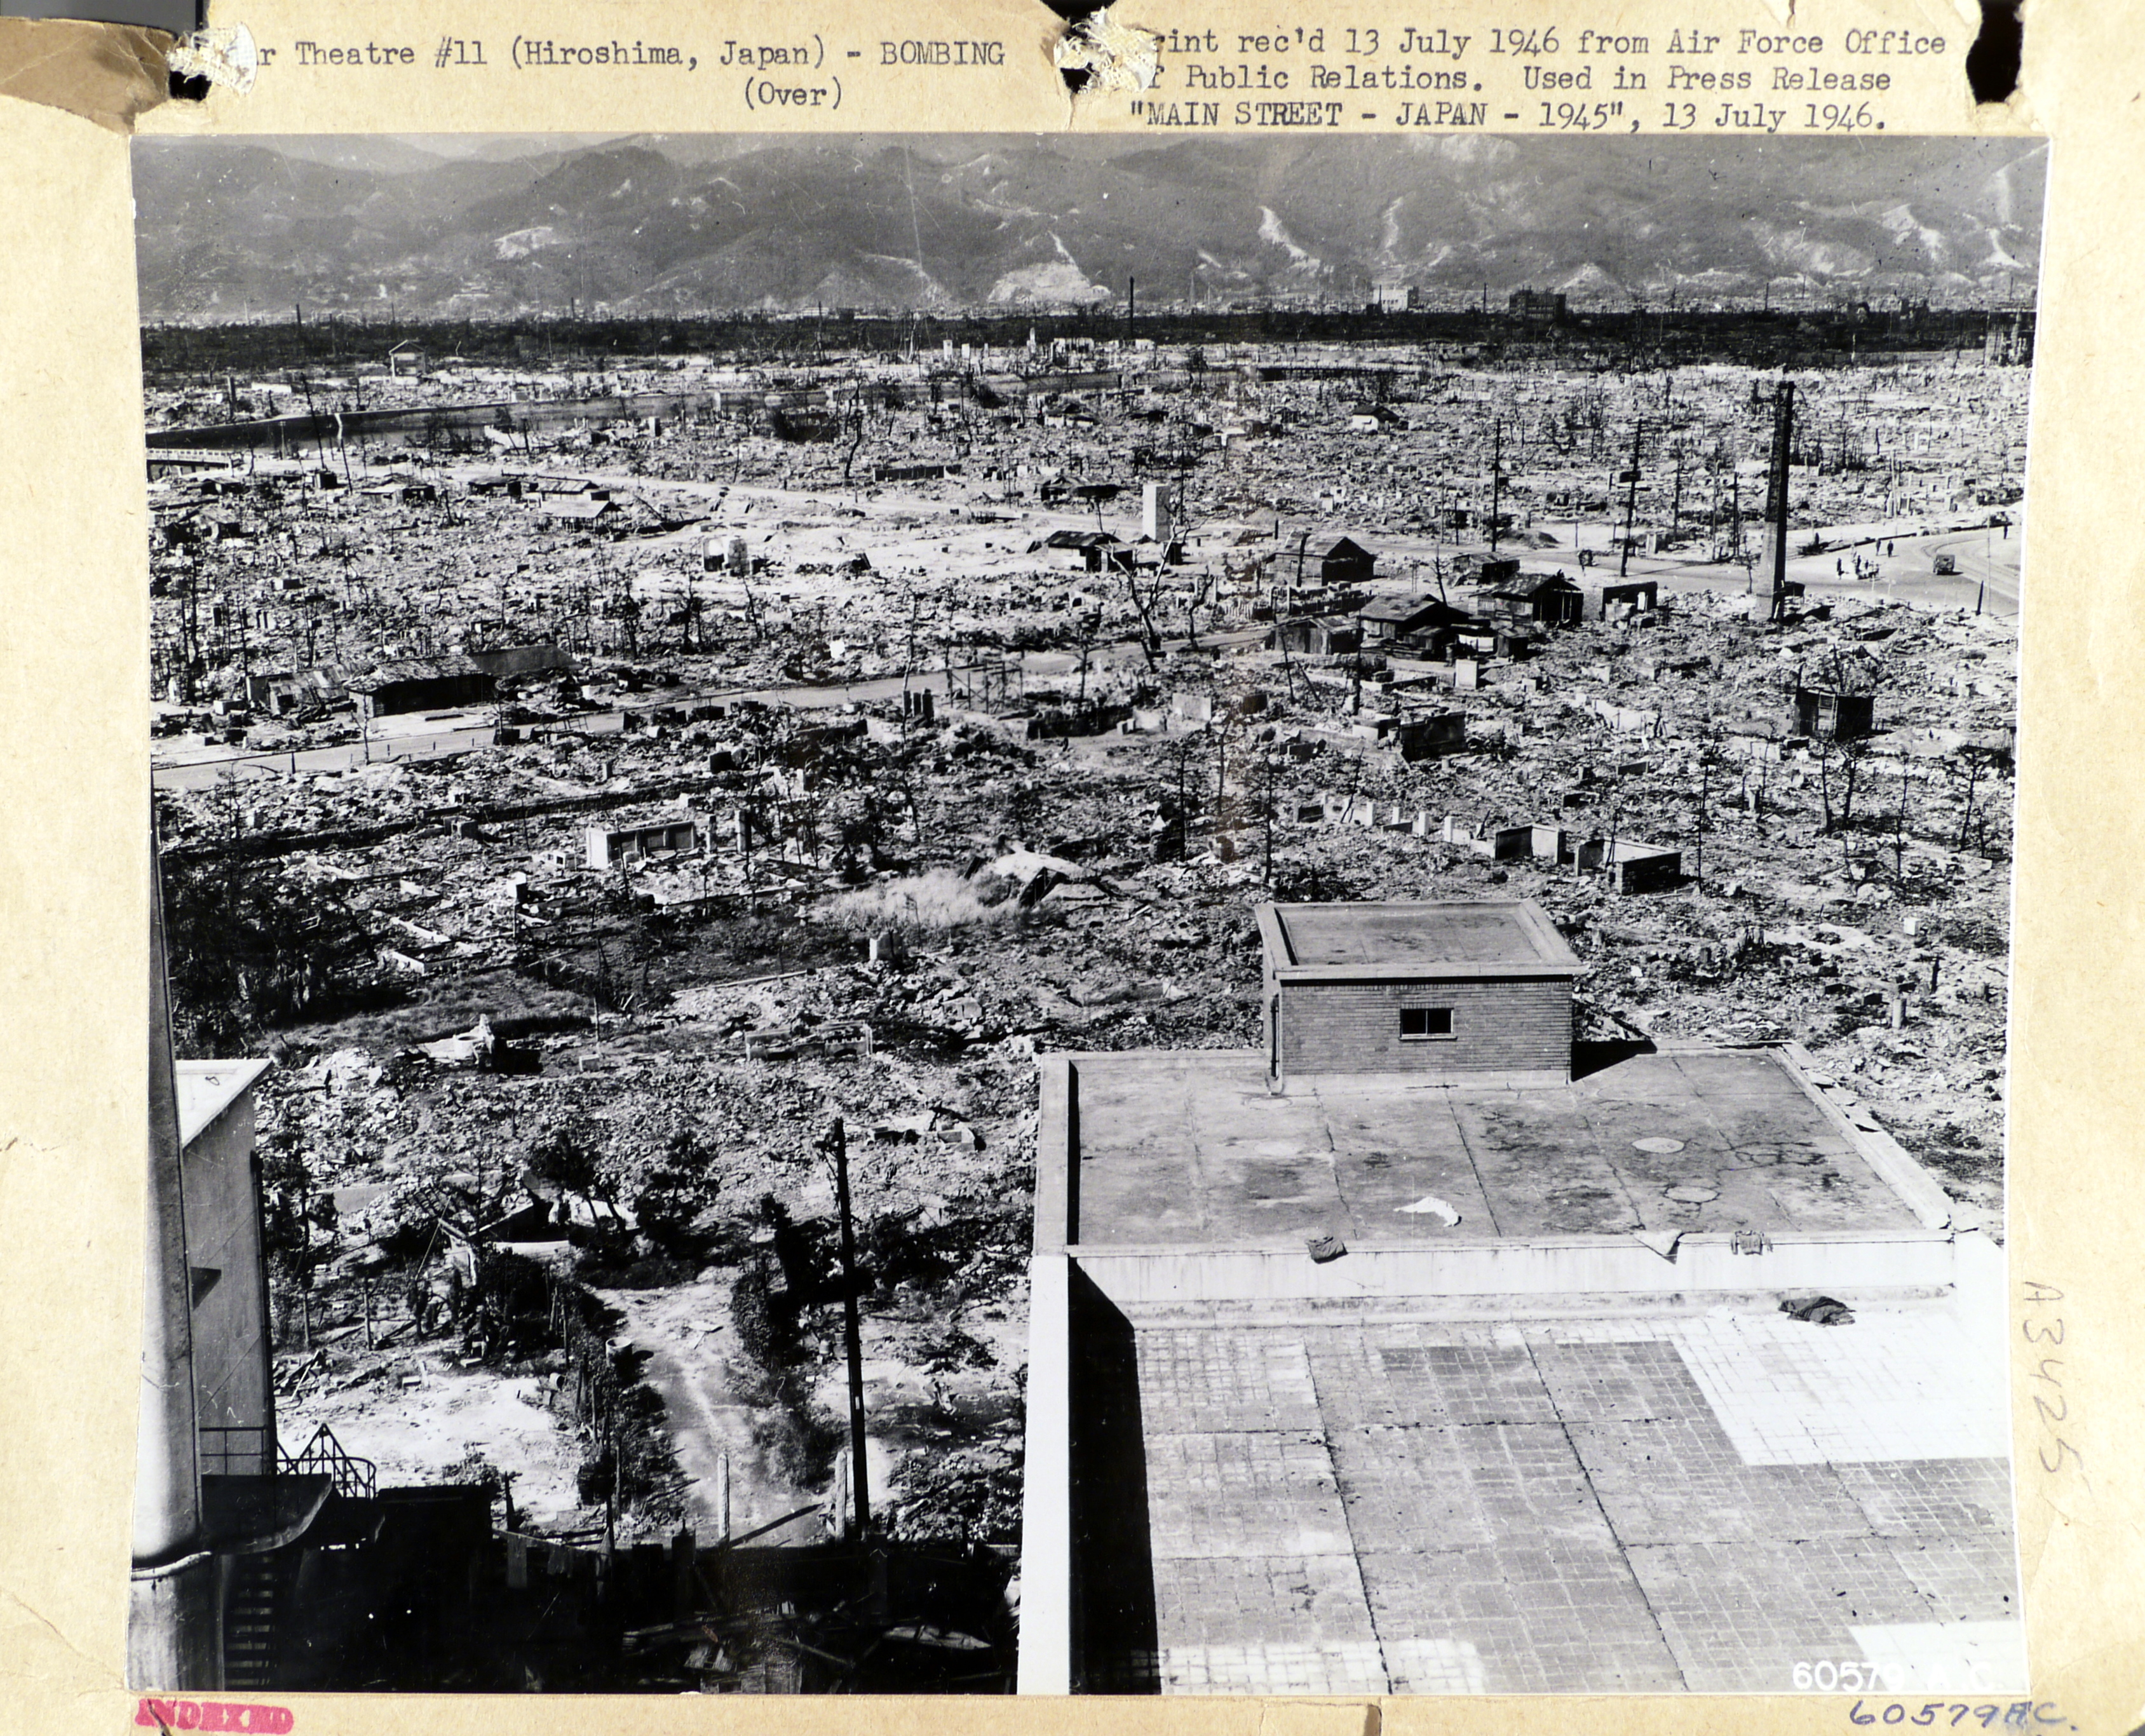
Photo of Main Street, Hiroshima. Taken on 13 July 1946 in Hiroshima. Credit: National Archives, RG-342-FH-60579AC, from www.japanairaids.org
Temperature drop
While the atomic bombs dropped on Hiroshima and Nagasaki – on 6 and 9 August 1945, respectively – have gone down in history as the first use of nuclear weapons in warfare, what is less well known is that they were part of a larger bombing campaign by US B-29 Superfortress bombers.
Between 3 February and 9 August 1945, an area of 461sq kilometers in 69 Japanese cities, including Hiroshima and Nagasaki, was burned during these air raids – killing 800,000 civilians. The smoke produced by Hiroshima and Nagasaki made up less than 5% of the total.
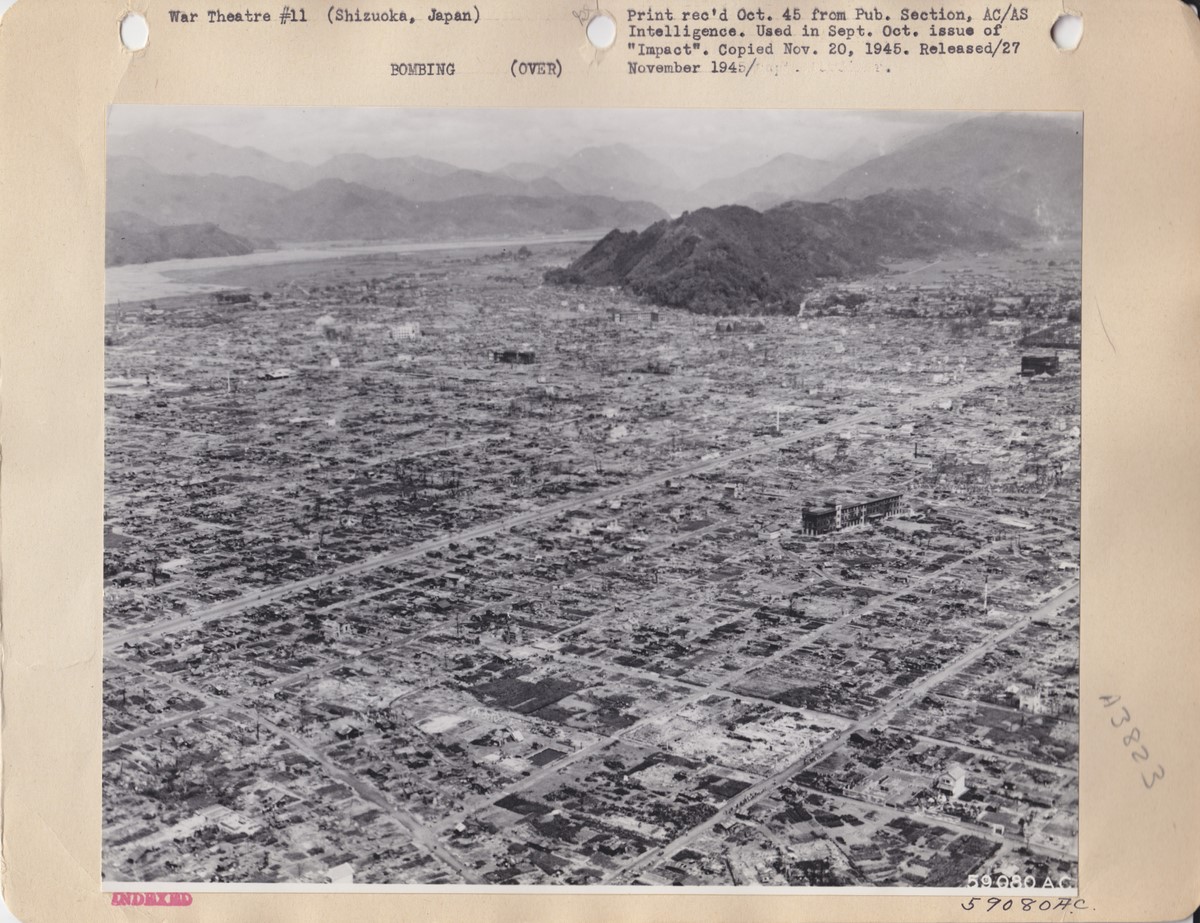
Part of Shizuoka after it was bombed on 19 June 1945. Credit: National Archives, RG-342-FH-59080AC, from www.japanairaids.org
In our study, we calculated how much smoke was emitted based on estimates for the area burned by fires, the amount of fuel, how much soot was emitted into the upper troposphere and lower stratosphere, and how much was washed out by rain.
We then estimated the impact on the climate using observed records of solar irradiance – i.e. the amount of the sun’s energy that reaches the Earth’s surface – and land surface temperature. Fortunately, the Smithsonian Astrophysical Observatory maintained two long-term records for solar irradiance – at Mount Montezuma in Chile and on Table Mountain in California, US – so there are data available.
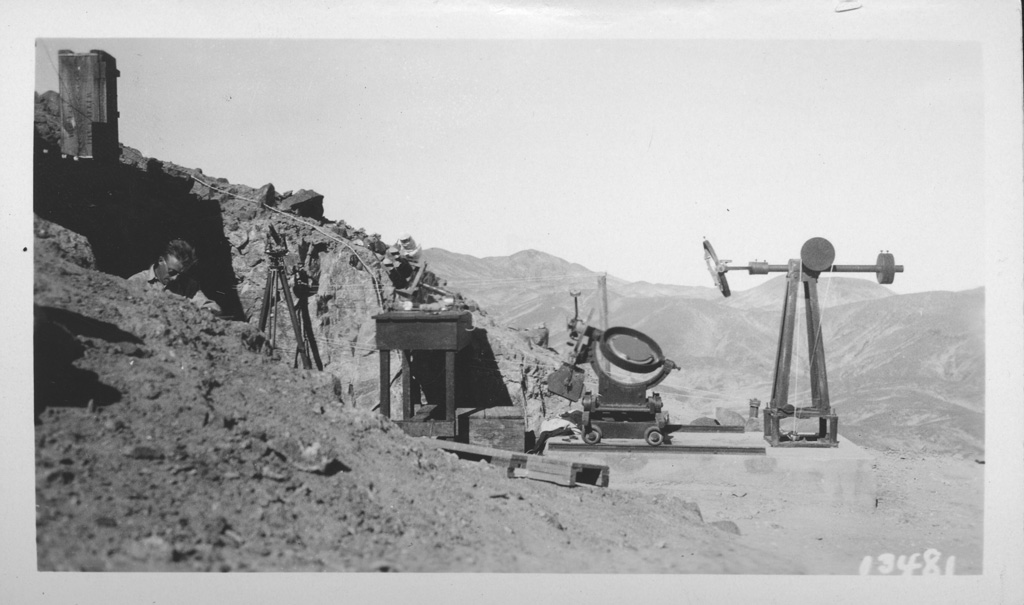
The solar irradiance observatory at Mt. Montezuma, Chile. Credit: Smithsonian Institution Archives, Record Unit 7005, Box 187, Folder: 9, Image #2003-19480.
For global land surface temperature records, we used GISTEMP from NASA and CRUTEM from the Met Office Hadley Centre and the Climatic Research Unit at the University of East Anglia.
The chart below shows the land temperatures during the 1940s and 1950s for CRUTEM (yellow) and GISTEMP (green) as anomalies from the 1940-44 average. Both temperature records show a drop in global temperature (left-hand chart) in 1945 of around 0.1C and in northern hemisphere (right) temperature of 0.2C.
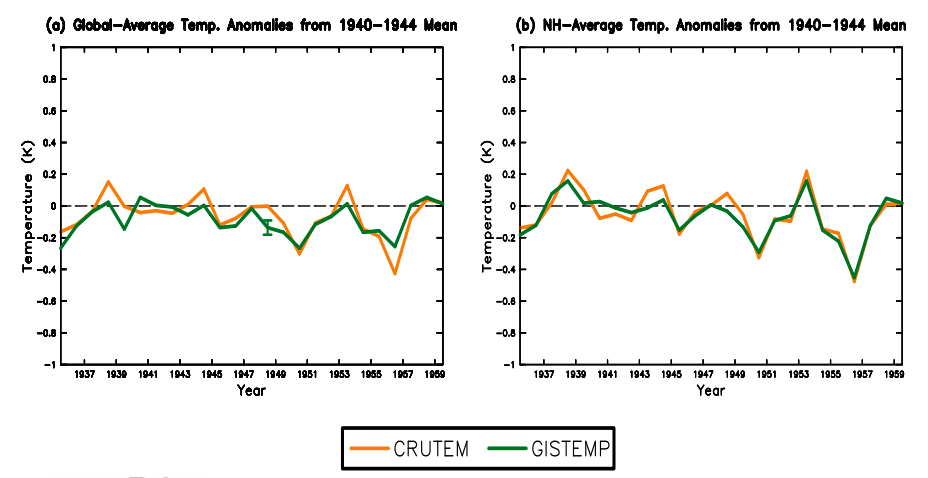
Global (left) and northern hemisphere (right) annual average land surface air temperature anomaly (K) with respect to 1940-1944 average. Data are from CRUTEM and GISTEMP. The green whisker (plotted at 1948 in (a)) is the uncertainty of the GISTEMP observations (95% confidence limit) accounting only for incomplete spatial sampling. Source: Robock & Zambri (2018)
However, we know that there were other factors in play. For example, seasonal temperatures show that cooling in 1945 started at the beginning of the year, before the air raids on Japan. This suggests that natural variability was also playing a role.
Yet there were no significant volcanic eruptions in 1945, nor any El Niño or La Niña event in 1945 or 1946. (In fact, you can see the cooling effect of La Niñas later in the data series – two of the largest La Niñas on record occurred in 1950 and 1956.)
Therefore, despite a detectable amount of cooling in 1945, the multiple uncertainties mean we cannot say for sure that it was caused by this period of bombings in the second world war.
Arsenal
Although our results could not formally detect a cooling signal from second world war smoke, it does not invalidate the nuclear winter theory that much more massive smoke emissions from nuclear war would cause large climate change and impacts on agriculture.
There are many analogues that support parts of nuclear winter theory – not least the way in which major volcanic eruptions create long-lasting clouds in the stratosphere, cooling the Earth and reducing rainfall. The 1815 Tambora eruption in Indonesia, for example, caused the “Year Without a Summer” in 1816, bringing crop failures and food shortages across the northern hemisphere.
Since the end of the Cold War in the early 1990s, the global nuclear arsenal has been reduced by a factor of four. The world currently possesses about 14,000 nuclear weapons, distributed among nine nations – the US, Russia, France, the UK, China, India, Pakistan, Israel and North Korea.
Yet our climate model simulations show that these would still be enough to produce nuclear winter – and that even 1% of them could cause climate change unprecedented in recorded human history.
Robock, A. and Zambri, B. (2018) Did smoke from city fires in World War II cause global cooling? Journal of Geophysical Research: Atmospheres, doi:10.1029/2018JD028922


I have a little question. There have been more bombs dropped, than the ones on Hiroshima and Nagasaki. There has been atomic testing. The number I found in the Bulletin of the Atomic Scientists Mai 1996 is, that 16,000 times the power of the Hiroshima bomb was used in testing in just a 16-month period in 1961/62.
Have these testings be studied? Might these testings give further objects of study?
Libertador,
The other nuclear explosions that you mention were all performed in remote locations, often underground. That means little smoke from was generated. Since the effect on climate of burning cities mentioned in the OP was small, the effect of other nuclear explosions on climate would be expected to be very small.
We all hope that the effect of nuclear war on climate will never be measured.
O/T:
In the first photo, two buildings in the foreground appear to be fully intact. What buildings were those, and how far were they from ground zero?