Hockey Stick Own Goal
Posted on 23 February 2011 by dana1981
In this post we continue our Prudent Path Week theme, and the examination of the two documents the "skeptics" referenced in their recent letter to Congress — 'Carbon Dioxide and Earth's Future: Pursuing the Prudent Path' and the NIPCC report. Specifically, we examine a major contradiction between the two reports regarding a key factor in climate science - climate sensitivity.
Medieval vs. Current Global Temperature
In their Prudent Path document, Craig and Sherwood Idso argue that the Medieval Warm Period (MWP) was at least as hot as today.
"it was just as warm as, or even warmer than, it has been recently during both the Roman and Medieval Warm Periods"
Informal Idsos
The document spends several pages qualitatively discussing various temperature proxy data sets from various isolated geographic locations — one of the main pursuits of the Idsos' website co2science.org. The only response this endeavor warrants is the suggestion that if the Idsos would like to attempt to use this data to demonstrate that the MWP was hotter than today, they should perform a quantitative assessment — combine these proxies into either a northern hemisphere or global data set, estimate the average temperature, and submit their results to a peer-reviewed scientific journal. Over a dozen such millennial northern hemisphere reconstructions have been peer-reviewed, and all agree that current temperatures are hotter than during the MWP peak.
Ljungqvist (2010)
The document also relies fairly heavily on one such millennial northern hemisphere reconstruction — Ljungqvist (2010) — which the Idsos refer to as a "stellar effort". However, this reconstruction is not substantially different from the many other millennial northern hemisphere temperature reconstructions, as Ljungqvist himself states in his paper:
“Our temperature reconstruction agrees well with the reconstructions by Moberg et al. (2005) and Mann et al. (2008) with regard to the amplitude of the variability as well as the timing of warm and cold periods, except for the period c. AD 300–800, despite significant differences in both data coverage and methodology.”
Contrary to the Idsos' claims in the Prudent Path document, Ljungqvist says the following when combining his proxy reconstruction with recent instrumental temperature data:
“Since AD 1990, though, average temperatures in the extra-tropical Northern Hemisphere exceed those of any other warm decades the last two millennia, even the peak of the Medieval Warm Period”
Indeed by plotting Ljungqvist's data along with Moberg et al. (2005), Mann et al. (2008), and the surface temperature record, we can confirm that the three reconstructions are very similar, and all show the peak of the MWP approximately 0.5°C cooler than today's temperatures (Figure 1).
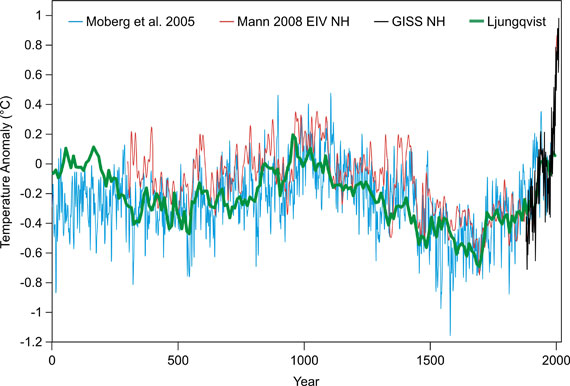
Figure 1: Moberg et al. 2005 NH (blue), Mann et al. 2008 EIV NH (red), Ljungqvist 2010 NH (green), and GISS land+ocean NH (black). Courtesy of Robert Way and John Cook.
Thus we can see that the Prudent Path document's own references do not support its claim that the MWP peak was as hot or hotter than today's temperatures. This is a good thing, because the larger past natural temperature changes were, the larger the climate sensitivity.
Skeptic Climate Sensitivity Contradiction
A quick perusal through the Skeptical Science rebuttal database makes it clear that "skeptic" arguments often contradict each other. Perhaps the worst contradiction of them all are the conflicting claims that the MWP was hotter than today, and that climate sensitivity is low.
Skepticism Requires Low Climate Sensitivity
Climate sensitivity (the amount the planet's average surface temperature will warm given a certain energy imbalance, including feedbacks) is the key to global warming skepticism. The amount of warming at the Earth's surface depends on two factors — the size of the energy imbalance, and the climate sensitivity to that energy. However, the first factor (the energy imbalance caused by the increase in greenhouse gases) is a well-measured and well-known quantity.
Therefore, the only way to argue that humans aren’t driving global temperatures now, and temperature change over the next century won’t be potentially catastrophic in a business-as-usual scenario, is if climate sensitivity is low. "Skeptic" climate scientists like Lindzen, Spencer, and Christy realize this, and it's why their arguments consistently center around the argument "climate sensitivity is low".
The heat trapped by the increased atmospheric CO2 has to go somewhere, and the only way it's not causing and will not cause significant global warming and climate change in the future is if it's suppressed by cooling effects from negative feedbacks. If this were the case, climate sensitivity would be low. And this is indeed a key argument made in the NIPCC report:
"Scientific research suggests the model-derived temperature sensitivity of the earth accepted by the IPCC is too large. Corrected feedbacks in the climate system could reduce climate sensitivity to values that are an order of magnitude smaller."
The NIPCC report is claiming that the IPCC sensitivity range is too high by a factor of 10, but the Idso Prudent Path document, by claiming that the MWP was as hot or hotter than today, is arguing that the IPCC sensitivity range is too low.
Hot MWP Means High Sensitivity
As John Cook has previously discussed, arguing for large swings in natural temperature variation such as a particularly hot MWP is akin to arguing for high climate sensitivity. Several scientific studies have examined the radiative forcings and temperature changes over the past millennium, such as Hegerl et al 2006, as shown in Figure 2:

When you combine the temperature record over the past millennium with climate forcings, you get a most likely climate sensitivity value close to 3°C, consistent with the IPCC climate sensitivity range of 2°C to 4.5°C. So if the temperature swings were actually larger than in the reconstructions used by Hegerl and other studies on millennial climate sensitivity, it means the climate sensitivity is actually higher than the IPCC has concluded.
The two documents referenced in the "skeptic" letter to Congress blatantly contradict each other on this issue. The NIPCC report argues that the climate sensitivity is an order of magnitude lower than the IPCC range, while the Idso Prudent Path document indirectly argues that the sensitivity is higher than the IPCC range. On the most important issue for climate "skeptics" — climate sensitivity — the two documents cited in the "skeptic" letter to Congress contradict each other by a factor of ten.
The True Prudent Path
Ironically, although the two "skeptic" documents differ on the climate sensitivity parameter by an order of magnitude, both are wrong. There are many independent lines of evidence behind the IPCC climate sensitivity range, meaning that it's exceptionally unlikely that it's wrong by an order of magnitude, as the NIPCC report claims. And as discussed above, the evidence does not support the Idso claim that the MWP peak was as hot or hotter than today.
Thus the real "prudent path" involves proceeding under the assumption that the well-supported IPCC likely range of climate sensitivity (2 to 4.5°C with a most likely value of 3°C warming for a doubling of atmospheric CO2) is correct. In this scenario, we are heading towards extremely dangerous and potentially catastrophic warming and climate change this century in a business-as-usual scenario.
Thus the true prudent path involves taking immediate action to significantly reduce human CO2 emissions. If the "skeptics" want to convince us otherwise, they need to start by getting their story straight.
This post was written by Dana Nuccitelli (dana1981) and has been developed into the Intermediate rebuttal to "Ljungqvist broke the hockey stick"

Arguments


You really should drop the denier language it does nothing for furthering understanding.
I really wanted to drop this line as Dana said and move on to the implications of the work but you seem to want to take it back to step 1. So can we nail this?
I thought we'd all agreed that Mann had moved on from his earlier estimates to much more variable one's? That Ljundquist is like Mann 2008 not Mann 1998. You can't do this while at the same time thinking Mann 1998 is essentially OK (give or take 0.05oC). Wahl and Ammann (2007) seems to be in opposition to Mann's own self realisation as described here earlier by some of you're fellow alarmists (yep I'm dropping to your level here).
You, on the other hand, plainly do not like being called a "denier". You think it "does nothing for further understanding". If I saw in your comments any hint of an attempt at understanding, that would concern me; and I would not call you a denier. As it is, I do not see such a hint.
I have given you an opportunity to show that you are not just a denier. I have plainly shown that M&M's attacks on Mann at Climate Audit are unprincipled, and an attack on science rather than an attempt to advance it. You earlier endorsed that attack. Well, disendorse it. Clearly state that you consider M&M's one sided critiques and political machinations, not to mention their various outright slanders, to be unacceptable. Because you cannot both endorse their methods and not be a denier.
Further, there is no inconsistency between MBH 98 and 99 containing statistical errors which only result in a 0.05 degree C variation in their result, and their containing a limited data set which does not provide as good a result as modern studies with their much larger data sets. M&M's critique was focussed on (as is seen) almost irrelevant statistical issues. On the other hand, MBH were up front about the limitations of their data set, but it was the best available at the time.
Finally, I am sure you want to drop this line. After all, your comments have been thoroughly exposed as being based on, and apparently designed to foster, misunderstandings and misinformation. But if this were a principled withdrawal from this line, you would acknowledge your error.
You're trying to drive the discussion done an avenue that is very quickly going to be moderated as OT. Dropping this line is obvious to all reasonable people, just because I recognize this doesn't mean I'm running away from the arguement. I agree with Dana the implications of this work are more interesting than just point scoring.
You're moral stance and all the fluff around M&M is irrelevant to the science. Is Mann 98 the same as Mann 2008, moberg and the rest? NO it is not, you seem unable to accept that. If you accept this we can move on. Essentially that was the point of my initially post but fine ignore that and stick to you're moral indignation.Going with the logic of saying newer estimates are better estimates (obviously not always true) then climate sensitivity isn't just high it's rocketing into the stratosphere. Combine the more variable temp records, such as Ljundquist, with the less variable solar forcings of STEINHILBER ET AL 2009 and others (see his table 1) and you have climate sensitivities that are so high as to contradict much of our understanding of 20th C temperature change. You get into the realms of the fanastic. Is it true that climate sensitivity can be so high as to be not just problematic to our future or inconsistent skeptics but also problematic to the wider AGW theory?
The issue was summed up for me in a Nature review by Foukal1 Frohlich Spruit and Wigley. Obviously the science has moved on even from 2006 but they include the following line towards the end.
"Overall, we can find no evidence for solar luminosity variations of sufficient amplitude to drive significant climate variations on centennial, millennial and even million-year timescales."
"I have noted in the post that there are a lot of (indirect) references to Mann et al. (1999) – the so-called “Hockey Stick Graph”. It is science history now.
Any references to temperature reconstructions by Michael E. Mann should be to his 2008 and 2009 temperature reconstructions. They actually show an even warmer Medieval Warm Period than I do. I don’t think it is fair to refer to an outdated work (from 1999) when we have newer and better.
As was shown in an earlier post today, my new reconstruction is practically identical with Mann et al. (2008) after c. AD 900. The same is true with Moberg et al. (2005). My reconstruction is also very similar to Loehle (2007) in shape although his reconstructed amplitude is larger."
Fredrik Charpentier Ljungqvist
That's perfectly good science. Yes, the results they said could contain errors in fact did contain errors... but within the bounds of the error bars they estimated.
That they (and others) have now produced more detailed results with smaller error bars based on more extensive data and more refined statistical analysis is the natural progression of science.
You keep asking if Mann 98 is 'the same' as Mann 2008... apparently not realizing that "yes" is a perfectly defensible answer in the sense that the possible paleo-temperature range shown in the 2008 paper is within the constraints of the possible paleo-temperature range from the 1998 paper. It defines a narrower range and a longer time period, but nothing in the Mann 2008 (or Ljungqvist 2010 for that matter) results contradicts the Mann 1998 results. In short, the latest research from all sides says that the results of Mann 1998 were correct.
Your argument is essentially the equivalent of saying that Newton performed 'junk science' because his instrumentation was not precise enough to measure the acceleration due to gravity as accurately as we can now.
The Ljungqvist proxy data ends in 1999. So THERE IS almost NO missing incline in the proxy data itself. What you must do is compare proxies of today (or the 90's if you wish) against MWP. Yes, the recent rise in temperatures do not seem as strong as in the temperature records, but HEY ITS PROXY DATA it is LESS accurate. Same "missing inclines" would be in the MWP as well. And according to the proxy-data there is no significant difference between MWP and today. Period.
Ljungqvist also states that:
”a very cautious interpretation of the level of warmth since AD 1990 compared to that of the peak warming during the Roman Warm Period and the Medieval Warm Period is strongly suggested.”
So what you have done here isnt a "very cautious interpretation". Instead you have used Mannian smoothing techniques on top of the apples-to-oranges comparison. How do I know that? Because your graphs show almost 1degC increase from the mid 1900's when properly smoothed data shows this, less than 0,45degC increase:
The original reconstruction looks like this:
http://i54.tinypic.com/11wd2r5.png
Why dont you respect the author and his data, and instead make your own "versions" of it, without reading the actual paper and without respecting the original author?
And BTW, warmer MWP does NOT mean "higher sensitivity". That is bullshit. Or where is it proven, that climate changes ONLY due to external forcings? What warmer MWP means, is that temperatures can oscillate not in only 30 year periods but also in multicentennial periods, without having an actual external forcing.
"Consistent with earlier results (Hegerl et al. 2003), a response to solar forcing cannot be robustly distinguished. This can be due to either the climate response
to solar forcing being small, or to low-frequency variations in solar forcing being different from estimates
used here. The latter is quite possible given large uncertainties in these reconstructions (Lean et al. 2002)."
In fact, Hegerl produces the most coherent results, ie, with climate sensitivity of solar and GHG forcings being the same, if solar forcings are half that of the estimates which he used. With solar forcings only 1/4 of that which he used, the sensitivity of GHG and solar forcings will still be very close, within limits of error.
In other words, more recent reconstructions of solar variability make sensitivities fit better with the AGW picture, not worse.
Having said that, this is an area with room for substantial refinement as shown by the significant differences in scaling factors for different temperature reconstructions.
You are using a 133month smoothing, when one was discussing about about the divergence POST 2000's. So what you just did was that hid the divergence with smoothing.
How does it look like when looked more closely, HadCRUT vs GIStemp since 1995:
What you also stated that why should "polar amplification be ignored". GISTEMP HAS NO MORE DATA IN THE ARCTIC THAN ANYONE ELSE! They just interpolate it. Interpolating DOES NOT mean they have more data or that it would be more accurate.
There is also LESS multidecadal dynamics in GIStemp, clearly visible when comparing detrended data:
(both graphs end in 2003 so the recent decline in HadCRUT isnt shown here)
I wonder if that is because Model E cannot reproduce the 1910-1940 warming and the 1940-1970 decline.
And you didn't address what Ljungqvist actually said in his paper (see citation at #57) and neither did you address the proplem of comparability between proxies and temperature records. As I said before proxies are not as accurate, and if they do not follow temperatures as closely in the 1900's it also means they propably do not reproduce the temperatures of the MWP as accurately either. Therefore you can not do such a comparison, period. This has also been discussed in McShane & Wyner (and those guys are statisticians as you might now).
And one of the basic principles in statistics is not to combine two series which have been measured differently, and this point is being completely ignored over and over again (here and elsewhere).
Original version by the author:
Looks like nothing like yours.
"Looks like nothing like yours."
This is going to be fun. And note Protestant, that despite your protestations, Ljungqvist also spliced the CRU data to his reconstruction (as you showed @62). You do not like the observed marked warming in recent decades one bit, it is clearly very inconvenient for you and Idso et al., so I guess it now has to be "attacked". Be mad at Idso et al. for scoring such a spectacular own goal, not us.
A likely reason for the proxies underestimating the amount of warming at the end of the record (again referring to the original figure) is that for the last decade, as pointed out by Dana on this thread, there were very few proxies used in the reconstruction.
You are now spamming this site with many allegations and much arm-waving. For the record, McShane and Wyner might be statisticians but their ignorance and their inexperience in working worth paleo data was all too obvious in their paper. Regardless, you know what? They ended up with a HS, although their shaft was rather oddly rotated.
The many criticisms of McShane and Wyner can be found here, also follow embedded links.
Finally, you seem to be arguing for a warmer MWP. So as Dana and others have pointed out you are arguing against low climate sensitivity. What do you understand climate sensitivity for doubling CO2 (with feedbacks) to be protestant?
"And one of the basic principles in statistics is not to combine two series which have been measured differently, and this point is being completely ignored over and over again (here and elsewhere)."
Now please do look at the graph and read the caption of the graph from Ljungqvist (2010) that you posted @62. You are contradicting yourself.
as a non scientist who normally only observes can I just clarify. Is this thread basically saying if the MWP was warmer than today this is not a good sign for our future and if today we are warmer than the MWP this is not a good sign for our future?
protestant@57 temperatures can oscillate not in only 30 year periods but also in multicentennial periods, without having an actual external forcing.
can someone explain how this would work? it sounds more like alchemy than science
Albatross has already addressed the other points I was going to cover. The divergence between instrumental temperatures and proxies over the past decade or two is likely due to the lack of proxy coverage, as I have already said twice.
And you are still scoring an own goal by arguing that the MWP was hot, and thus that climate sensitivity is high.
So RealClimateScientists know better than statisticians? If they do not agree, then I think they should publish their comments in the appropriate journal. But for the record, I dont trust RC:s honesty partly because of the moderation policy (ciritsism they cant answer they delete).
I dont have anything against the observations of the last few decades. The cause for them is another topic.
And as I said before, warmer MWP does NOT mean higher sensitivity. It would, if the basic tenet that surface temperature doesn't change without external forcings to be proven, and also you would need to prove that it was the GHG's or the sun which were the cause (neither wasn't I bet ya). Yet we have phenomenoms like ENSO, PDO, NPGO, and AMO which remain unexplained (I would call them internal variability = weather). Tell me what's the forcing behind those things and what is the maximum timescale where events like that could occur? I could bet 1000 dollars you (or anyone here) doesn't have an answer. I would suggest it is just chaotic variability in the heat transfer between air and the ocean. As I understand, the THC (Thermohaline Circulation) and the Gulf-stream is poorly understood (and as we can see MWP was pronounced in Greenland, which is near Atlantic...).
You should be also reading this article carefully and with thought (and the following discussion):
http://judithcurry.com/2011/02/10/spatio-temporal-chaos/
You should also know that heat is different than temperature. Heat can be transferred from oceans to the atmosphere and vice versa. Therefore surface temperatures may vary a lot without a big difference in total heat in the system.
Perhaps you have some other model in mind? Internal forcings? Volcanoes? Little green men? Or do you propose that climate changes entirely by itself?
"temperatures can oscillate not in only 30 year periods but also in multicentennial periods"
Oscillations average to 0.
Read my last comment. Only a change in the THC or gulf-stream can have a drastic impact on the temperatures of NH.
#67.
No I am not. Besides, no computer model can replicate MWP, nor speaking about RWP or the Holocene climate optimum. They are completely dependant on the "Hockey stick". Unless you prove me no chance will occur without a change in external forcings (then again, you would need to explain the EXTERNAL forcing behind AMO, PDO and ENSO, which you cant since they are largely being interpretated as 'internal variability').
Source? That claim is unfounded and bizarre. Why do both, AMO and PDO STRONLGY correlate with temperatures? And why do models not reproduce the strong warming from 1910-1940 and the cooling since 1940-1970 (aerosols do not explain the blip as we can see from the model outputs)?
Show me the evidence, that a change in ocean circulations cant result in a temporal change in surface temperatures?
Read:
http://hsu.as.ntu.edu.tw/pdf/18.pdf
You should propably look what a Norvegian ocean modeler thinks about AMO:
http://www.bccr.no/acdc/filer/242.i3yGAl.pdf
Also read the blog entry I linked above to Curry's.
Yes, actually they do know the data better than the statisticians; the specialist statisticians know the statistics better. Either working alone is unlikely to do as good a job as both in collaboration. A statistician applying relatively advanced statistical techniques without a good grasp of the nature of the data generating process is more than likely to shoot themselves in the foot. I know this to be true as I am a statistician, and I regularly collaborate with scientists and their input is absolutely vital.
"So RealClimateScientists know better than statisticians?"
Sigh, actually follow the links and read the submissions before commenting. There were 13 or so articles submitted that discuss M&M10, from both paleo climate scientists and statisticians. I happened to give you the RC link for convenience.
And I don't trust those affiliated with ClimateAudit-- their modus operandi and objectives were exposed a long time ago. Talking of which, thanks, but I do not go to politically-motivated sites like Climate etc which seem more interested in slandering climate scientists and web traffic than science. Anyhow, that is off topic and irrelevant.
Also, as shown by a statistician (Tamino), the PDO, ENSO and AMO do not explain the observed long-term increase in global temperatures. So internal climate modes, while they may have had a role at times during the MWP, cannot explain the duration of the warming. I note that you have not provided a single paper to back up your assertions.
Actually ENSO is well understood, and the "delayed oscillator" mechanism explains the formation of El Ninos.
To me, the LIA is of more interest as far as inferring climate sensitivity goes, because the cooling was more widespread than during the MWP. We also have a very good idea what caused the LIA, and it was not internal climate variability but mostly by the Maunder minimum and aerosol loading from volcanism. Those factors producing such marked cooling over a prolonged period point to higher climate sensitivity, not lower climate sensitivity.
You did not answer my question about climate sensitivity for doubling CO2 (with feedbacks).
If you substract global SST anomalies (*the* nonlinear GW signal) from NA anomalies you get AMO, as you do by detrending NA. Same result.
Just for the sake of this discussion, read the two references I just gave you (DelSole et al and Otterå)
Also you are referring on dishonesty about ClimateAudit and claimed Climate etc. is a politically motivated site. Isn't that against your moderation policy? FYI Curry is a climate scientist and isnt keeping her blog for 'politics', but for truth seeking. I hope the rules are same for everyone here.
I am not going to get drawn into a mud fight with you about various blogs on the internet. I would, however, urge you to be more skeptical about the true motives of some people claiming to be interested in "reconciliation".
Tamino demonstrated that removing "the estimated impact of el Nino, volcanic eruptions, solar variation, and the residual annual cycle" the observed global warming signal is clearly evident. He also demonstrated that "Correlations with the AMO index do alias effects of global warming".
Regarding DeSole et al., I will leave readers with these excerpts form their abstract:
"This component, called the Internal Multidecadal Pattern (IMP), is stochastic and hence does not contribute to trends on long time scales, but can contribute signifi- cantly to short-term trends"
and
"While the IMP can contribute significantly to trends for periods of 30 years or less, it cannot account for the 0.8 C warming trend that has been observed in the twentieth century spatially averaged SST."
Seems that you are seeing what you want to see protestant. And you still keep avoiding answering my question about climate sensitivity for doubling CO2 (with feedbacks). Why?
So now that I brought up McShane & Wyner, I hear some commenters starting to discuss about the paper overall. I am not interested in sucha discussion now. But here is the spesific statement I was referring to, and to which I fully agree:
"It is not necessary to know very much about the underlying methods
to see that graphs such as Figure 1 are problematic as descriptive devices.
First, the superposition of the instrumental record (red) creates a strong but
entirely misleading contrast. The blue historical reconstruction is necessarily
smoother with less overall variation than the red instrumental record
since the reconstruction is, in a broad sense, a weighted average of all global
temperature histories conditional on the observed proxy record. Second,
the blue curve closely matches the red curve from 1850 AD to 1998 AD because
it has been calibrated to the instrumental period which has served as
training data. This sets up the erroneous visual expectation that the reconstructions
are more accurate than they really are."
So far, I havent seen any evidence that would be in contradiction to this point. Even if you disagree with some points made in the paper, I dont think there should be any disagreement on this one.
And this is my point. Using temperature data on top of proxydata should be done with extreme caution, and at least not with "predictive" smoothing excersises.
What I also didn't get an answer to, is that what kind of smoothing Dana and Robert used. Was it Minimum Roughness, or something else with 'predictions'? Since rolling averages (or decadal if you wish, as Ljungqvist used) do not give even closely such a staggering result, it is a clear hint towards that something like this was being used.
"Why do both, AMO and PDO STRONLGY correlate with temperatures?"
Wow, then that must mean that correlation = causation? Thanks, we can use that basic principle to demonstrate CO2 -> increased temperature.
For the lack of any long term effects due to the PDO, see the appropriate thread. Short answer: Ocean circulation moves heat around; it doesn't add heat. It is a response to a pre-existing non-uniform heat distribution. You really shouldn't need to see a link for that.
This is not an oscillation thread; further oscillation discussion should go to the appropriate thread.
Have you read the two referenced I cited few messages back, about AMO?
And please tell me, how do you get an almost one degree incline from mid 1900's if you calculated only decadal averages? As my calculations show above, the incline is less than 0,45degC, and I didnt use any predictive techniques. 2010 data is being used (downloaded from CRU) so that the graph ends where it should end, 2005.
There was some commenter who insinuated that the use of GISS was because they supposedly "inflate" the warming. As I have shown before there is WIDE agreement amongst satellite and instrumental records, as well as including reanalysis datasets.
http://www.skepticalscience.com/graphics.php?g=14
In fact, Hadley is the one whose station combination method has been shown to be dubious (by Roman M, a "skeptic") and therefore undersamples the actual warming.
Furthermore, the european center for medium and long range forecasting who produce the most accurate of the reanalysis datasets (ERA) has also confirmed that Hadleys station combination method results in less sampling of the regions that are warming the most. I can even show you a direct example of this if you like? It is a huge annoyance that people continually make these claims. NASA data is used because it is the best representation of the trends, NASA assumes that the stations around the high arctic warm at the same rate as the high arctic whereas hadley just assumes they have the same trend as the global average. If you know anything about polar amplification you know which assumption is more accurate.
Finally as I showed before in my post on temperature trends and Monckton, the Reanalysis datasets which include the most data agree much better with NASA than Hadley. So enough of the insinuations about selective method choice. There are in fact "better" methods and Hadleys is not better.
I will still anwer short: Models do not reproduce the behavior in temperature series (1940's). Only an explanation which includes those oscillations would.
My clear point is, they do not (necessarily) generate heat (unless they are linked in changes to cloud cover, like ENSO is), but move heat around. This is enough to cause a short term (<65years) fluctuations in surface temperature.
My point also ISNT that PDO (nor AMO) would explain *long term* trend. But the surely will when the trend is less than a full cycle.
But I guess I had enough here, I will read any responses that might appear and then disappear. BB.
The fact remains that this comment made in the "Prudent path" misinformation document is not supported by the data and is demonstrably false:
"it was just as warm as, or even warmer than, it has been recently during both the Roman and Medieval Warm Periods"
That statement of course does not suggest anything about how much more warming we will very likely experience in the coming decades-- it is thus also a red herring.
Also, the fact remains that the overwhelming evidence points to a climate sensitivity near +3 K for doubling CO2 and taking into account feedbacks.
All I can say that you didn't understand what I am talking about. For example, Taimno's excersice on the recent 30 year trend *is* a period where also AMO is increasing (DelSole), and contributing this circa 0.08K/decade. Therefore he should have removed it.
Tamino didn't demonstrate that AMO would alias effect global warming. Nope, njet, nada. If you had read Bob Tisdale's post (I see again the man was attacked by the commentators, not his arguments), Kaplan SST has a smaller trend in North Atlantic than Oi.v2 Reynolds or HadISST. Therefore he biased his result choosing Kaplan and removing GISS (with land data included, how dubious is that). His demonstration was highly erroneus.
I never made such a claim that AMO would explain all of the observed warming, but there might be some indication that there is cycles like AMO on even centennial time scales (the variability on the late holocene, no forcing can explain it!)
Ok, now I will disappear, for real.
actual data here
Decade LJ2010 Hadcrut 30-90N
1880–1889 -0.337 -0.242
1890–1899 -0.25 -0.223
1900–1909 -0.293 -0.313
1910–1919 -0.296 -0.31
1920–1929 -0.171 -0.087
1930–1939 0.004 0.132
1940–1949 0.019 0.11
1950–1959 0.037 0.063
1960–1969 0.015 0.023
1970–1979 -0.074 -0.028
1980–1989 0.082 0.149
1990–1999 0.056 0.459
2000-2009 0.789
There were no "predictive techniques" used.
[edit made by Dikran Marsupial]
Regarding MW10,
You do realize that they had multiple comments and responses to their paper showing flaws throughout correct? I'm just curious whether you took the time to realize that they implemented things wrong quite a bit. Including using local proxies to try and correlate with hemispheric temperatures rather than correlating to local temps and averaging to make a hemispheric average.
Many more examples of errors are found here:
http://deepclimate.org/2010/08/19/mcshane-and-wyner-2010/
[edit made by Dikran Marsupial]
Robert, what has Steig vs O'donnell have to do with this? I am completely not interested in any rant written by DC nor Romm (nor Climateaudit). But what concernes is that Steig was Reviewer A and which is a disgrace. Don't you agree one shouldnt be a reviewer when your own work is critisized?
I havent looked on the math by either side so I do not know which paper is right, but I tend to believe O'donnell is. But I am not willing to dig this any further since other details are more interesting, and besides, I have a day job.
And if DC has anything against M&W then I wish him best luck in publishing it. As I said before I am not at the moment interested on discussing about the paper as a whole, but about the statement I cited.
But I definitely need to point you out, that if you are reading blogs on a highly polarized issue, you *must* be reading and considering the points on both sides. I am sure you are doing it, but many people commenting these blogs are certainly not, thus biasing their opinions towards the 'side' they picked in the start.
And btw, thanks for the decadal data you have calculated. The differences on our calculations seems to be because I have whole NH data, where you have just extratropical. I trust you and am not willing to spend any time checking the results. But I still dont see how that should be compared on data, which is necessarily smoother and doesn't respond to temperatures as good as thermometers. You must take into account, that if the proxies do not respond to temperatures as good *now*, why would they do it 500, 1000, 1500 nor 2000 years ago?
You seem to be arguing in circles and using excuses to try and discredit whichever information is inconvenient to you. You have questioned the validity of the temperature data from the instrument record, then questioning the splicing, then introducing the red herring of transient oscillations, now you seem to be arguing that the paleo reconstructions are questionable (including Ljungqvist it seems). Well, Idso et al. sure are placing a lot of emphasis and weight on Ljungqvist (2010) and excluded the spliced temperature data from the instrumented record that ljungqvist (2010) included in his paper.
All data have issues, that does not render them useless.
You have been shown to be wrong about a few things on this thread, yet you insist on trying to obfuscate and detract from the own goal scored by Idso et al.
PS: If you wish to challenge Tamino's work, then please do so at Tamino's site.
No, they sure don't: IPCC AR4 WG1 Figure 9-5
See Models are unreliable.
Or just chuck all climate models and basic physics out and go with the 'unforced free oscillations' idea -- call it UFOs!
Moreover, once again you are scoring an own goal. If you are correct, and the proxies underestimate large temperature swings, then the prior temperature changes were larger than we think, which means climate sensitivity is higher than we think.
But if you examine the figure I provided, you can see that the instrumental record and Ljungqvist proxy data match up quite well until about 1980, which constitutes about 85% of the instrumental record, only diverging at the end when there is little proxy coverage. The logical conclusion is that the divergence is due to a lack of proxy data.
"'unforced free oscillations' idea -- call it UFOs"
Thanks for making me laugh...that is hilarious.
Because it was written in 2007, therefore didn't have Mann '08 and other recent papers available for inclusion.
Apparently yours is that IPCC 2007 should've trotted out their secret time machine and fast forwarded until after those more recent papers were published, and included them?
What do you think AR5 will include? Here's my guess ... those papers that came out 2007-2010.
You're stuck in the past because you're posting in 2011, not 2007, when AR4 was published.
OK I look forward to seeing the Mann 98 bring dropped by the IPCC.