Climate Science Glossary

Term Lookup

Enter a term in the search box to find its definition.

Settings

Use the controls in the far right panel to increase or decrease the number of terms automatically displayed (or to completely turn that feature off).

Term Lookup

Settings


All IPCC definitions taken from Climate Change 2007: The Physical Science Basis. Working Group I Contribution to the Fourth Assessment Report of the Intergovernmental Panel on Climate Change, Annex I, Glossary, pp. 941-954. Cambridge University Press.

Home Arguments Software Resources Comments The Consensus Project Translations About Support

Twitter Facebook YouTube Mastodon MeWe

RSS Posts RSS Comments Email Subscribe


Climate's changed before
It's the sun
It's not bad
There is no consensus
It's cooling
Models are unreliable
Temp record is unreliable
Animals and plants can adapt
It hasn't warmed since 1998
Antarctica is gaining ice
View All Arguments...


Username
Password
New? Register here
Forgot your password?

Latest Posts

Archives

Ice data made cooler

Posted on 9 December 2010 by jg

Guest post by John Garrett

I am an illustrator who started studying the primary scientific literature to better understand what I thought was a controversy over global warming. I quickly learned that climate science was not an island surrounded by controversy, but a well-founded continent, and most critics I met were merely poor navigators. To point them toward land, I created an interactive Vostok viewer, a Flash program that provides simultaneous displays of temperature, greenhouse gases, incident solar radiation (insolation), and Earth's eccentricity, tilt, and climatic precession for the span of the Vostok ice core.


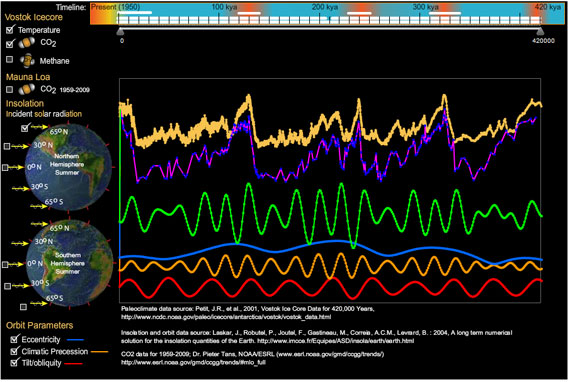
My Vostok viewer uses data from these sources, which deserve the primary credit:

  • Petit, J.R., et al., 2001,  Vostok Ice Core Data for 420,000 Years, IGBP PAGES/World Data Center for Paleoclimatology Data Contribution Series #2001-076. NOAA/NGDC Paleoclimatology Program, Boulder CO, USA.
  • Astronomical Solutions for Earth Paleoclimates. A&A 428, 261-285 (2004), DOI: 10.1051/0004-6361:20041335; Laskar, J., Robutel, P., Joutel, F., Gastineau, M., Correia, A.C.M., Levrard, B. : 2004, A long term numerical solution for the insolation quantities of the Earth.
  • CO2 data for 1959-2009; Dr Pieter Tans, NOAA/ESRL

My viewer is a supplement to Earth, Orbit and Climate, an illustrated presentation I created for my astronomy club, which I drew (literally) from Ray Pierrehumbert's Principles of Planetary Climate* (I credit Pierrehumbert but claim no endorsement).

I recently became interested in learning more about the Eemian interglacial and added this to my Earth, Orbit and Climate presentation. I created a variety of graphs and paired them with diagrams of the Earth's changing orbit. For example:

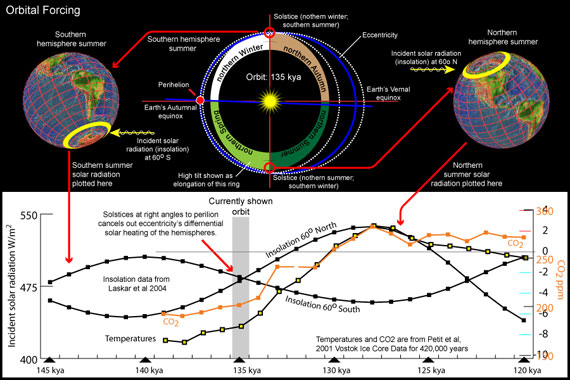
My original goal was to recontruct past orbits (top of this diagram), but seeing the correlation between insolation, CO2, and temperature evoked more curiousity: What about insolation at other latitudes? And at different time periods?

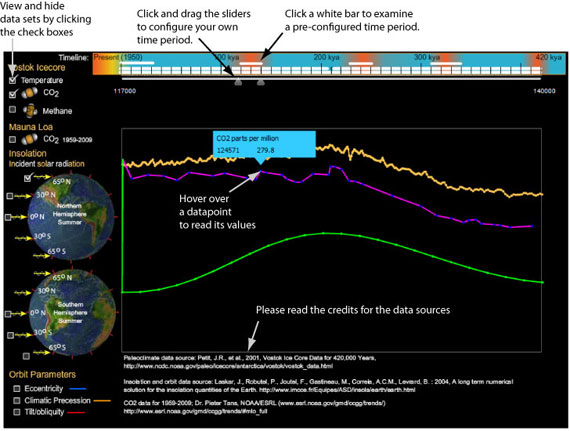
To examine similar correlations for other interglacials, I had to re-export the data, convert it to a table, and then to an illustration. In this process, I was concerned that I would make errors: for example, it would be easy for me to shift one of the graphs left or right, accidentally pairing data from different times (a mistake I made at least once). So in designing my viewer I decided it had to 1) preserve the data for easy verification against my sources, 2) zoom in on any span of time, 3) bring in any dataset that is indexed by date, and 4) fit in 900x600 pixel screen to ensure I can use it in my astronomy presentations. Using the viewer is described below:

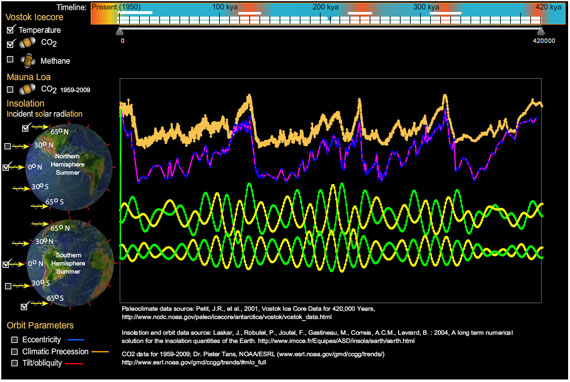
Since creating this program I made another personal discovery (that climatologists already knew). Compare northern summer and southern summer insolation at 0 degrees latitude to the same for 65 degrees north and south. Change in insolation at 0 latitude is symmetrical between north and south, but as you approach the poles, this change becomes asymmetrical, hinting at the profound influence in global climate from northern insolation.

Equally profound is the latest addition of the Mauna Loa CO2 measurements. It challenges the hard-coded vertical scaling I used for the graphs. I will make the scaling more flexible in following versions. I'll also accept requests on features to add.

John Garrett, Wildomar, CA

* Principles of Planetary Climate will be released on Dec 31, 2010 (per Amazon books). I just ordered my copy.

0 0

Printable Version  |  Link to this page

Comments

Prev  1  2  

Comments 51 to 56 out of 56:

  1. RSVP: You have not considered pH, salinity or mixing, among many other important factors. pH alone could give as much as three factors of ten. You cannot do this calculation in the manner you propose. My post 22 and Alec's post 47 give clear qualitative results that explain your question. According to your new reference, CO2 is 5 times more concentrated than O2 and N2 combined (90 ppm vs 19.5, you are apparently unable to read your own table). Approximately 5 times as much CO2 will be released as N2 and O2 combined. The change in O2 and N2 is too small to measure. Post 47 and 22 explain this completely. It is very frustrating to provide a clear, simple answer to your question (at post 22 and 47) and have you deny that your question has been explained. This happens to you repeatedly, so I am not the cause. "The longer you go on the clearer it is that you do not know what you are talking about. You are legendary for the "waste heat" After 10 posts you are not even within an order of magnitude in your calculation. You do not know enough chemistry to correct your calculation. You have provided data that proves your argument is completely wrong. Do you imagine you will ever be able to convince me that you have done this calculation correctly? Do you realize that scientists are professionals who do this for a living? Your back of the envelope calculations (filled with obvious errors) mean nothing compared to a professionals careful, peer reviewed work. For someone who has a complete lack of basic chemistry and physics knowledge, you make a lot of posts suggesting scientists need to do better work. Get you act together!!!
    0 0
  2. RSVP @48, one factor you are not taking into account is that the majority of CO2 in sea water is not dissolved, but rather as carbonate (6%) or bicarbonate (93%). Because these are in equilibrium with disolved CO2, a given reduction in the partial pressure of CO2 due to a warming ocean will result in the release of approximately 100 times more CO2 than your formula (if correctly calculated) would predict. Data on the ratio of dissolved CO2 to the various carbonatets can be found at the bottom of the page you mention. Of course, because so much CO2 is released, the partial pressure of CO2 in the atmosphere will rapidly increase, establishing a new equilibrium between atmosphere and ocean. Consequently simply multiplying your values by 100 will not determine a correct value for increase in atmospheric CO2. For what it is worth, Indermuhle et al, 1999 (Warning, PDF) quote an earlier paper to the effect that for each 1 degree C increase in Sea Surface Temperature, there is a 4.2% reduction in the partial pressure of CO2 in surface waters, with a corresponding increase in atmospheric CO2.
    0 0
    Moderator Response: [muoncounter] This thread is about ice data (and how cool it can be). Take the ocean carbonate, bicarbonate, dissolved gas discussions et al. here. John, consider consolidating argument #89 'CO2 is coming from the ocean' with 'Ocean acidification'.
  3. Tom @52... you mispoke when you wrote " the majority of CO2 in sea water is not dissolved.." Obviously that inorganic carbon in carbonate and bicarbonate ions is dissolved. That could lead to some confusion as there are large pools of undissolved carbonate in the ocean that may also play a rol, especially in light of ocean acidification. To be clear to RSVP and others...dissolved CO2 (and carbonic acid -- the two species cannot be distinquished readily) accounts for only a small part of the total dissolved inorganic carbon pool in the ocean. This is because the current pH of the ocean (as determined by temp and cation concentrations) favors formation of bicarbonate and carbonate from CO2. But as Tom points out all of these species are in dynamic equilibrium with each other, so basically, the whole dissolved inorganic carbon pool has to be considered exchangeable with the atmosphere. Any shift in solubility of CO2 (ie., via temp) tends to result in net loss of dissolved CO2 to the atmosphere which causes dissociation of carbonate and bicarbonate. You can calculate the release that would result from warming (or acidification) using well established equations. However, because of the effects of cations and pH (which changes with dissociation of carbonate/bicarbonate) on the equilibrium, predicting the exact amount exchanged takes solving a set of equations to determine the new equilibrium points. Back of the envelope calculations won't cut it.
    0 0
  4. Oops...sorry about being off topic! The curse of following links to posts from recent comments section!
    0 0
  5. michael sweet #51 "...three factors of ten" As I know nothing, is it OK to ask what three factors of ten is? At any rate, it looks like this subject has been shut down, so you're in luck and dont have to answer that question, even though it has nothing to do with CO2 or polar caps. My last peep (if permitted) would be that as CO2 out gasses I assume there will always be less and less in the ocean, so this effect would curtail at some point, would it not, or should we assume there will always be plenty more CO2?
    0 0
    Moderator Response: [muoncounter] No, the subject isn't 'shut down'; all you need to do is move to the more appropriate thread. You can refer back to comments here by right-clicking the red date and time, copying the link location and inserting that as a link in your subsequent comment.
  6. RSVP, If you want to continue the thread muonconter suggested is a more appropriate place. I will post a reply there.
    0 0
  7. Thanks again to all for reviewing my Vostok graph. I've added many of the suggestions made here: labels, y-scale markers, and a means of rescaling graphs. These were essential features. Other features will be added as I can find time to do so. jg
    0 0

Prev  1  2  

You need to be logged in to post a comment. Login via the left margin or if you're new, register here.


The Consensus Project Website

THE ESCALATOR

(free to republish)


© Copyright 2024 John Cook
Home | Translations | About Us | Privacy | Contact Us