


 Arguments


NASA scientists expect more rapid global warming in the very near future (part 2)
Posted on 5 February 2012 by Rob Painting
In part 1 we saw that NASA scientists James Hansen, Reto Ruedy, Makiko Sato and Kwok-Wai Ken Lo from the Goddard Institute for Space Studies (GISS) have released an analysis of global temperature in 2011, and looked at future prospects. Reviewing the evidence, the authors concluded that rapid global warming is likely in the next few years. This is not a new phenomenon, but simply a reflection of natural variability, cool (La Niña) and warm (El Niño) phases which still exert a temporary cooling/warming influence on global surface temperatures even in the presence of a persistent global warming trend.
In part 2 we'll see that seasonal extreme warm anomalies in 2009-2011 are well above the 1951-1980 base period typically used in GISTEMP analyses - indicative of global warming's role in heatwaves. That measuring of manmade aerosols (pollution particles that reflect sunlight) is still highly problematic, and significantly, that the current warming phase of the 11-year solar cycle is likely to have a noticable warming effect on the climate over the next 3-5 years.
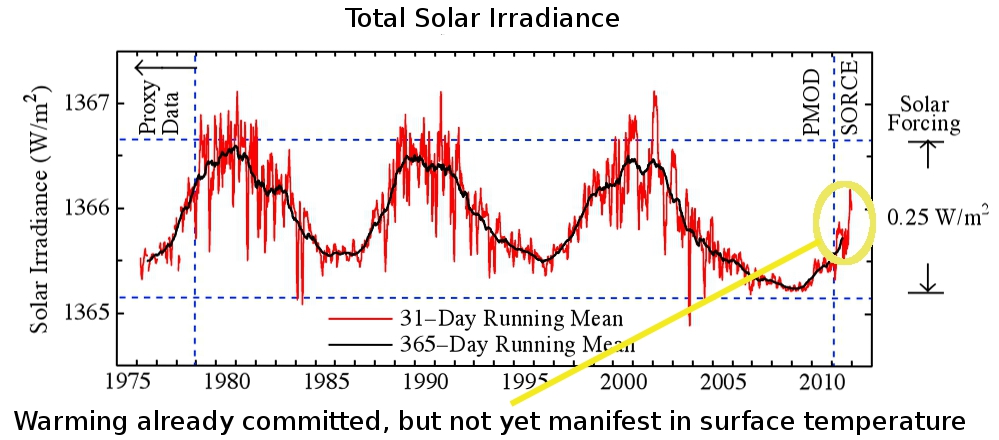
Figure 1 -Solar irradiance from composite satellite-based time series. Data sources: For 1976/01/05 to 2011/02/02 Physikalisch Meteorologisches Observatorium Davos, World Radiation Center and for 2011/02/03 to 2012/01/11 University of Colorado Solar Radiation & Climate Experiment. The circled area is (roughly) the solar energy already absorbed by the ocean and yet to manifest itself in global temperatures i.e - warming already committed.
Damn statistics
As detailed in the SkS post on the freak 2010 Moscow heatwave, global temperatures follow what is called a Gaussian or normal distribution. That is, if you plot temperature along two axes their frequency or density (vertical axis) and how far these temperature measurements deviate from the mean or average (horizontal axis), will tend to be clustered around the mean. These observations or values resemble a bell-shaped curve. See figure 2.
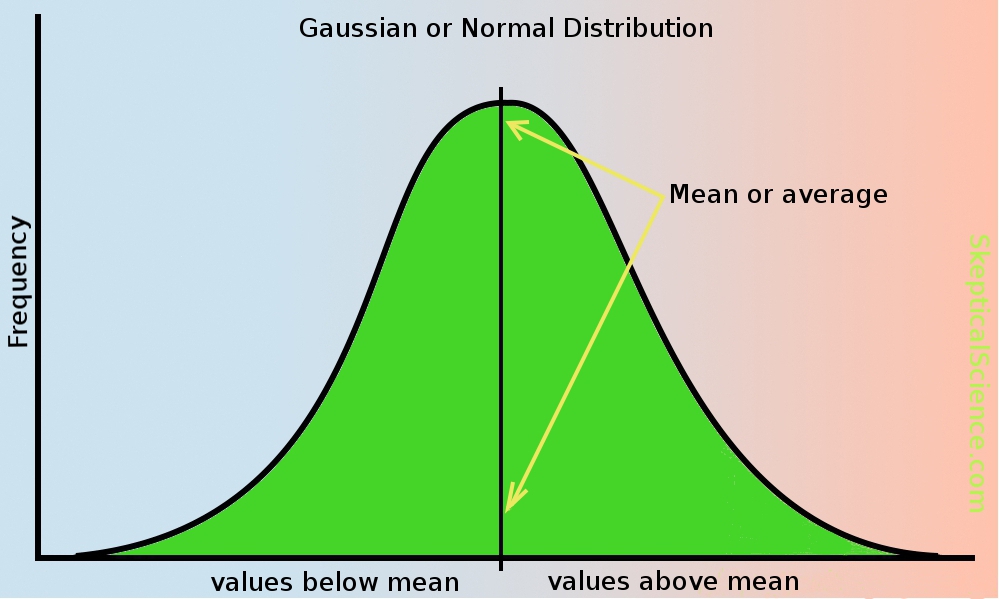
Figure 2 - illustration of a Normal/Gaussian distribution
Not all climate-related phenomena follow this Gaussian distribution, but a number of studies show that surface temperatures do. Intuitively this makes sense, because although surface temperatures can exhibit large swings from time to time they generally don't deviate much from the average throughout the year.
Because of the shape of this distribution, one can mathematically determine the spread of the values. This is known as the 68-95-99.7, three-sigma, or empirical rule, where the percentage of a particluar value declines as one moves further away from the mean. 68.2% of all values are within one standard deviation of the mean, 95.4% within two standard deviations, and 99.7% within 3 standard deviations. See figure 3, and note the greek symbol is sigma representing a standard deviation.
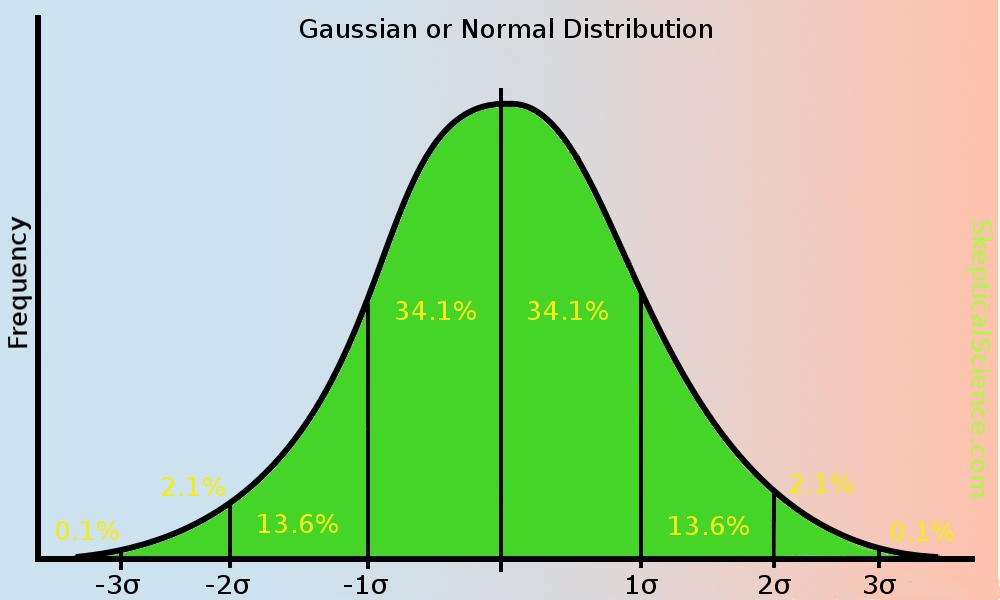
Figure 3 - Gaussian distribution with standard deviations.
With a warming climate the mean temperature begins to slowly climb too, so the bell-shaped curve creeps to the right in the warming direction (figure 4). As it does so, you can see how it affects the measurements at the extremes - warm extreme temperatures become more common place, and cold extremes less common. A shifting mean (as in warming global temperatures) leads to large changes at the extremes.

Fig 4 - illustration of gaussian distribution with a shifting mean.
Seasonal mean temperature anomalies
The authors look at the seasonal anomalies for both June-August (figure 5), the Northern Hemisphere summer, and December-February (figure 6), the Northern Hemisphere winter, for not only 2011, but 2009 and 2010 also. These anomalies (changes from a baseline temperature) are compared to the base period of 1951-1980 in the GISTEMP temperature series - which is the typical base period for GISS.
They compare the surface temperature anomalies in two ways, firstly by plotting the anomalies in °C (figures 5a and 6a), and secondly by plotting them in units of the standard deviation (5b and 6b).
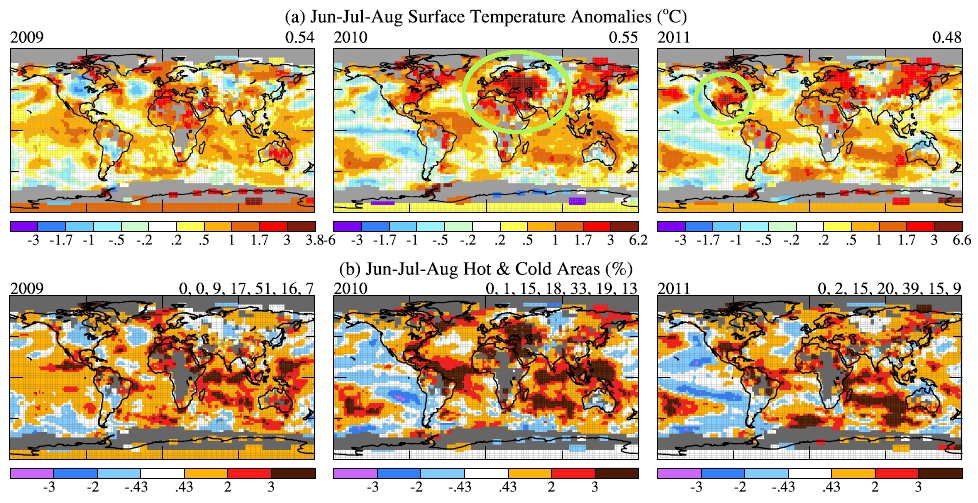
Figure 5 - June-August surface temperature anomalies in 2009-2011 in units of °C (a), and in units of the local standard deviation of local seasonal-mean temperature (b).
In 2010 the monster summer Moscow heatwave is readily visible (circled), as is the summer heatwave covering Texas, Oklahoma and Northern Mexico in 2011 (also circled). Looking at the global temperature in the form of standard deviations is very revealing. Those dark brown areas in 5(b) are 3 standard deviations (3 sigma) or larger (refer figure 3) - very rare extremely warm episodes. These June-to-August extreme warm events in the base period (1951-1980) were a few tenths of one percent, however by 2009 they rose to 7%, 13% in 2010 and 9% in 2011.
This greater-than-tenfold increase in the warm extremes led the authors to state:
"Increased occurrence of such extreme anomalies as a result of global warming, by more than a factor of 10, implies that we can attribute such recent extreme anomalies, including that in Texas and Oklahoma, to global warming"
To appreciate this one only has to look at figure 4, where the slowly shifting mean (global warming) causes a dramatic increase in extreme warm events (heatwaves).
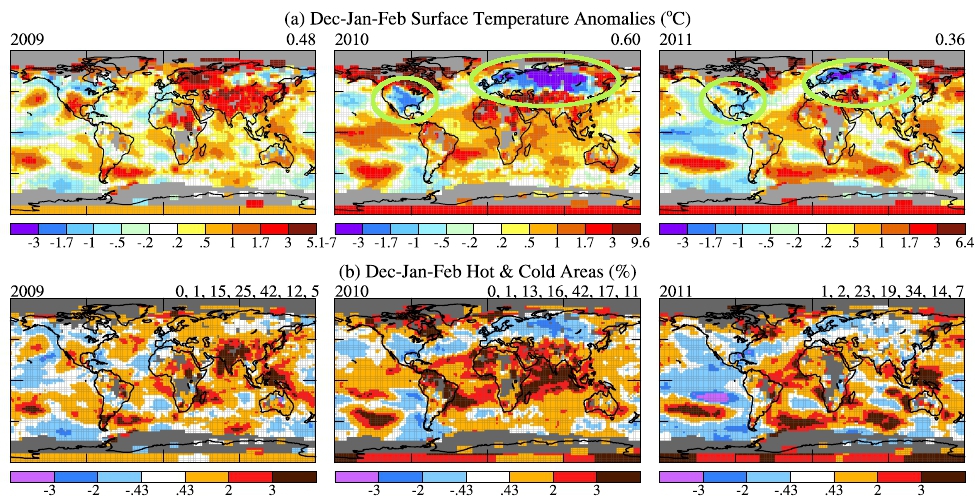
Figure 6. December-February surface temperature anomalies 2009-2011 in units of °C (a), and in units of the local standard deviation of local seasonal-mean temperature(b).
For December-February, the cold winters in the USA and Europe in 2010 and 2011 are very evident in figure 6a (°C anomalies), however once again looking at them in the form of standard deviations gives a better indication of the overall picture. The great majority of these cold events were only minus 1 standard deviation (-1 sigma) away from the mean (light blue). 2010 & 2011 were cold in these regions even by 1951-1980 standards (the baseline), but because they mostly fall within minus one standard deviation (see figure 3), it was a level of cold that occurred reasonably often back then.
Temperature extremes over these years is basically in line with what is expected under global warming - an increase in extremely warm episodes and a decline in extremely cold ones. Indeed looking at the 3 years (2009-2011) only one small region of the tropical ocean in 2011 exceeds minus three standard deviations (-3 sigma), whereas warm extremes (+3 standard deviations) occur with regularity in each year.
The Arctic Oscillation
The Arctic Oscillation (AO) Index is a record summarizing the state of the Arctic weather. Winds that circle the Arctic keep the cold bottled up there, rather like a closed fridge door. When these winds weaken the potential exists for cold Arctic air to escape and get pushed further south. This is simlar to leaving the fridge door open - the cold air escapes.
The AO has no predictive power, as stated earlier it is just a record of the weather there. But looking at the AO index is revealing in that it demonstrates both the long-term trend and just how extreme the 2009-2010 and 2010-2011 Arctic weather was. The long-term trend (Figure 7) has been one of a more positive AO (stronger zonal winds around the Arctic), which indicates less likelihood of cold outbreaks, but the two winters in question were extreme departures from this trend. 2009-2010 was the strongest negative anomaly (weak zonal winds) in over a century of recordkeeping.
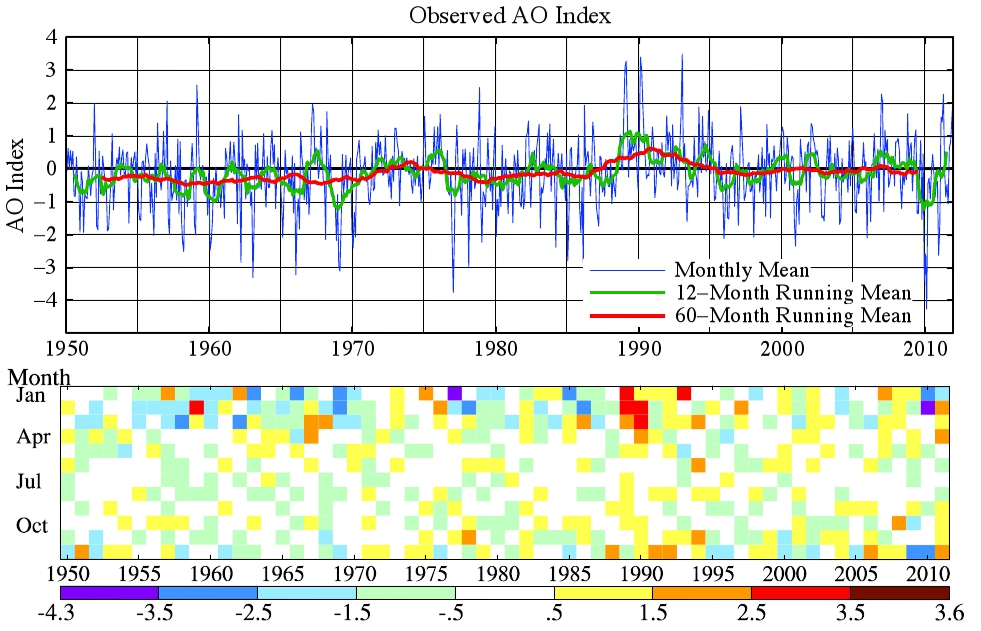
Fig 7. Arctic Oscillation (AO) index. Negative values indicates high pressure in the polar region and thus a tendency for weak zonal winds that facilitate cold air outbreaks to middle latitudes. Blue line is the monthly mean and red line is the 60-month (5-year) running mean.
The authors state:
"Although there has been speculation about possible effects of reduced Arctic sea ice on outbreaks of Arctic air, Fig.(7) provides little support for that hypothesis. Several years had low sea ice cover in the past decade, yet most of those years were warm at middle latitude winters by 1951-1980 standards. Given the fact that winters are much "noisier" (greater natural variability) than summers, the past two unusually cool winters in the United States and Europe do not alter the expectation that middle latitude winters will tend to become warmer as global warming continues."
The Solar Cycle
Small fluctuations in the sun's output occur over a roughly 11-year cycle (peak-to-peak) and vary by as much as 0.25 watts per square metre(W/m2). This may sound sound small, but it's rather substantial when compared to Earth's energy imbalance - that is: the difference between energy (heat) entering and leaving Earth's atmosphere - the global warming-caused imbalance.
The NASA analysis has this imbalance at 0.58±0.15 W/m2 (Hansen 2011), whereas Loeb (2012) has it at 0.50±0.43W/m2. Either way the solar cycle-induced change in energy received from the sun (0.25 W/m2) is large compared to Earth's energy imbalance.
Because of the ocean's thermal inertia (it takes a long time to warm up), global temperature change caused by the sun's variabilty lags solar irradiance by about 18 months. The 'trough' in the solar cycle (figure 1) was therefore still exerting a cooling influence on surface temperatures in 2011. However this is expected to quickly change to a warming effect over the next 3-5 years because the sun is on its ascent to the peak of the next cycle. As circled in figure 1 - extra sunlight has gone into the oceans in the last 18 months. This warming is a 'train that has already left the station' so-to-speak, and will soon manifest itself in global temperature.
Aerosols
These are tiny airborne manmade particles of pollution which reflect sunlight back out to space before it can warm the Earth's surface. The cooling effect from this aerosol forcing is thought to be about half that of greenhouse gases, but in the opposing (cooling) direction.
SkS has looked at another study (Kaufmann [2011]) which suggested an increase in aerosol forcing (greater cooling) due to the rapid industrialization in China in the last decade, however we don't have any direct and accurate global observations yet to support this. A satellite that was launched in 2011 was to be the first to make accurate measurements of this global aerosol effect, but it crashed into the ocean shortly after lift off.
This leads the authors to lament that aerosols are practically unmeasured on a global scale, and the authors regard them as a 'wild card'.
A warm near-term future
To sum up:
- Global warming is a small but persistent trend that has significant impacts upon the Earth's climate.
- 2011 was the 9th warmest year in the GISTEMP global temperature series. 9 out of the 10 warmest years ocurred in the 21st century. The exception being 1998 - warmed by the largest El Niño in a century.
- A more than tenfold increase in extreme warm events, has the authors state that we can attribute the monster 2010 Moscow summer heatwave, and the 2011 Oklahoma/Texas heatwave, to global warming.
- The cold winters of 2009-2010 and 2010-2011 in the USA and Europe took place while the rest of the Northern Hemisphere (and planet) was anomalously warm. See also Guirguis (2011).
- This NASA analysis highlights that the recent lull in surface temperatures is simply the result of natural variability superimposed upon the global warming trend - the cool phase of a cool/warm oscillation.
- This natural variability is large enough to disguise the global warming trend when viewed over short intervals. See SkS post: Going down the up escalator.
- Due to a combination of the warm phase of the solar cycle and an overdue switch to El Niño - when the ocean gives up a lot of heat to the atmosphere, near-future warming is expected.
- The authors finish off their analysis by stating:
"We conclude that the slowdown of warming is likely to prove illusory, with more rapid warming appearing over the next few years."


 0
0  0
0 And:
Temperature responses to spectral solar variability on decadal time scales - Cahalan (2010). Whom write:
"We find surface atmospheric response ∼1 K, about twice as large as the mixed layer response. The surface air response lags the TSI variation by ∼1 month, while the ocean mixed layer response lags the surface air response by ∼2 years for both in‐phase and out‐of‐phase SSI (spectral solar irradiance) forcings."
No doubt there's a great deal more literature on this, but that's the extent of my search. No real surprise here, scientists from NASA are right about the ocean thermal lag, and people on the internet are wrong.
And:
Temperature responses to spectral solar variability on decadal time scales - Cahalan (2010). Whom write:
"We find surface atmospheric response ∼1 K, about twice as large as the mixed layer response. The surface air response lags the TSI variation by ∼1 month, while the ocean mixed layer response lags the surface air response by ∼2 years for both in‐phase and out‐of‐phase SSI (spectral solar irradiance) forcings."
No doubt there's a great deal more literature on this, but that's the extent of my search. No real surprise here, scientists from NASA are right about the ocean thermal lag, and people on the internet are wrong.


Comments