


 Arguments


IEA CO2 Emissions Update 2010 - Bad News
Posted on 3 June 2011 by dana1981, John Abraham
This article has also been published on The Conversation, which publishes articles exclusively from individuals in the university and research sector (primarily from Australia). We recommend checking it out. The article has also been quoted and linked at ABC Drum.
The International Energy Agency (IEA) has released unpublished estimates of 2010 global carbon dioxide (CO2) emissions, and the news is not good. Between 2003 and 2008, emissions had been rising at a rate faster than the IPCC worst case scenario. However, the global recession slowed the emissions growth considerably, and in fact they actually declined slightly from 29.4 billion tons (gigatons, or Gt) CO2 in 2008, to 29 Gt in 2009.
However, despite the slow global economic recovery, 2010 saw the largest single year increase in global human CO2 emissions from energy (fossil fuels), growing a whopping 1.6 Gt from 2009, to 30.6 Gt (the previous record annual increase was 1.2 Gt from 2003 to 2004). As illustrated in Figure 1, in 2009 we had dropped into the middle of the IPCC Special Report on Emissions Scenarios (SRES) scenarios, but the 2010 increase has pushed us back up toward the worst case scenarios once again.
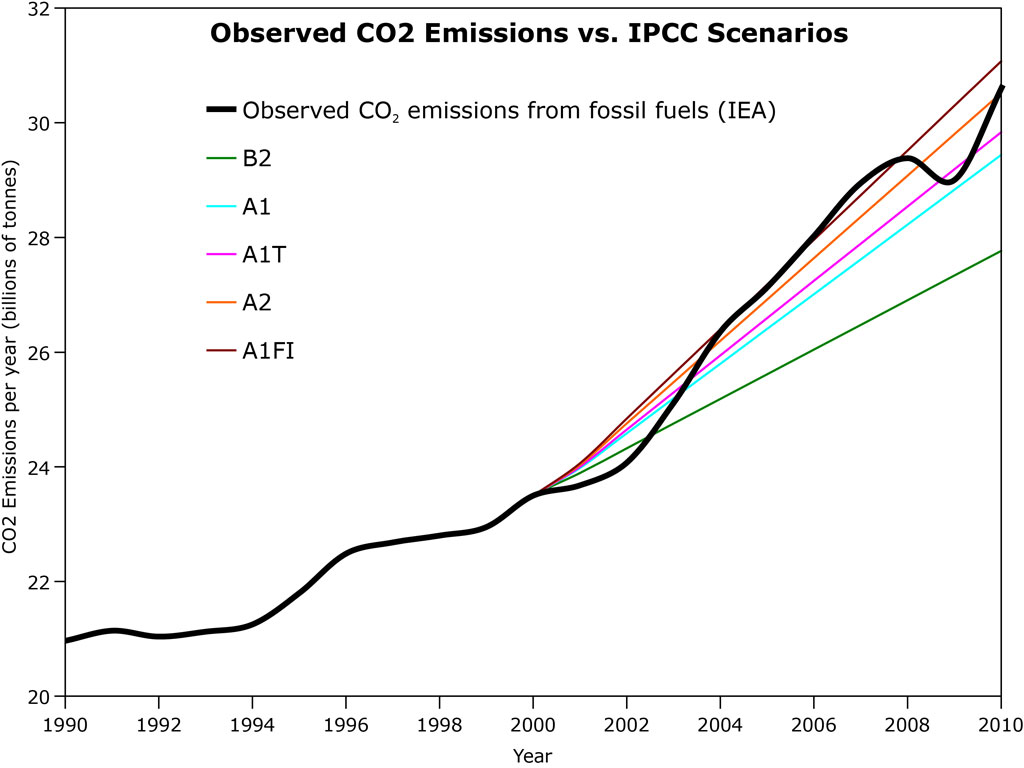
Figure 1: IEA global human CO2 annual emissions from fossil fuels estimates vs. IPCC SRES scenario projections. The IPCC Scenarios are based on observed CO2 emissions until 2000, at which point the projections take effect. Also added to the Hi Rez Graphics page.
Currently, in terms of both cumulative and annual emissions, we are on track with Scenario A2, the description of which matches what's happening in the real world fairly accurately thus far:
- Relatively slow end-use and supply-side energy efficiency improvements (compared to other scenarios).
- Delayed development of renewable energy.
- No barriers to the use of nuclear energy.
The major exception being that several countries are transitioning away from nuclear power in the wake of the Japanese Fukushima disaster, which could slow emissions reductions even further. So, what does continuing on our current path look like?
Figure 2: Atmospheric CO2 concentrations as observed at Mauna Loa from 1958 to 2008 (black dashed line) and projected under six IPCC emission scenarios (solid coloured lines) (IPCC Data Distribution Centre)
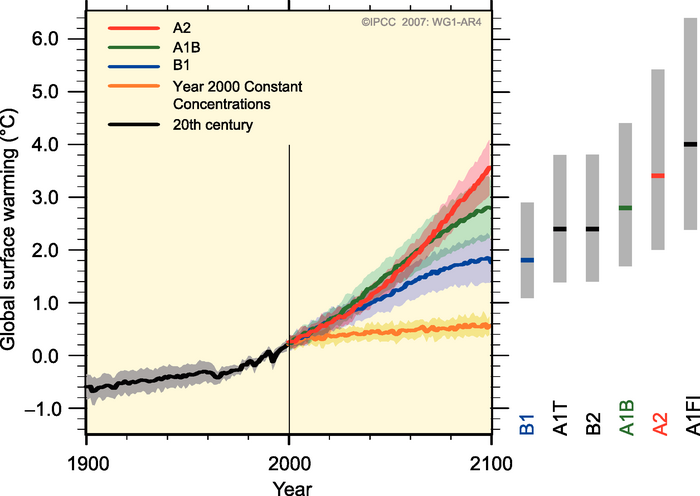
Figure 3: Global surface temperature projections for IPCC Scenarios. Shading denotes the ±1 standard deviation range of individual model annual averages. The orange line is constant CO2 concentrations at year 2000 values. The grey bars at right indicate the best estimate (solid line within each bar) and the likely range. (Source: IPCC)
Scenario A2 puts us at 850 ppm atmospheric CO2 in 2100, with an average global surface temperature 3.5°C hotter than in 2000 (more than 4°C above pre-industrial levels). If we return back up to Scenario A1FI (fossil fuel intensive), which we were exceeding until the global financial crisis, we're looking at 950 ppm CO2 and 4°C global warming over the 21st Century (more than 4.5°C above pre-industrial temperatures in 2100).
Clearly this is very bleak news. In an interview with The Guardian, IEA Chief Economist Fatih Birol said:
"I am very worried. This is the worst news on emissions...It is becoming extremely challenging to remain below 2 degrees. The prospect is getting bleaker. That is what the numbers say."
Indeed, limiting global warming to 2°C above pre-industrial temperatures, which is considered the "danger limit" but which may even be too risky, is a challenge to achieve even in the most optimistic IPCC CO2 emissions scenarios. In fact, the UK Hadley Centre Met Office recently found that just to limit global warming to 3°C, we should have started taking serious action to reduce emissions in 2010 (Figure 4).

Figure 4: Hadley Centre modeled warming by 2100 in various CO2 emissions scenarios (Source)
Right now we're on track with the orange and red arrows in Figure 4. If we continue with this business-as-usual high emissions path, the consequences could be dire. Some of the impacts listed in the IPCC report for global warming of 3–4°C above pre-industrial levels include:
- Hundreds of millions of people exposed to increased water stress
- 30–40% of species at risk of extinction around the globe
- About 30% of global coastal wetlands lost
- Increased damage from floods and storms
- Widespread coral mortality
- Terrestrial biosphere tends toward a net carbon source
- Reduction in cereal productions
- Increased morbility and mortality from heat waves, floods and droughts
The IEA also found that about 80% of the power stations likely to be in use in 2020 are either already built or under construction, which means we're "locked in" for continued emissions from these power plants, which constitute about one-third of global human CO2 emissions from fossil fuels. So it's going to be difficult to transition off of these high emissions scenario paths, and we'll have to find wiggle room in other sectors like transportation.
Birol said that this alarming news should serve as a "wake-up call" for international climate negotiations and other emissions reduction efforts:
"This should be a wake-up call. A chance [of staying below 2 degrees] would be if we had a legally binding international agreement or major moves on clean energy technologies, energy efficiency and other technologies."
These findings should serve as an alarm bell to warn us that our window of time to avoid potentially catastrophic consequences from climate change is running out fast. We need to get on track with the green arrow in Figure 4, which involves immediate and rapid action to reduce global carbon emissions.


 0
0  0
0


Comments