Climate Science Glossary

Term Lookup

Enter a term in the search box to find its definition.

Settings

Use the controls in the far right panel to increase or decrease the number of terms automatically displayed (or to completely turn that feature off).

Term Lookup

Settings


All IPCC definitions taken from Climate Change 2007: The Physical Science Basis. Working Group I Contribution to the Fourth Assessment Report of the Intergovernmental Panel on Climate Change, Annex I, Glossary, pp. 941-954. Cambridge University Press.

Home Arguments Software Resources Comments The Consensus Project Translations About Support

Twitter Facebook YouTube Mastodon MeWe

RSS Posts RSS Comments Email Subscribe


Climate's changed before
It's the sun
It's not bad
There is no consensus
It's cooling
Models are unreliable
Temp record is unreliable
Animals and plants can adapt
It hasn't warmed since 1998
Antarctica is gaining ice
View All Arguments...


Username
Password
New? Register here
Forgot your password?

Latest Posts

Archives

Nuccitelli et al. (2012) Show that Global Warming Continues

Posted on 12 October 2012 by dana1981, robert way, Rob Painting, John Cook

We are very pleased to report on a new paper in press at Physics Letters A (PLA) by the Skeptical Science team and oceanography expert John Church.  In typical SkS international coordination style, the paper's authors included an American (Dana Nuccitelli), a Canadian (Robert Way), a New Zealander (Rob Painting), and two Australians (John Cook and John Church).

The paper is a Comment on another paper, Douglass & Knox 2012 (DK12).  We originally began examining this paper in a blog post which can be viewed here.  DK12 used ocean heat content (OHC) data for the upper 700 meters of oceans to draw three main conclusions: 1) that the rate of OHC increase has slowed in recent years (the very short timeframe of 2002 to 2008), 2) that this is evidence for periods of 'climate shifts', and 3) that the recent OHC data indicate that the net climate feedback is negative, which would mean that  climate sensitivity (the total amount of global warming in response to a doubling of atmospheric CO2 levels, including feedbacks) is low.

Our original draft blog post noted that DK12 had effectively been "pre-bunked," as several recent studies have reconciled global heat content data with top of the atmosphere (TOA) energy imbalance measurements with no evidence of a long-term slowdown in global warming.  Several recent studies have also concluded that it is necessary to include data from the deep ocean in order to reconcile global heat content and the TOA energy imbalance, which DK12 failed to do.  Ultimately we decided that it was worth writing up our findings and submitting them to PLA as a comment on DK12.

We used pentadal (5-year average) OHC data to a depth of 2,000 metres from Levitus et al. (2012), and land, atmosphere, and ice (LAI) heating data from Church et al. (2011).  Our results are shown in Figure 1.

Fig 1

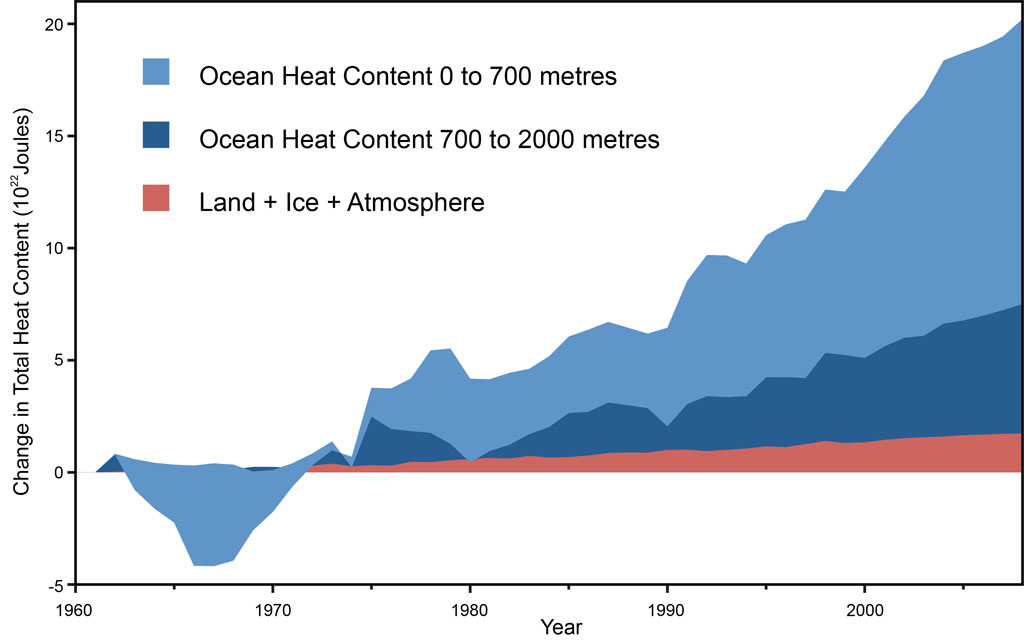
Figure 1: Land, atmosphere, and ice heating (red), 0-700 meter OHC increase (light blue), 700-2,000 meter OHC increase (dark blue).  From Nuccitelli et al. (2012), and added to the SkS Climate Graphics Page.

As this figure shows, there has been no significant slowing in global heat content.  We quantify this result in Table 1.

Table 1: Global Flux Imbalance During Selected Periods.  From Nuccitelli et al. (2012).

Time Period

0-700 meter OHC (W/m2)

700-2,000 meter OHC (W/m2)

LAI Heating (W/m2)

Net Heat Content Increase (W/m2)

1970-2008

0.21 ± 0.063

0.082 ± 0.030

0.025 ± 0.0012

0.31 ± 0.078

1980-2008

0.23 ± 0.062

0.12 ± 0.017

0.027 ± 0.0019

0.37 ± 0.068

1990-2008

0.29 ± 0.082

0.14 ± 0.11

0.030 ± 0.0031

0.46 ± 0.063

2000-2008

0.35 ± 0.13

0.15 ± 0.020

0.029 ± 0.0068

0.53 ± 0.11

2002-2008

0.44 ± 0.17

0.26 ± 0.039

0.036 ± 0.0044

0.73 ± 0.16

In fact the rate of net global heat content increase has risen.  The data also show that failing to account for increases in deep OHC is a problematic omission.

"We find that the OHC increase for the 700-2000 meter layer neglected by DK12 accounts for approximately 30% of the 0-2000 meter increase in recent decades."

Mistaken Analysis Begets Mistaken Conclusions

Thus the DK12 conclusion that ocean heating slowed from 2002 to 2008 was a result of cherrypicking both a short timeframe and only part of the global heat content data.  As a result of cherrypicking noisy short-term data, DK12 argued that the apparent slowing in the rate of OHC increase was a result of a 'climate shift' in 2002.  However, our Figure 1 and Table 1 illustrate that the long-term global heat content trend has risen at a steady, increasing rate over the past 4 decades.

DK12 compounded their erroneous analysis by attempting to calculate the net climate feedback based solely on their estimated 2002-2008 OHC increase for the uppermost 700 meters, and only considering the CO2 and solar radiative forcings, ignoring the significant aerosol forcing, for example.  As Nuccitelli et al. (2012) discusses, this attempted analysis is problematic for several reasons.

"A key conclusion in DK12, that the net CO2 feedback is negative, is also based exclusively on an analysis of data during one of their proposed ‘climate shift’ periods (2002-2008) with a negative flux imbalance.  However, this conclusion does not hold during the ‘climate shift’ periods with a larger positive flux imbalance, and thus the conclusion is not robust.  Additionally, accounting for the heating of the oceans from 700 to 2,000 meters and LAI nullifies the DK12 conclusion even during the 2002-2008 timeframe.  The CO2 feedback is effectively a constant value, and thus should not be calculated using such a short timeframe when data over a longer period are available.  The DK12 feedback calculation is invalidated by focusing on noisy short-term data and failing to account for all radiative forcings at work, as well as all heat reservoirs, in particular the oceans below 700 meters."

Nuccitelli et al. Show that Global Warming Continues

Ultimately our paper shows that all three of the main conclusions in DK12 are faulty: the rate of OHC increase has not slowed in recent years, there is no evidence for 'climate shifts' in global heat content data, and the recent OHC data do not support the conclusion that the net climate feedback is negative or that climate sensitivity is low.  Over 90% of global warming accumulates in the oceans, and there is no indication that it has slowed.

I would like to conclude by once again thanking my co-authors for their work in successfully completing this paper.  We at SkS appreciate that John Church was willing to join our team, that his colleague Neal White was willing to provide us with their global heat content data set, and that their colleague and fellow oceanography expert Catia Domingues was willing to review our paper and provide valuable feedback to improve the paper.

1 0

Printable Version  |  Link to this page

Comments

Prev  1  2  

Comments 51 to 70 out of 70:

  1. I've seen denialists rabbiting on about this article. http://www.dailymail.co.uk/sciencetech/article-2217286/Global-warming-stopped-16-years-ago-reveals-Met-Office-report-quietly-released--chart-prove-it.html#ixzz29H885LXz Can anyone tell me the actual context?
    0 0
    Moderator Response: [DB] The Met Office response is here.
  2. Lloyd Flack "I think climate change denial is more common in physics than in most sciences. " Yeah. Another one is Geology, particularly what is called 'economic geology' - the geology of digging stuff up. That is perhaps easy to see why. They spend their working lives 'building our world' by finding stuff to dig up. So they have an emotional vested interested in preserving the merit of what they have done. Then the focus of their working life is about the questions of 'what rocks, where?'. They don'tactually need to focus to much on the story of why those rocks are what they are - you left that behind in your undergraduate days. And they don't spend much timeon the academic geology - history of the Earth, what processes occurred over that history, a deep understanding of the chemistry of the past. Yet they are surrounded all the time by the immensity of geology. So it is easy to lose sight of the causes of geology andthe part living systems play in that - Photosynthesis gets invented 3.5 billion years ago, photosynthetic organisms flourish in a CO2 rich world. They start elevating the O2 level in the atmosphere till, at around 10% O2 the so-called 'Great Oxygenation Event' occurs. Rising O2 levels start to react with the masses of iron dissolved in the oceans to produce Iron Oxides- Rust. This precipitates out and sinks to the sea floor where it builds up in thick layers. Which we are mining today, 2.5-3 billion years later. If their career hasn't led them to think deeply about why the geology is what it is, not just what it is, they can easily be overwhelmed emotionally by their sense of themeaning of their working lives and lose sight of this.
    0 0
  3. #48 JoeRG : Apologies if I repeat what you already know, but Table 1 is radiative forcing, related to the gradient of the OHC-time series. The error on a gradient is the measurement error plus non-linear components (e.g. ENSO/solar/volcanoes) which also add to the noise. By taking a longer trend you are including more data, and their average contribution reduces towards zero if the noise distribution has a mean-square of zero, so the error estimate falls. Try it in a spreadsheet with a trend plus white noise and then calculating the trend and standard error for different time spans. Even if the noise characteristics don't change, the error in the trend estimate is reduced as more data are included. Larger standard errors earlier on would serve to increase the error, but from Nuccitelli et al's numbers it seems that lengthening the trend calc from 6 years to 28 years more than compensates. Finally, you can see the same effect using Kevin C's excellent trend calculator. 2005-2010 has a trend error of close to 0.65 K/yr. Taking it from 1970 to 2010 reduces the error to 0.036 K/yr.
    0 0
  4. If coal continues to be replaced by natural gas in the coming decade or so and with it, the production of aerosols which have a very short life in the atmosphere, it should be possible to get a handle on the relative cooling effect of aerosols. Could we be in for a wee upturn in global warming just when we least need it (this year's Arctic ice melt)
    0 0
  5. #53 MarkR Thanks for the explanation. It's clear now. #48 dana1981 Thanks as well. Regardless, the main conclusions remain unchanged. Not quite. Speak of an "accelerated rate" is a bit overstated. But nonetheless, the forcing is of course strong. For me it seems that DK12 used this difference of the 2000-2008 and 2002-2008 to generate this "negative" forcing. If so, it would be absurd. I have a last question. Why you use a factor of 0.62 what includes the whole surface? For a forcing that counts to the OHC, only the oceans surface is to consider. For the land values you use the LAI data where the rest, means the remaining 29% of the surface, have to be considered. For your OHC data a factor of 0.88 would be correct, I think. Do you agree?
    0 0
  6. What would be interesting to know, quite apart from implications for contact melting of ice caps, is what this continued sinking of heat energy in oceans does for their thermal expansion.
    0 0
  7. I'm struggling to convince a denier that the Daily Mail article is incorrect. One of the tools I'm using is the SkS post (What has global warming done since 1998?) that shows continued global warming in a graph using GISS, NCDC, and HadCRUT data. My denier acquaintance insists that "NCDC is GISS data." I understand NCDC is under NOAA and GISS is under NASA. Clearly from the graph alone NCDC data is different or is processed differently than GISS data. Their respective websites suggest that NCDC and GISS rely on different satellite data. Can some tell me the difference between NCDC and GISS data? Sorry if this is the wrong place to post the question.
    0 0
  8. #55 Hi again JoeRG, I think I understand why they chose to use the global value. It's because they're looking at total radiative forcing, and ultimately they include land/atmosphere/ice heating as well as OHC change in the calculation. So the total value should use a factor of 0.62. In this case it makes sense to calculate the individual components using the 0.62 factor because then they can be simply summed to get the final answer. What each column is calculating is therefore the global RF required to produce each heat content change in 0-700 m, 700-2000 m and LIA. Makes sense, as Table 1 is labelled 'global flux imbalance...'
    0 0
  9. JoeRG @55 - MarkR @58 is correct. Fair point that it may be overreaching to say that the rise in global heat content has accelerated, and it's not something we said in the paper itself. P.T. @57 - NCDC and GISS use the same raw data, but each applies their own adjustments to that data in order to estimate the average global temperature. The only thing their datasets have in common is the use of the same raw data from the GHCN. See here.
    0 0
  10. Given that the world wide ocean temperature from 0 to 700 metres has risen a measured 0.18 degrees C in 55 years, and the world wide ocean temperature from 0 to 2000 metres has risen 0.09 degrees C in that time period: I ask; 1. How much has the 700 to 2000 metre temperature increased in that time? 2. How confident are we in the accuracy of these measurements? Especially going back 55 years, before the time of Argo buoys, when it was mainly buckets and ropes? (Ref Levitus etal 2012)
    0 0
  11. Hi markx @ #60. You can see the error bars on Levitus et al pentadal estimates in their Figure 1. I'm not sure of the exact details, but those error bars are believable. We can estimate the rough size from basic statistics of Normal distributions. Typically the errors get smaller at a rate of the square root of the number of measurements. For 5 years you have about 180 measurements from each ARGO float, and with 3,200 floats that means that to reach 0.01 C uncertainty in the overall estimate you need to have each ARGO float measuring to within +-7.5 C. This isn't exactly how the measurements are done afaik, and it's actually more complex than that once you include other features, but it does indicate that the size of the change you're considering should be detectable and it makes the Levitus error bars credible. But it should be remembered that this is different from the radiative forcing values calculated, since they look at trends in the data. With enough data, the error in a trend can be smaller than you'd expect from the original errors.
    0 0
  12. Thanks, Mark R. Correct me if I'm wrong, but aren't the "Net Heat Content" measures we are discussing here derived from actual measurements of ocean temperature? If so, is there any possibility that measurements taken prior to the deployment of the 3,200 Argo floats may not have been accurate enough for us to be sure we have recorded a 0.09 C increase in temperature worldwide and across a 2000 metre depth? Or was this figure derived from modeling the calculated increase in energy content? "...We have estimated an increase of 24x1022 J representing a volume mean warming of 0.09°C of the 0-2000m layer of the World Ocean...." (Ref Levitus etal 2012)
    0 0
  13. #62 markx , your comment starts off right, the ocean heat data do come from temperature measurements. Ocean heat isn't my exact area, but your comments would fit with the values given by Levitus. The error bars are much larger before ARGO started. Using the ARGO figures, and assuming that ARGO can measure to 1 C precision, then my global ARGO error estimate for pentadal data (using basic stats) is 0.001 C. If the previous network were 100 times more sparse than ARGO then that would multiple the 5 year error by a factor of 10 to 0.01 C (it's 10, not 100 because we're working with square roots here). And if the precision were only to +-2 C, then the overall error becomes 0.02 C. Comfortably smaller than 0.09 C (and of course, the 0.09 C comes from the trend which has different errors, not comparing just 2 points) So I'm quite comfortable with the values that Levitus et al give: much larger error bars in the past before ARGO, but still small enough to tell the difference. Simply because of the sheer number of individual measurements. If you think the Levitus et al error numbers are wrong, do you have a reference to show this in detail?
    0 0
  14. Ocean heat content studies find that global warming has accelerated in recent years – for example, Levitus 2012 finds a rise in OHC of around 10^23 Joules over the last decade, twice that of the previous decade.

    At the same time, the growth rate of CO₂ forcing has declined slightly – i.e. we are putting more CO₂ into the atmosphere, but the airborne fraction has declined, so the CO₂ forcing hasn’t been rising quite as steeply since about 1990. This means that the net climate forcing, according to GISS, hasn’t risen since about 2000 -

    http://data.giss.nasa.gov/modelforce/

    We know that the existing planetary energy imbalance will cause continuing warming for many decades due to ocean thermal inertia, but we wouldn’t expect warming to be *accelerating* if the climate forcing hasn’t increased for 13 years. That’s a puzzle, it seems to me.

    One explanation could be that the acceleration in OHC accumulation isn’t real. Another could be that it’s real, and that additional natural positive feedbacks have been kicking in to accelerate the warming despite the known forcings being level for 13 years. A third explanation might be that we have overestimated the negative forcing from atmospheric aerosols – since this is largely assumed or estimated rather than measured, perhaps it’s not been offsetting the greenhouse gas forcing as much as expected in recent years, meaning that GISS are underestimating the net climate forcing.

    Does anyone have a view on what the most likely explanation is?  Thanks!

    0 0
  15. Icarus,

    Given a climate sensitivity of a mere 2˚C per doubling, the current global temperature increase should currently be 2 * log2(395/285) or 0.94˚C.   If climate sensitivity is instead 3, then warming should be 1.4˚C.  As such, if we have seen 0.8˚C (using the beginning of the twentieth century as a baseline — if the baseline is 1979, then warming to date due to CO2 forcing is less) then we should expect more.

    This implies that there is anywhere from 0.14˚C to 0.8˚C of warming "in the pipeline," (depending on climate sensitivity and start point) yet to be realized even if net forcing freezes at the current level forever.  As such, the fact that the oceans are absorbing this warming (for now) is unsurprising.  [And, of course, the reason that the net forcing is steady is because of a temporary confluence of negative natural forcings.  One should expect (a) net forcing to increase when the negative natural forcings terminate and (b) the ocean to slow its heat uptake and instead allow the atmosphere to come into equilibrium with the ocean.]

    0 0
  16. Dana, did you, or anyone else on the team, respond to the Douglas and Knox reply published online in Nov 2012? It seems to me they are just saying they prefer their noisy data. Is there any substnce to their claims?

    0 0
  17. Rugbyguy59 - No. There's basically nothing to respond to. Their 'step-change' claim is nonsensical though, and is easily appreciated by looking at the sea level trend over the period of 2004-2008, a period which Douglass & Knox claim the Earth's radiative balance was negative . The ocean is by far the Earth's largest reservoir of heat (around 93% of global warming goes into it), and a negative radiative balance would imply the thermal expansion component of sea level rise was also negative during that period. Sea level rise should have seen a dramatic plunge, but no such thing happened.

    Then there's the problem of the Earth undergoing instantaneous net loss and gain of heat. How would it be possible to instantaneously mix heat into the ocean, and then lose it again? How could that heat escape the ocean without warming the ocean surface, and cooking the atmosphere, on its way out to space?

    Drawing lines on a graph, as they did, does not deflect attention away from the physical impossibilty of it all. 

    0 0
  18. Thanks Rob.

    0 0
  19. I have a question about LAI heating data in figure 1. Is it taken from part 2.3-5 in Church et al. (2011)? If you add those numbers you get 0.4+0.2 *1022J from ice, 0.2 from the atmosphere and 0.67 from land. This adds up to ca 1.5 *1022J, which seems like your result, although your graph implies you have more data from the period and not just an interpolation of these values.

    0 0
  20. devadatta @69 - basically yes. Church was one of our co-authors and provided his full data set for our paper.

    0 0

Prev  1  2  

You need to be logged in to post a comment. Login via the left margin or if you're new, register here.


The Consensus Project Website

THE ESCALATOR

(free to republish)


© Copyright 2024 John Cook
Home | Translations | About Us | Privacy | Contact Us