Global Sea Level Rise: Pothole To Speed Bump?
Posted on 7 February 2012 by Rob Painting
As indicated in a press release from the NASA Jet Propulsion Lab last year, short-term trends in global sea level rise are greatly affected by temporary exchanges of water mass between the land surface and ocean - creating 'potholes' and 'speed bumps' in the sea level record. This a consequence of changes in precipitation (rainfall & snow) resulting from the El Niño-Southern Oscillation (ENSO).
During La Niña the sea surface is cooler-than-normal and rainfall is concentrated over land, which leads to a temporary fall in global sea level. With El Niño the surface of the tropical Pacific Ocean becomes warmer-than-normal, and rainfall gets concentrated over the ocean. This, combined with the drainage of water from land, causes a temporary spike in global sea level.
ENSO is principally responsible for the large year-to-year fluctuations evident in the global sea level record, but neither of these two phenomena (El Niño/La Niña) alter the long-term sea level rise which results from the melting of land-based ice, and the thermal expansion of the oceans as they warm. They do, however, cause sufficient 'noise' to obscure the long-term sea level rise when viewed at short intervals.
In the last two years two back-to-back La Niña have temporarily lowered sea level, but La Niña appears to have weakened in recent months and accordingly we would expect an uptick in sea level rise as conditions move closer to neutral. A quick look at AVISO confirms this, see Figure 1.

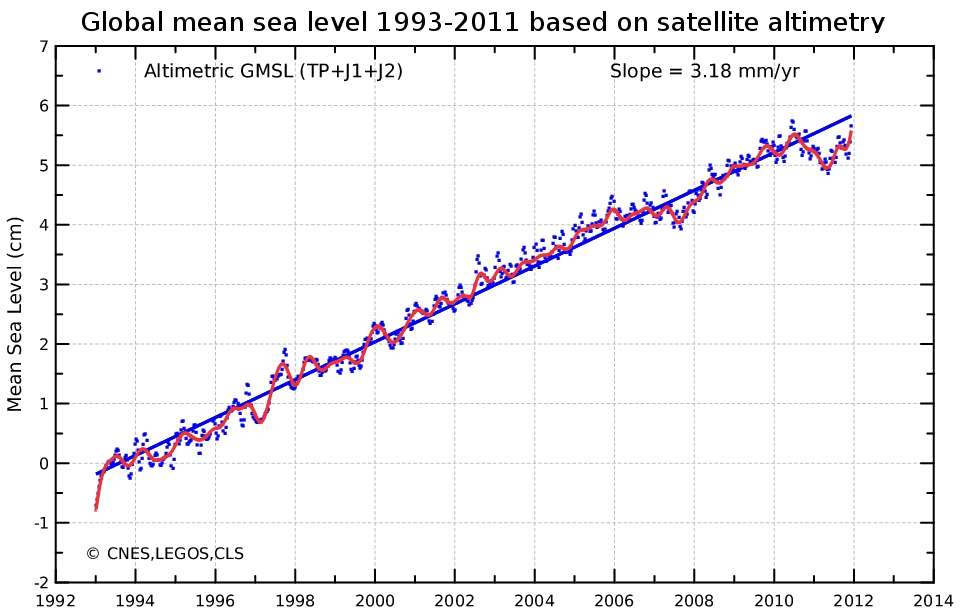
Figure 1 - The reference mean sea level since January 1993 (left) is calculated after removing the annual and semi-annual signals. A 2-month filter is applied to the blue points, while a 6-month filter is used on the red curve. By applying the postglacial rebound correction (-0.3 mm/year), the rise in mean sea level has thus been estimated as 3.18 mm/year. Image from AVISO.
Rather than focusing on the potholes, as the skeptics do, one needs to consider the broader picture. That means factoring in the speed bumps too. See figure 2.

Figure 2 - University of Colorado global mean sea level data with a 12-month running average, and short-term declines. This animation does not include the latest sea level updates indicated in figure 1.
What happens to global sea level rise over the short-term will depend on which aspect of ENSO develops in the tropical Pacific this year. Whatever the case may be, global sea level rise will continue over the long-term because of the accelerating melt of land-based ice and continued warming of the oceans.

Arguments


Hansen is not saying that he believes the 5 meter rise by 2100 is the likeliest outcome, just that it is not implausible and shouldn't be discounted. His general theme in this and other papers is that the official projections, like those in the IPCC, are too conservative presenting upper bounds. And even though we should be wary of focussing on short-term data, as you have done, it's worth pointing out that global sea level rise (and Arctic sea-ice decline) have so far been underestimated by the IPCC. Hansen may have a point; and he is aware of the limits of and arguments against his thesis, and has called for more study to test it. Whether consciously or not, you have misrepresented his argument here.
Here's the monograph underpinning the graph that's got your attention:
Hansen (2007): Scientific reticence and sea level rise
Read the whole thing for comprehension and context. It's not long.
"Summer melt on West Antarctica has received less attention than
on Greenland, but it is more important" says M. Mann in his reticence paper.
Because of ocean temperatures or are the other or more reasons?
Having said that, I think Greenland has more melting on its surface, and an observed flow acceleration already, so is not immune to significant melt!
#52 Barry
That's right, Dr. Hansen is not saying the 5 meter rise is the likeliest outcome, he just says it's plausible. I've run the numbers on his 5 meter every ten years rate doubling scenario and have determined that sea level would be going up at a rate of nearly one millimeter per day by 2100. Further comment is not necessary, it stands as its own testimony.
Mean annual rate of ice mass loss Greenland: 200-300 Gt
Mean annual rate of ice mass loss Antarctica: 70-210 Gt
Permafrost warming: 0.5°C to 2°
Freshening of part of the Arctic Ocean: 2006–08 increase 8400 ± 2000 km3
http://www.aoml.noaa.gov/phod/docs/Goni_etal_2011.pdf
I am prepared to worry about either or both but I still don't quite see why Antarctica should be favoured eventhough the WAIS is indeed perhaps more prone to melt at its base. Is there evidence (yet)? In favour of "Artic worries" might be the the permafrost melt run-offs draining into Arctic waters.
Am I being obtuse?
Ultimately, gradual acceleration is most likely with Greenland (and is observed), while West Antarctica has the potential for more sudden acceleration, but isn't presently losing mass so fast.
Either way, folks (are you listening, Steve Case?) rises on the order of 1mm/day are entirely possible, given that warming is something like an order of magnitude faster than anything in the paleo record. And hence, so are the possibilities of sea rise rates.
Personally, I'm not encouraging coastal real estate investments for anyone I know...
Understood ... collaps means exactly that. Nothing gently timeconsumig about it. (I got waylaid by language, like: economic collapse)
Thank you for clearinng the head. It isn't a story easily told to Monckton enthousiasts though (there are still a few left).
Yes, I read you post.
I am always interested in "contrarian" opinions ... they sometimes offer a glimpse of hope in - what I consider - a bleak picture.
Do you not agree with the figures or with the conclusion? Would you be kind enough to tell me why or refer me to something to read which reflects your view?
As Skywatcher says, I think the rate of sea level rise increasing more than 100 times the current value is incredible, "argument from incredulity" he says. I like to go to the source of these sorts of claims and run the numbers. I'm always in fear of getting the sign wrong or getting decimal places wrong or going off half-cocked. Somewhere up thread it was pointed out that Dr. Hansen's curve isn't an asymptote but sigmoid or geometric. They were right. Eventually it has to level off. I can't go on forever. Considering that the geometric nature of that curve hasn't started yet, see my post #2 on this thread; I wonder when it will start. I would think anyone would.
Here's an interview with Binschadler
Here's what's happened more recently at Pine Island Glacier
Not comforting...
David Stoney, thanks for the links. Always worth listening to what Bindschadler has to say about Antarctica, the first link is particularly informative.
According to the Church and White paper I've seen, the big jump in acceleration occurred in about 1925 for what reason I don't know.
From their conclusions: "From 1993, the rates of rise estimated from tide gauge and altimeter data (after correction for GIA effects) are about 3 mm yr^-1, faster than the quadratic (about 2.3 mm yr^-1) at this time." (the quadratic for the entire 20th century).
There are ~10 year +/- variations in the rate of sea level rise, but it's definitely accelerating if you look at all of the data, rising faster than quadratic in rate.
(Please tell me to go away if I'm too ignorant. I'll still read your comments trying to understand.)
Which is about 0.14 mm per day. This would be a catastrophic rate for people living near the sea. He noted that the ice sheets disintegrating at the time "were at lower latitudes than the ice that remains today and the period of rapid ice sheet disintegration was undoubtedly preceded by a period in which the ice was preconditioned for collapse". But, he points out climate forcing today far exceeds the forcing that drove melt-water pulse 1A. And, he said, sea level rise doesn't have to add up to 20 m to obligate scientists who expect it to happen to warn that an event anything like it would "wreak havoc" on civilization.
Hansen has said in the past that if the planetary energy imbalance is about 1 W/m2 and all that energy was going into melting ice it would raise sea level by about 1 m per decade. Obviously, an armada of icebergs shooting off Antarctica wouldn't have to melt to raise sea level.
Pfeffer told a story at the AGU this year about how the sea level rise threat isn't being fully grasped even by those he would have thought must be exposed enough to the data to get it. He said MOMA in NYC exhibited a model showing a New York that by 2100 had protected itself from 2m of sea level rise. He asked the designers, what was the plan for the ongoing steady or possibly accelerating rise after that - how was their design going to cope with another meter and another one after that? Blank stare.
[This is my first time posting a hyperlink using HTML. Forgive me in advance if I botched it...]
Tom Curtis at 13:31 PM on 15 February, 2012
Here's the latest from the CU Sea Level Research Group
CU Sea Level Research Group
It was updated a week ago.