Northern hemisphere warming rates: More than you may have heard
Posted on 14 January 2011 by muoncounter
Guest post by muoncounter
Winter is the time of year when denials of global warming seem to come from all sides. It is therefore a useful time to determine just what our current rates of warming are.
The very thorough SkS post Assessing global surface temperature reconstructions put the average global warming trend at 0.14-0.16 deg C/decade.
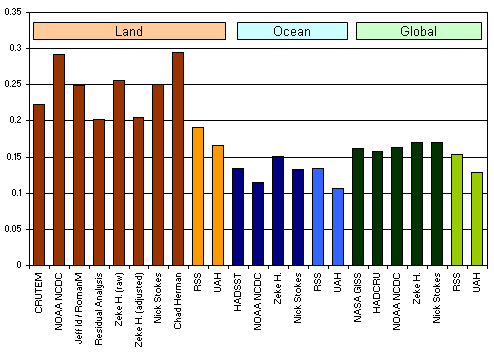
This rate is typical of the linear trend of modern temperature records which in some cases go back to 1880. And some skeptics take comfort in this rate, claiming that it is nothing to worry about. But is this rate of change an accurate description of what we are currently seeing?

--- NASA GISS, 7 Jan 2011
The northern latitudes (upper graph) have warmed more than the rest of the globe. This figure also makes it clear that the rate of warming since approximately 1970 is much greater than the linear trend over the entire record.
For the global average, warming in the last century occurred in two phases, from the 1910s to the 1940s (0.35°C or 0.63ºF), and more strongly from the 1970s to the present (0.55°C or 1.0ºF) at a rate of about 0.16ºC (0.3ºF) per decade. An increasing rate of warming has taken place over the last 25 years, and 12 of the 13 warmest years on record have occurred in the past 13 years.
A recent SkS article on
This begs the question: What is the recent (30 or more year) warming rate in other parts of the northern hemisphere?
A surprisingly straightforward way to analyze temperature trends over large areas is by comparison of the long term (100 year) trend to the more recent (50 year) trend. This Mapview interface to the HadCrut/GHCN data makes this task very easy. Individual 5x5 degree grids may be selected and a linear fit applied (as shown in Figure 1a). The time window may then be altered from this graph screen, giving a recalculated linear fit (Figure 1b) upon redraw. The slope of each linear fit in degrees C per decade, along with an estimate of statistical significance, is given in the right-hand panel of each graph.
Figure 1a. 100 year trend for 5x5 degree grid in central Europe(50-55N, 10-15E, roughly centered on Berlin)

Figure 1b, 50 year trend, same 5x5 degree grid

Table 1a shows the results of applying this process to 5x5 grids across a large part of

The arithmetic average of all these 100 year trends is 0.09 degC/decade.
Table 1b shows the trends for the same grids with linear fits for the interval 1960-2009:

The average of all these 50 year trends is 0.28 degC/decade. Red indicates greater than 0.35, yellow 0.3-0.35, green 0.25-0.3 and purple 0.2-0.25 degC/decade.

It is clear from this analysis that during the last 50 years, large parts of

Arguments


Of course our climate is being driven by human decisions - it's just that they are so far all pointed in a single overwhelming direction and cannot be reversed very quickly.
Anyway, back to resistance and support levels. Prior to the temperature increase mentioned in the original post since 1970, seasonal-adjusted temperatures (one must adjust for season since annual temperatures are cyclical and that annual cycle needs to be reduced in order to make valid comparisons between years) peaked mid 1944 (0.255), and had their low mid-1907 (-.51). Hence, not until the previous high was breached: mid-1981, did we start to experience actual warming (that be your BUY signal so to say) since prior to that the increase was still within the previously established band (if you'd buy it stock prior it would mean it would trade within that band and not reach new highs...). Why? One can't simply and arbitrarily pick a year out of an entire data-set, but one has to look at the entire data set as a whole. Hence, not since the early 80s did global temperatures show true global warming. This is a different way of looking at the data, and in fact more correct.
Given the nature of the temperature trend the last 100yrs, a linear trend may not be applied: their are trend reversals for example (just like stocks, and that's where the analogy kinda ends; namely if all stocks were to respond linear no trend analyzes tools were needed)
Ps: often stock prices go up or down for no apparent reason simply because they "have to" follow certain well-defined patterns, human-logic has nothing to do with that.
Pps: if stock prices on general weren't going up there would be no point in having a stock market what so ever (unless everybody was doing shorts and we'd then have a stock market that always trended down and thus the end result would be the same... temperature seems to follow the last 100 yrs the same trend: UP, hence suggesting using some stock-trend-analysis tools)
The graphs in this post are annual averages, so your seasonal concern does not apply. Monthly temperature anomaly data are publicly available in .txt format; have at it.
You entire approach is flawed, because it is based on the premise that climate variables are so numerous, complex and intricate that we can never understand them, as is the case with the thousands and thousands of stocks. But this is not the case in climate science.
There are known physical mechanisms that can be studied, understood, and incorporated into the model ("model" meaning the contemporary human understanding of the climate system, not "computer model," which is a specific, complex simulation based on that understanding).
It will probably never be possible to predict exactly what the temperature is going to be on any day or even month in any particular location, but the interconnections and reasoning are even now far more developed and mature than they can ever be for stocks. Short term, accurate predictions may never be possible, but long term trends are very predictable.
Your difficulty with the various periods of temperature changes are a perfect example. It is not fair, or accurate, to look at past periods (1900-1940, 1940-1980) and say that these have any bearing on the current situation. We know that CO2, based on physics and chemistry, will induce warming. We know that levels of CO2 did not start to reach a point to cause noticeable warming until the latter half of the 20th century. We know that aerosol pollution in the period from 1940-1980 suppressed temperatures when some warming should have occurred.
To ignore this knowledge and to look solely at trends (because in stocks there is no such knowledge to consider, at least, not in so cohesive and definitive a fashion) is simply flawed.
For example, I can say that this year will probably be a little bit cooler than last year - I say so because the dominant controller of uncertainty, ENSO, is starting at a strong La Nina, has an inbuilt lag of 6 months or so, and is unlikely to be inducing relative warming or ENSO conditions until at least late in the year. Solar activity is likely to be low-moderate and increasing, and unless we have a large volcanic eruption, there will be no volcanic cooling. The GHG forcing has of course increased a bit from last year. So with that information, global mean temperature is likely to be a little bit lower than 2010 due to La Nina, but with CO2 and solar offsetting the strength of La Nina. The uncertainty in this forecast is actually quite small, and the UK Met Office do a similar forecast every year with considerable success.
Projecting with this level of accuracy (~0.1C) more than a year ahead is near-impossible because you have no clue as to what ENSO will do, but your upper and lower boundaries will progressively rise, such that each decade is on average warmer than the last, and we can be confident that by the middle of the century (without mitigation) we will dream of years that are globally as cool as 1998 or 2010...
All based on processes, not blind trends, and much more reliable than the stock market!
Most of the trend analyzes tools (I suggested) are good for increasing markets (on average stocks need to go up, or there is no reason to own them), and therefore these tools could be applicable to temperature data too since that's been going up since 70s'-80s as well.
I appreciate the open-mind set to possible new ways... but why would you... you've got it all figured out.
As I said here, data are ready and waiting for you to get started. I'm sure we'd be interested in your results.
Again, it has NOTHING to do with how stocks compare to temperature, it has ALL to do in applying different analytical/mathematical/data tools in understanding what has, is and will happen. Isn't that what we are constantly trying to do. Isn't that the holy grail? Or are you telling me we've got it all figured out? If that be the case, we can all sit back, relax, and let it get nice and toasty.. or???
The Momentum indicator is a speed of movement (or rate of change) indicator, that is designed to identify the speed (or strength) of a price movement.
The fall and winter 2010 seasonally adjusted data are missing since there's not enough data yet to calculate seasonally adjusted values for those seasons.
Either way, if you'd plot this data and run a linear regression line; the trend is negative: -0.0042, but the r2 is also very low: 0.0042. Now a low r2 doesn't mean it's not significant (but that's a whole other story), what this tells me is that momentum on average over the last 10 years hasn't changed much, if any the momentum of temperature is on average downwards moving towards negative territory indicating to me that the rate of change in temperature has been slowing down slowly.
Now if this were a stock, I would start to consider selling it as it's upward movement (yes it's still going up) is starting to slow down (a term also called: going parabolic)
season/date momentum
2000.0 wi 11%
2000.3 sp -5%
2000.5 su -9%
2000.8 fa -10%
2001.0 wi -22%
2001.3 sp -25%
2001.5 su -42%
2001.8 fa 12%
2002.0 wi 21%
2002.3 sp 32%
2002.5 su 20%
2002.8 fa 28%
2003.0 wi 31%
2003.3 sp 4%
2003.5 su 0%
2003.8 fa 35%
2004.0 wi 41%
2004.3 sp 8%
2004.5 su -17%
2004.8 fa -21%
2005.0 wi 12%
2005.3 sp -11%
2005.5 su -6%
2005.8 fa 14%
2006.0 wi 38%
2006.3 sp 0%
2006.5 su -22%
2006.8 fa 1%
2007.0 wi 19%
2007.3 sp 18%
2007.5 su 18%
2007.8 fa 3%
2008.0 wi 10%
2008.3 sp -33%
2008.5 su -27%
2008.8 fa -29%
2009.0 wi 18%
2009.3 sp -1%
2009.5 su -23%
2009.8 fa 8%
2010.0 wi 14%
2010.3 sp -2%
2010.5 su -1%
2010.8 fa
2011.0 wi
Looking at the entire data set, momentum spiked in 1995 and has been decreasing ever since, with a big negative momentum in 2001.
Could somebody please inform me or point me in the direction of which mechanisms spread warming around the planet, and how quickly this is likely to happen?
e.g.How much warming is conveyed around the planet by ocean currents? Or how freely does CO2 spread around the entire planet? Since most fossil carbon is released in the northern hemisphere I can understand the north warming faster than the south, but how much lag should we expect before temperature rise rates in the south catch up with the north?
In contrast to CO2 (and Methane), aerosols are not long lived in the atmosphere so are largely concentrated in the in the hemisphere of their origin, ie, primarily the NH. That is one of the major reasons for the difference in behaviour between NH and SH in response to global warming.
The other major difference is that nearly all the worlds major land surfaces are concentrated in the NH. Because land warms much faster than the ocean, and because there is more land in the NH than the SH, the NH warms much faster on average than the SH. That pattern has been partly ameliorated by the high aerosol burden in the NH. As a result, during periods of rapid increase in aerosol load in the NH (most notably during the rapid industrialization that followed WW2 up until the clean air acts of the 1970's, warming in the NH was stopped or even slightly reversed. During periods of significant reduction in aerosol loads (the great depression) or stasis (1970's to 1990's due to clean air acts) the NH shows exceptionally rapid warming. This aerosol related pattern is not found in the SH:
As for major methods of moving heat around, they are, as you conjecture, the the ocean currents, but also the major atmospheric circulations, particularly the Hadley, Ferrel and Polar Cells. I believe Fasullo and Trenberth have a paper discussing this issue, though I am uncertain who was the lead author and do not have a link to hand.
[DB] Trenberth's publication record is here. Many PDF's available for download.
One way to look at atmospheric CO2 distribution is with Carbontracker. The CO2 'weather' maps and movies are entertaining, if not informative.
Many thanks. Looks like you've given me plenty of reading for tonight.
Truth is what we seek, and its much more complex than a simple bipolar "I accept" or "I reject".
Both sides have valid points.
From the graph, it shows both hemispheres have warmed. Therefore, global warming is a valid theory. In addition, there is enough methane on the bottom of the ocean to produce nightmare scenarios of runaway greenhouse effect.
However!
From data, we see that 67-80% of the warming we assumed was due to global warming was actually increased tilt of the Northern Hemisphere towards the Sun. So that leaves 2-33% for global warming.
So what does that mean?
It takes a lot more carbon to destabilize the planet than we thought. Thats a good thing, it gives us more time. But that doesn't mean we are not capable of destabilizing it! Just because we have much more leeway than we thought, there is absolutely no need to test the limits of what our planet can handle!!
[DB] "From the graph, it shows both hemispheres have warmed. Therefore, global warming is a valid theory."
Global warming is a valid theory from far more than that.
"From data, we see that 67-80% of the warming we assumed was due to global warming was actually increased tilt of the Northern Hemisphere towards the Sun."
Umm, no. The axial tilt of the Earth is unaffected by its temperature.
"It takes a lot more carbon to destabilize the planet than we thought."
This is an unsupported assertion. Please provide a supportative link.
Please note that the use of All-Caps (which I have reverted back to caps & lower case for you) is a Comments Policy violation. Please take the time to familiarize yourself with it. Thanks!
>> Global warming is a valid theory from far more than that. Agreed. Just 1 example.
>>>Umm, no. The axial tilt of the Earth is unaffected by its temperature.
Thats not what I said. Rephrasing: The increasing tilt of earth due to the 41,000 year cycle is responsible for 67-80% of heating we initially thought was due to global warming.
http://www.skepticalscience.com/LIG5-1110.html
"It takes a lot more carbon to destabilize the planet than we thought." This follows from the previous assertion backed by your own hosted link, that global warming is much *weaker* and therefore more carbon would be required to cause a destabilization event.
Please re-read http://www.skepticalscience.com/LIG5-1110.html. It does show the milankovitch cycle having quite an effect on *observed temperatures*, but not on climate change, again we agree. Yes, climate change is unaffected as far as we know.
I assert that Climate change from the data we have gathered *is not currently a major threat to humanity*.
However, my questions are these:
1. At what point would carbon levels have to rise to become a major problem?
2. If and when it does become a major problem, can humanity mount an effective resolution before its too late?
I think when generating Climate Change *policy*, its important to take those questions into account, not just whether or not climate change is a major issue today due to current observations.
[DB] "It is trending towards cooler conditions"
Wrt Milankovitch forcings, yes. But that ignores the very real and sizeable anthropogenic forcings which are unprecedentally warming both hemispheres today.
"Much scare tactic news comes from winter melt in the Arctic..."
Please avoid ideological labels like "scare tactics"
"...even though the whole year overall is cooler."
Umm, no. Use the search function again. The 80s were warmer than the 70s, the 90s were warmer than the 80s, the "Aughts" were warmer than the 90s, etc. This overall warming trend (not cooling) is well documented. Or take this portion to the It's cooling thread.
"Please re-read http://www.skepticalscience.com/LIG5-1110.html"
If you disagree with the linked post (which you should re-read), take that portion of the discussion there, where it is better-suited. Long-term forcings, like Milankovitch changes, will cause long-term changes in climate. Again, well-known.
"I assert that Climate change from the data we have gathered *is not currently a major threat to humanity*."
Unsupported and therefore baseless. And OT here. Please take this portion to the It's not bad thread.
"At what point would carbon levels have to rise to become a major problem?"
At no point in the past 800,000 years have atmospheric CO2 levels ever exceeded 298.7 ppm. The last time CO2 levels were this high there was no mankind. So who says that they are not too high already?
[Source]
"If and when it does become a major problem..."
IBID
"...can humanity mount an effective resolution before its too late?"
Who says it's not 40 years too late already (see the Climate Change: The 40 Year Delay Between Cause and Effect thread)? Even acting now and holding all GHG emissions to zero for the next 40 years, the Earth will continue to warm and the climate will continue to change accordingly.
The other "side" has bluster, obfuscation, misdirection and nonsense and tactics.
Trying to equate denial with the science, as if the two are on par with each other, is yet another common denial tactic.
The two sides do not have valid points. One side has valid points and an understanding of the areas in question, while the other side has nothing.
Arctic ice melt (which is a summertime thing) is discussed in great detail on a number of threads here - the data speak for themselves, no 'scare tactic news' needed. Please substantiate what 'overall year is cooler.' Claims such as these carry little or no weight in this forum.
"At what point would carbon levels have to rise to become a major problem?"
They already are. Read. Learn. Ask good questions. Read more.
"can humanity mount an effective resolution before its too late?"
The biggest hurdles to clear are those posed by the folks who blindly repeat 'no, it's not.'
So you come in and trumpet a lot of the same, old, tired misinformation and misunderstandings that hundreds before you have tried.
How are you different? How are you doing anything but contributing to the noise?
Let me answer the question for you. You're not. If you want to be, you need to drop your preconceptions, recognize that you are speaking from a position of extreme ignorance, stop arrogantly commenting as if you know something no one else does, and instead start reading.
This site hosts a wealth of information that you probably couldn't get through in a year (unless you have a whole lot of spare time on your hands). But you do need to understand every bit of it to truly understand what is going on, what the threats are, and who is lying and who is telling the truth.
If you are allowing yourself to be fooled by nonsense and misdirection, you only have yourself to blame. Everything you need to learn is here. If you learn and understand it all and still have doubts, then so be it. But by speaking from the position of extreme ignorance and confusion you are in now all you are succeeding in doing is advertising very clearly how ignorant you are and how many misunderstandings you have. Quite honestly, it's embarrassing.
I'm sorry to be harsh, but you have to understand how common and tiring your "insights" are.
Please, please, please take the time to study and learn first, and develop strong opinions second, rather than the other way around (or just starting with opinions and stopping there).
Ergo that claim is false.
While I agree that climate change is "not currently a major threat" in the very limited sense that if all CO2 emissions where to cease immediately, the danger to humans from CO2 would be limited, and partly balanced by some gains; still it remains the case that continuing business as usual for just 20 more years will take us to a situation in which climate change is a major threat, and continued BAU through to the end of this century would be catastrophic. Because of both social and thermal inertia, that means we need to act now.