Climate Science Glossary

Term Lookup

Enter a term in the search box to find its definition.

Settings

Use the controls in the far right panel to increase or decrease the number of terms automatically displayed (or to completely turn that feature off).

Term Lookup

Settings


All IPCC definitions taken from Climate Change 2007: The Physical Science Basis. Working Group I Contribution to the Fourth Assessment Report of the Intergovernmental Panel on Climate Change, Annex I, Glossary, pp. 941-954. Cambridge University Press.

Home Arguments Software Resources Comments The Consensus Project Translations About Support

Bluesky Facebook LinkedIn Mastodon MeWe

Twitter YouTube RSS Posts RSS Comments Email Subscribe


Climate's changed before
It's the sun
It's not bad
There is no consensus
It's cooling
Models are unreliable
Temp record is unreliable
Animals and plants can adapt
It hasn't warmed since 1998
Antarctica is gaining ice
View All Arguments...


Username
Password
New? Register here
Forgot your password?

Latest Posts

Archives

Watts Up With That's continued ignorance regarding Antarctic sea ice

Posted on 15 March 2010 by John Cook

Steve Goddard at Watts Up With That has it fixed in his mind that increasing Antarctic sea ice is caused by cooling. When I pointed out that the Southern Ocean where the sea ice forms is actually warming, Steve responded by labelling Skeptical Science a "scummy blog" and a partaker of "intellectual sloppiness". On a more positive side, he also dropped by to clearly articulate why he thinks the Southern Ocean is cooling. So let's examine what the empirical data has to say about temperature trends in the waters around Antarctica.

Steve's basis for Southern Ocean cooling comes from an NSIDC webpage, A brief look at Antarctic sea ice, which makes the following comment:

"A recent report (Turner, et. al., 2009) suggests that the ozone hole has resulted in changes in atmospheric circulation leading to cooling and increasing sea ice extents over much of the Antarctic region."

The NSIDC quote is unclear on whether the changes over "much of the Antarctic region" refer just to sea ice extent or to both sea ice and cooling. The next logical step is to examine the referred paper, Non-annular atmospheric circulation change induced by stratospheric ozone depletion and its role in the recent increase of Antarctic sea ice extent (Turner 2009). This paper uses climate modelling to explore how falling ozone in the stratosphere affects Antarctic climate and in particular, sea ice. The climate models find that falling ozone levels cause cyclonic winds which expose more surface water, leading to increased sea ice production. The only reference to temperature is where the models simulate cooler temperatures in one region of the Southern Ocean, the Ross Sea.

In Steve's defense, you can see how the NSIDC quote could lead one to think Turner 2009 had found cooling has occured "over much of the Antarctic region". However, a little investigation reveals that the paper doesn't offer empirical data on Southern Ocean temperature trends. What it does present is model simulated cooling in one region of the Southern Ocean.

So what do empirical observations tell us? Steve also cites a NASA map of temperature trends from 1981 to 2004. This map shows strong cooling over the East Antarctic continent. However, and more pertinent to sea ice trends, it also shows a strong warming over the Southern Ocean where sea ice forms.
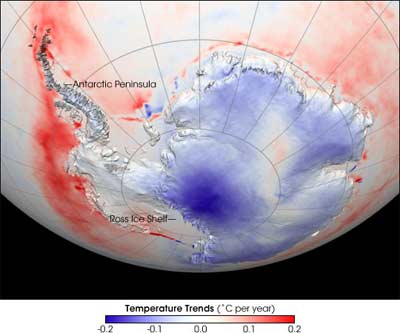
 
Figure 1: An older NASA image of temperature trends over Antarctica and the Southern Ocean. This image was first published on April 27, 2006 and was based on data from 1981-2004. A more recent version was published on November 21, 2007 (see Figure 2 below). The new version extended the data range through 2007, and was based on a revised analysis that included better inter-calibration among all the satellite records that are part of the time series.

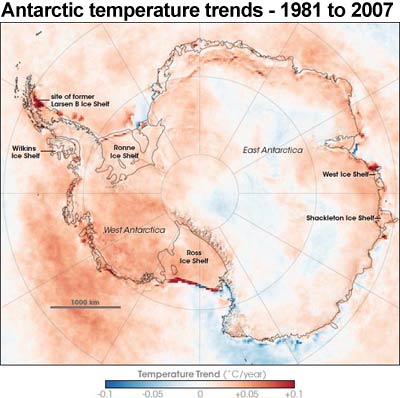
Unfortunately this map is no longer available on the NASA website but before the page went offline, Update: the page wasn't deleted, it was moved to this location (h/t to Robert Simmon). NASA posted a note stating that the temperature map had been updated with new data including better inter-calibration among all the satellite records (see Figure 2 below). The updated data showing more warming over the Antarctic continent. However, as far as sea ice is concerned, both maps shows a warming trend over the Southern Ocean.
Antarctic temperature trends 1981 to 2007
Figure 2: Antarctic surface temperatures as observed by satellites between 1981 and 2007 (NASA).

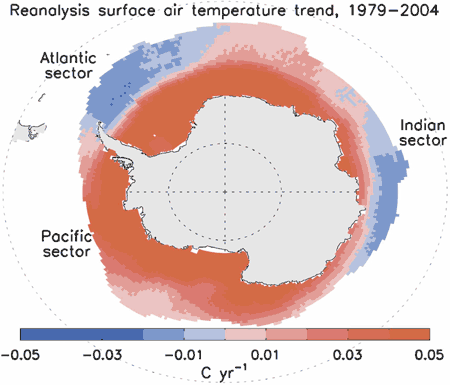
Perhaps Steve was distracted by the continental cooling in Figure 1 and didn't notice the warming over the ocean. In that case, I recommend the following figure from Increasing Antarctic Sea Ice under Warming Atmospheric and Oceanic Conditions (Zhang 2007) as it displays trends only over the ice-covered Southern Ocean - this is the region where Antarctic sea ice forms.
Antarctic Southern Ocean surface temperature trends
Figure 3: Linear trend (1979–2004) of surface air temperature over the ice-covered areas of the Southern Ocean (Zhang 2007).

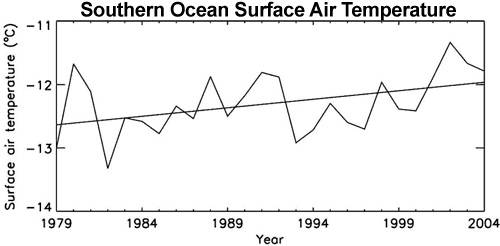
We see strong warming over most of the ice-covered Southern Ocean although there is also some cooling. What is the average trend over the whole region? The overall surface temperature trend over the ice-covered regions of the Southern Ocean shows a warming trend:
Southern Ocean surface temperature trends
Figure 4: Annual mean surface air temperature averaged over the ice-covered areas of the Southern Ocean. Straight line is trend line (Zhang 2007).

Oceanographic data also find that the waters in the Southern Ocean are warming. The waters of the Southern Ocean's Antarctic Circumpolar Current have warmed more rapidly than the global ocean as a whole. From 1960 to 2000, water temperature increased by 0.068°C per decade at depths between 300 and 1000 metres. This warming trend has increased to 0.098°C per decade since the 1980s (Boning 2008).

Hopefully, when presented with the full array of empirical data, Steve Goddard will no longer continue the false assertion that Antarctic sea ice is growing because of cooling. Observations clearly state otherwise - the Southern Ocean where sea ice forms is warming. By fixing on a simple yet incorrect interpretation, Steve is depriving himself and his readers of the opportunity to explore the complex and fascinating question of Antarctic sea ice.

0 0

Printable Version  |  Link to this page

Comments

Prev  1  2  

Comments 51 to 79 out of 79:

  1. #50, No comments were made here about the long term 'health' of frozen water. Is ice healthy and water sick? I tried to make the point that most of the comments on sea ice melting in the 07 event were related to currents not warm air. Several ice scientists have made this point and are in agreement with me, or I am with them if you prefer. I came to this blog after a comment was left at tAV and I saw the blog using the worst possible data for Antarctic trend above. It's a common mistake though because, how can people know that the data which was used isn't very good for trend. As far as sea ice in general though, I don't think we have much to worry about.
    0 0
  2. Jeff Id, @51 "I saw the blog using the worst possible data for Antarctic trend above." This is yet another puzzling and unsubstantiated statement-- the continental surface temperature data from the AVHRR sensors may have problems, we can probably all agree with that. The same is not true for the SST data for the polar oceans which are being discussed here. The reality is that Goddard is seems to be confusing temperature trends over the Antarctic specific reference to the the warming oceans surrounding Antarctica. And Goddard also shows an image on his WUWT blog post which is based(according to you) on the "worst possible data" -- have you posted at WUWT to tell him and Watts that?
    0 0
  3. Regardless of whether this trend represents cooling or warming, how does it ultimately affect the global sea level? Was'nt that the main issue after all?
    0 0
    Response: The main issue for this specific topic was the false statement "sea ice is increasing due to cooling". Both satellite, ocean floats & ship surface measurements all provide empirical evidence that the Southern Ocean is in fact warming, not cooling.

    The issue of temperature trends over the Antarctic continent and what's causing Antarctica to lose ice mass at an accelerating rate is a whole other can of worms.
  4. #52, Perhaps you could tell them for me.
    0 0
  5. 33.Ken Lambert at 01:39 AM on 17 March, 2010 Apologies Ken, I misread your post in undeserved haste. Air in contact will indeed take up some of the energy released, and PBs point about a thermostat, more like a regulator, working against cooling/heating when air temp moves below/above zero.
    0 0
  6. #53 RSVP, changes in sea ice by itself won't make any difference for global sea level -- the water is already part of the ocean, whether frozen or liquid (excluding grounded ice). Otherwise, what John said. Changes in the ice shelves off Antarctica, likewise, don't directly impact sea level. But the loss of ice shelves appears to have been followed by a systematic speedup of the glaciers that fed into the ice shelves, and that will affect sea level.
    0 0
  7. Further recommended reading for Steve Goddard would be Gille 2002, Kwok & Comiso 2002 and Fyfe 2006.
    0 0
  8. The link to Kwok & Comiso 2002 is wrong; it is here (or here in full).
    0 0
  9. Jeff Id writes: I came to this blog after a comment was left at tAV and I saw the blog using the worst possible data for Antarctic trend above. It's a common mistake though because, how can people know that the data which was used isn't very good for trend. This thread is about temperatures in the Southern Ocean around Antarctica. Those figures were posted because they illustrate the warming trend in the Southern Ocean. This trend is calculated using measurements of sea surface temperature from AVHRR. Far from being the "worst possible data" AVHRR is routinely and reliably used to retrieve SST for applications ranging from hurricane forecasting to fisheries management. Thousands of scientists in many, many fields use SST data from AVHRR. Your casual dismissal of these data is frankly ridiculous.
    0 0
  10. Jeff Id you have thoroughly confused me. Uou say things like I don't have time to find a source for you. I have looked at the NSIDC data in great detail though. , and then claim you can find a decreasing trend looking at 3 points. You have managed to get everyone OT whilst actively avoiding answering the post's main point on Goddard. All this doesn't help your case for people to take you seriously. I don't understand how you can hope to educate people if you can't explain, or back up your statements with peer reviewed papers that the ice experts you mention have written that agree with you. No offense, but the best scientists I have ever encountered are also very good at explaining things.
    0 0
  11. #59, There is nothing casual about my dismissal. It's based on a lot of hours with the actual data. AVHRR is probably a better measure over warmer areas than antarctic land, but over the land, it's just too noisy for good trends. I provided a link earlier. #60, I don't know what Goddard even said outside of this post. I'm sorry I didn't have time for discussion, I was at work. As far as a source for my statement that sea ice recovered further in 2009, I have several posts done by myself as well as pointed out that it's easy to figure out that there was a further recovery in the summer of 09 over summer 07 just by looking at the extent minimum. Because the winter freeze basically locks in multi-year ice in the center of the Antarctic, the extent minimum is closely associated with the amount of multi-year ice lost. -- It's during the melt when you loose more of the center see.... It's not like we need quantum physics. A substantial point of this post was that despite 'warming land'.... My assertion is that the land has not appreciably warmed. The trend over 50 years is about 0.06 C/Decade and not significant. I said sea ice doesn't respond much to the small warming and responds far more to current, I provided the video of sea ice as evidence. That's all. I enjoy coming to blogs with groups of deep believers and having a discussion once in a while, just to see how open minded they are. You guys haven't done too badly. Very minimal name calling and accusation. BTW, I do believe in CO2 warming.
    0 0
    Response: "A substantial point of this post was that despite 'warming land'...."

    Quite the contrary, the main focus of this post is looking at warming trends over the Southern Ocean - specifically, where ice-covered regions where sea-ice forms.
  12. JeffId..."You guys haven't done too badly. Very minimal name calling and accusation. " Compared with some of the comments I've seen of yours in more contrarian environments, you've done fairly well in that regard here. Unfortunately, there's still the persistent problem of unsubstantiated claims, which is arguably more disasteful than the ad hominens. Things like "I've blogged on it", "[people] agree with me", and "based on lots of hours with the data", all while constructing red herrings that divert attention from the topic, is good for show, and perhaps acceptable among contrarians, but isn't too useful and doesn't fly among critical thinkers. A good suggestion would be to start referencing actual data and papers and make an attempt to stay on topic.
    0 0
  13. Here are some recently published papers which do not rely on AVHRR data and thus provide independent corroborating evidence that the Antarctic Ocean is warming, - at all depths. For depths down to 1000m, we have "Decadal-Scale Temperature Trends in the Southern Hemisphere Ocean" Gille 2008 "Long-term trends in the heat content of the Southern Hemisphere ocean are evaluated by comparing temperature profiles collected during the 1990s with profiles collected starting in the 1930s. Data are drawn both from ship-based hydrographic surveys and from autonomous floats. Results show that the upper 1000 m of the Southern Hemisphere ocean has warmed substantially during this time period at all depths. Warming is concentrated within the Antarctic Circumpolar Current (ACC." We also have "State of the Antarctic and Southern Ocean climate system" Mayewski 2009 "The upper kilometer of the circumpolar Southern Ocean has warmed, Antarctic Bottom Water across a wide sector off East Antarctica has freshened, and the densest bottom water in the Weddell Sea has warmed". For deeper waters we have "Decadal warming of the coldest Antarctic Bottom Water flow through the Vema Channel" Zenk 2007 "From today's perspective the apparent stagnant temperature level until 1991 can be interpreted as a period of feeble rising in comparison with a perspicuous warming trend of 2.8 mK yr−1 in the following 15 years." and also "Recent decadal warming and freshening of Antarctic-derived abyssal waters" Johnson 2009 "Here we review evidence of recent decadal warming of these Antarctic-derived abyssal waters around much of the global oceans, and recent freshening of these waters in some basins near their source regions. We also attempt to assess the potential contribution of these changes to global heat and sea level budgets". And for a magnificent comprehensive recent overview of the Antarctic: Antarctic Climate Change and the Environment edited by Turner and many others, which also examines effects of warming such as recent Ice Shelf retreat (but be warned it is 20Mb)
    0 0
  14. Peter, that is nice -- and I myself posted a reference to analysis of ARGO data from the Southern Ocean on another thread recently -- but there is no need to cater to Jeff Id's absurd and completely unjustified dismissal of satellite-based sea surface temperature retrievals. Jeff, that's enough arm-waving. It's increasingly clear that on this topic you simply don't know what you're talking about. Google Scholar lists over 9000 references to papers with the keywords "AVHRR" and "sea surface temperature". That's not surprising, because retrieval of SSTs from AVHRR imagery using various multiwindow algorithms is one of the most robust and best-validated methods in remote sensing. The use of these data has been a staple of quantitative meteorology and oceanography for three decades. I am uninterested in assurances that "you've spent hours with the actual data". Many, many people spend their entire careers working with AVHRR derived sea surface temperature measurements. I find it particularly ironic that you'd describe this very robust and high-quality data set as "the worst possible" considering that as of a few days ago your own blog was promoting E.G Beck's ridiculous interpretations of chemical CO2 measurements. In light of that, I think that you might want to back up your claims here by references to the peer reviewed literature rather than by references to rather dubious blog posts, since a visit to your blog is more likely to decrease than increase your credibility here.
    0 0
  15. Mr. Hogarth, thanx for the references. May I add Schuckmann, JGR, v114, C09007, 2009, which, in Figure 5 clearly shows lowered salinity to great depths in the Southern Ocean in the period 2003 to 2008. Would anyone care to comment on any possible connection this may have to surface ice (or the lack thereof) ?
    0 0
  16. Sidd @ 65, This post might helpful
    0 0
  17. #62, It's also obvious that nobody can refute my claims b/c they are correct. #64, How so? I wonder what you consider arm waiving about the claim that sea ice has recovered in 2009-10 along with the point that the minimums support it? I refuse to live in a world where other peoples words govern the truth. There is no need to have a reference to a different scientist pointing out the obvious - they do exist btw but if you want the truth you can look them up. Again, this isn't a complex point I made. You have the key's, it's up to you to look in the door. On your comments about Beck, I'm not at all familiar with his work. Tony B did a post which contained some Beck work at tAV, so far I've been critical of his statements and his results at tAV. Also, I think you agree with me that Beck so far at tAV was unconvincing. I like to offer people like him a chance to defend themselves but there were several problematic statements made. 1- referencing a paper supporting his CO2 argument with the same sort of bad math that the hockey sticks were made from. 2- accepting high CO2 values in local regions which were well outside of nearby values. These were then described as having an effect on temp. Even the most egregious believer would admit that a local CO2 variance wouldn't cause large warming. 3- he said he was attempting to prove that CO2 levels were not created anthropogenically, this was as unscientific as some of the advocacy posts we see too much of. The data must lead, not the conclusion. I'm sure there are other aspects that bothered different people, but I wasn't impressed. He really didn't make a full defense/description though.
    0 0
  18. "#62, It's also obvious that nobody can refute my claims b/c they are correct." http://en.wikipedia.org/wiki/Negative_proof Falls into characteristic #5 in John's recent post.
    0 0
  19. #44 CBDunkerson at 03:40 AM on 17 March, 2010 Thanks for those links. JeffID was confusing me for a minute, but those links cleared the air.
    0 0
  20. Jeff Id at 16:24 PM on 17 March, 2010 This is semantics. I appreciate that you are very familiar with the satellite derived ice extent data. If by “recovery” you mean an increase in minimum extent over previous year (etc from 2007) then granted. By this criterion there have been several multi-year “recoveries” over the past couple of decades. However if by “recovery” we mean a return to anything close to average minimum extents over those couple of decades, then clearly this has not happened. The overall trend over past few decades has been significantly downwards, in extent, and in thickness. Anyway, shall we leave this for some future Arctic post? I have a new diverting challenge for your animation skills, related to this post: Antarctic Ice shelf retreat, suspected of being caused by Ocean warming (losing 25,000 square km from “permanent” shelves over past 50 years?) We now have access to high resolution AVHRR or MODIS imagery of Ice shelves. Not sure if this has been done, or if the image library is dense enough for movies, but if possible this would be worthwhile (and cool). It’s a great resource even as is.
    0 0
  21. "Of course winds and ocean currents play a role, but they are not the sole players in modulating Arctic sea ice. To suggest otherwise is being anything but honest. These are the same myths that keep getting trotted out by those in denial and blog commentators like Watts." What reviewed science says: "The future is undecided, as studies of the Florida Current suggest that the Gulf Stream weakens with cooling and strengthens with warming, being weakest (by ~10%) during the Little Ice Age and strongest during 1,000-1,100 years BP (Before Present), the Medieval Warm Period ." Bersch 2007- "Recent changes of the thermohaline circulation in the subpolar North Atlantic" - "In the upper layer of the Labrador Sea, the advection of warm and saline water dominated over the heat loss to the atmosphere and the freshwater gain from melting ice and precipitation in the NAO-low period, so that no accumulation of freshwater but an increase of the heat and salt contents were observed, as in the whole eastern part of the subpolar gyre." "A northwards branch of the Gulf Stream, the North Atlantic Drift, is part of the thermohaline circulation (THC), transporting warmth further north to the North Atlantic, where its effect in warming the atmosphere contributes to warming Europe. Other factors are also important, such as atmospheric waves that bring subtropical air further north, which have been suggested to influence the Climate of the British Isles more than the Gulf Stream. The evaporation of ocean water in the North Atlantic increases the salinity of the water as well as cooling it, both actions increasing the density of water at the surface." "In January 2010 , the Gulf Stream briefly connected with the West Greenland Current after fluctuating for a few weeks due to an extreme negative phase of the Arctic oscillation , temporarily diverting it west of Greenland." THC reaches out further to the north so ... How to explain on the basis of AGW theory? "These studies have advanced considerably the comprehension of the dynamics and functioning of the North Atlantic Bottom Water (NABW) circulation. In comparison therewith, little is known about the southern sources of deepwater (AABW). It is important to bear in mind that the thermohaline circulation is operated by both deepwater sources, and therefore, the deficit of scientific knowledge limits the complete understanding of decadal to millennial time-scale climate change (Seidov, D., 2000). An example of such a deficit is whether the NADW is the ultimate driver of the conveyor, and if additional variability is generated by freshwater impacts in the Southern Ocean (Seidov, D., 2000). A significant influence of the Southern Ocean is supported by several scientific lines of evidence. First, many examples of climate intermittency during the glacial cycles of the Pleistocene remain poorly understood, even though they seem to correlate with major deglaciations (Seidov, D., 2000) http://www.coastalwiki.org/coastalwiki/Thermohaline_circulation_of_the_oceans About THC at SH so little we know ... "Reality is more complex. Pressure gradients at depth, resulting from density gradients in the overlying waters, are the driving force in the equations of motion. As the density forcing occurs at the surface (see above), a subtle question is why the density differences and the circulation affect the whole ocean depth and are not confined to a near-surface layer. [6] showed that a deep circulation only arises when heating (buoyancy source) is at depth and cooling at the surface. The reason that there is a deep circulation after all is turbulent mixing , which brings down the heat on a time scale of ~1000 YEARS. [?!] It has been shown that in the long-term equilibrium the strength of the thermohaline circulation in models depends on the turbulent mixing coefficient [7], and that the energy required for this turbulent mixing comes to a large extent from the MOON [...] via tidal currents ([8])." Rahmstorf - http://www.pik-potsdam.de/~stefan/thc_fact_sheet.html Its "cherry picking"? Generally conclusion: Warming of the (part) southern ocean is not (can not !) evidence of AGW, or ... the lack of AGW ...
    0 0
  22. Jeff (#49), "I don't have time to find a source for you". Well, then given the existence of the several contrary sources I have already cited it comes down to your belief versus all available evidence. The available evidence shows that multi-year ice has continued to decline since 2007. Frankly, your wholly unsubstantiated belief to the contrary is not at all convincing. You say you have studied the matter and know better. I've studied the matter too... which is why I'm able to recall evidence I have seen in the past and quickly re-locate it with just a Google search. How is it that you aren't able to do the same?
    0 0
  23. #63 Peter Hogarth at 12:46 PM on 17 March, 2010 You quote Johnson 2009 as "evidence of recent decadal warming of these Antarctic-derived abyssal waters around much of the global oceans, and recent freshening of these waters in some basins near their source regions" Question: How can warming & freshening of abyss occur at the same time? An additional energy source is needed to drive deep mixing against density gradient to overcome gravity. Can you identify this source?
    0 0
  24. #64, How so? I wonder what you consider arm waiving about the claim that sea ice has recovered in 2009-10 along with the point that the minimums support it? Nice try, but no cigar. There are two completely different discussions going along in parallel here. One involves sea ice extent and the other the temperature trend in the Southern Ocean. On the latter, I addressed this in the previous thread (see references to Roemmich 2009, Mayewski 2009, and Convey 2009 in my comment here). Both ARGO data and satellite observations of sea surface temperature show that the Southern Ocean is warming faster than the mean of the oceans as a whole. This is the entire point of this thread -- Steve Goddard wrongly suggested that the (very small) increase in Antarctic sea ice extent indicates that the Southern Ocean is cooling, when in fact that increase is occurring in spite of the fact that the ocean around Antarctica is warming (and we have multiple lines of empirical evidence of that warming). As for the other point -- Arctic sea ice extent -- Peter Hogarth correctly notes that this is just semantics. You seem to be setting a very low bar for the use of the term "recovered." Monthly arctic sea ice extent reached a record low in September 2007. Since that date there have been exactly two more Septembers (2008 and 2009). Both of those were lower than all of the pre-2007 minima. Both of them were also well below the 1979-2006 trend line. So, in other words, from 1979-2006 September sea ice extent decreased, with a trend slope of -0.06 million km2/year. Since the 2007 record low, 2008 and 2009 did not "recover" to 1980s levels, they did not "recover" to 1990s levels, they did not "recover" to 2000-2006 levels, and they didn't even "recover" to the pre-2007 declining trend. Most of us try to use language as precisely as possible. You seem to be using the word "recovered" to refer to any 1-2 year rise. This obscures more than it illuminates. Which statement conveys more information: (1) Since 1979, September sea ice extent in the Arctic has collapsed (i.e., been lower than the previous year) 15 times, and has recovered (been higher than the previous year) 15 times. or (2) From 1979-2009, September sea ice extent in the Arctic has decreased by -0.08 million km2/year, and this trend has accelerated since 2001. Let's not hide the decline in sea ice extent by using vague and non-quantitative terms like "recovered" when all of the past three years were lower than every previous year on record.
    0 0
  25. For anyone who isn't sure whether to believe Jeff Id's claims that Arctic sea ice extent has "recovered", here is a link to the actual data at NSIDC. Here are the trends in sea ice extent, in million km2/per year, starting in 1979: Through 2001: -0.046 Through 2002: -0.051 Through 2003: -0.053 Through 2004: -0.055 Through 2005: -0.059 Through 2006: -0.060 Through 2007: -0.072 Through 2008: -0.078 Through 2009: -0.079 Even if Sept. 2010 sea ice extent were a ridiculously high 8.5 million km/2 (much higher than any previous year) the 1979-2010 trend would still be steeper than the 1979-2006 trend.
    0 0
  26. BP and others: The coincidence of warmer air next to increasing sea ice is explained by the heat liberated by the phase change of freezing which is roughly 334 kJ/kG of ice frozen. If someone can find the number of kG of extra Antarctic sea ice, the heat energy released can be calculated. Where this heat goes in complex circulations is uncertain - but if must go somewhere.
    0 0
  27. Mr. Albatross: The post you link to seems to indicate greater stratification in the Southern Ocean. How then, as Mr. Berényi Péter asks, can we have the freshening signature extend to great depth ? I suppose I am asking about coupled AOGCMs that reproduce the deepwater freshening. Would someone care to comment ?
    0 0
  28. Looking at Southern Ocean SST, where is it accelerating again? http://i49.tinypic.com/jt6zvn.png
    0 0
  29. Berényi Péter at 22:55 PM on 17 March, 2010 (and Sidd) Don’t forget that over most of the oceans the upper layers are reported as warming too (I will try to find some nice graphics on the temperature profiles in Southern Oceans, the numbers on graphics I have are too unreadable when fitted to 450 pixel images) eg Weddell Sea measurements, so I guess there is no need to invoke extra mixing processes. The freshening is believed to be due to extra ice melt run-off, which makes sense if you accept the reported mass loss from Antarctica, and loss of ice shelves in SH summer. From Kuhlbrodt 2007 “During the winter in the Southern Hemisphere, large amounts of sea ice are formed around Antarctica. Because of the rejection of brine they leave behind dense water masses near the surface. Large ice-free patches in the sea ice cover, called polynyas, play a central role in this process also because of strong heat loss. The buoyancy loss makes the waters sink to the bottom of the continental shelf. If the amount is large enough, it reaches the shelf break and flows down the continental slope. During this process its volume is increased significantly by entrainment of less dense waters, and bottom water is formed”. Also please appreciate that we are talking about small (but measurable) oceanic temperature changes, but in the huge oceanic volumes this represents huge changes in total heat content. Arkadiusz Semczyszak at 21:28 PM on 17 March, 2010 I can agree that we should not judge just by Southern Oceanic (or any regional) conditions in isolation, but the observations form more interlocking and corroborating pieces of the overall puzzle. As your final quote is from Rahmstorf 2006 let me quote Rahmstorf 2008 in the aptly titled “Anthropogenic Climate Change: Revisiting the Facts” “Ocean heat uptake (“thermal inertia”) leads to a time lag of the actual warming behind equilibrium warming. Ocean heat uptake is not just a theoretical or modeled phenomenon, but a measured fact. Data from about 1 million ocean temperature profiles show that the ocean has been taking up heat at a rate of 0.6 W/m2 (averaged over the full surface of the Earth) for the period 1993–2003” This is not cherry picking. This is the mainstream view of the Oceanographic community, though it is true that more deep ocean observations are needed, and this is covered in Garzoli 2009 “Progressing towards global sustained deep ocean observations”. Further independent evidence for global warming throughout the Oceanic volume (as well as the most recent direct measurement updates which attempt to correct for recently quantified bias and errors, covered here includingLevitus 2009, and Von Schuckmann 2009) comes from the steric component of sea level rise, covered here. Yet more independent evidence comes from decades of trans-oceanic acoustic transmission tests, as the average transit times depend on sound speed affected most significantly by average temperature across the transmission channel (I’ll get more on this, but Dushaw 2009 “A decade of acoustic thermometry in the North Pacific Ocean” gives some idea). As to thermohaline circulation (THC) and meridional oceanic circulation (MOC), and Oceanic (or atmospheric) currents in general, they re-distribute energy. In “On the driving processes of the Atlantic Meridional Overturning Circulation” Kuhlbrodt 2007, the main drivers for oceanic currents are given as: a) Surface winds transferring momentum. The winds are driven by temp differences, again re-distribution of energy. b) Tidal forces, believed to be a major factor in mixing. c) Thermohaline forcing, flow due to density differences So although currents may play a role in regional warming (for example) ice sheets in Greenland Hannah 2009 this should be thought of as re-distributing an increasing amount of thermal energy within the global system, as in Cunningham 2009 “The present and future system for measuring the Atlantic Meridional Overturning Circulation and heat transport” where it is estimated that the Atlantic Ocean circulation redistributes up to 25% of the global combined atmosphere-ocean heat flux. There is consensus that these are complicated processes, but the science and observations have been considerably added to, certainly since Seidov 2000. There are still questions of course! See Johnson 2008, “Reduced Antarctic meridional overturning circulation reaches the North Atlantic Ocean” Hofmann 2009 “On the stability of the Atlantic meridional overturning circulation”, Kuhlbrodt 2009 , “An Integrated Assessment of changes in the thermohaline circulation”. These show work is ongoing in further reducing uncertainties about transference of energy and possible future regional effects within the climate system, but they do not impact the conclusions about overall global net gain of energy.
    0 0
  30. #75 Ned at 23:12 PM on 17 March, 2010 "Here are the trends in sea ice extent" I have looked up average Arctic sea ice extent figures for September at IJIS (IARC-JAXA Information System) AMSR-E ice site. They have data only for 2003-2009. YEAR NSIDC IJIS delta 2003 6.15 6.13 +0.02 2004 6.05 5.96 +0.09 2005 5.57 5.53 +0.04 2006 5.92 5.91 +0.01 2007 4.30 4.38 -0.08 2008 4.68 4.84 -0.16 2009 5.36 5.38 -0.02 Looks like the difference between the two datasets is not random, NSIDC trying to emphasize the decline. Insight, anyone? BTW, both datasets lack error estimates, which is preposterous.
    0 0
  31. Berényi Péter writes: Looks like the difference between the two datasets is not random, NSIDC trying to emphasize the decline. Okay, that's a very serious accusation. I assume you have some evidence to back that up? As you know quite well, we generally try to avoid suggestions of dishonesty on this site. More to the point, Jeff's claim about "recovery" after 2007 isn't much better supported in the JAXA data you cite. 2008 and 2009 are still lower than any of the preceding years. 2009 does fall just about right on the 2003-2006 trend (which itself is based on only four points!) so the best that Jeff Id could say is that from 2007 to 2009 Arctic sea ice returned to its pre-2007 rate of rapid decline. That's a very strange use of the word "recovery" IMHO. The JAXA data show a trend of -0.20 million km2/year from 2003-present. The NSIDC data show a trend of -0.22 million km2/year for the same period. I think it's a bit odd that, given two very similar data sets, you're advocating to use the one that has only seven years of data instead of the one with 31 years. But there's little difference in the trend in either case. Both show a rapid decline. Using your preferred data set (JAXA) and projecting the linear trend forward gives an ice-free Arctic basin in Sept. 2034. I don't suggest that this is a good method (extrapolating from a seven-year trend) but it shows the foolishness of Jeff Id's claim that Arctic sea ice has "recovered". FWIW, I agree that it would be better for NSIDC and JAXA to include confidence intervals in the same data table.
    0 0
  32. Berényi Péter at 01:18 AM on 19 March, 2010 I'm not surprised by the slight differences. Different satellites, different sensors, slightly different resolution, and slightly different processing algorithms for definition of sea ice "edge". AQUA satellite (AMSR-E sensor) only launched 2002. Different groups processing same data also use slightly different algorithms. I'll chase up methods, error estimates etc, but I seem to remember they are public access. This debate is "Arctic" though...
    0 0
  33. Ned, I don't advocate anything. Just noticed the trend in differences (significant on 95% level, strange for such a short series). Neither I want to accuse anyone. It can be pure chance or instument ageing or whatnot. Anyway, the animation is awesome.
    0 0
  34. Peter (Hogarth) any thoughts on #78? Not sure where their reference to "accelerating" came from? Those data appear to be OI.v2. Not sure how they compare with ERSST.v3b, which now does not use satellite data. Anyhow, these GODAS data also show warming of the southern polar oceans: http://www.youtube.com/watch?v=osu4o-Fi38A The NODC 0-700 m OHC also show warming of oceans south of 60 S 0 0
  • Mr Hogarth writes, re: freshening in the Southern Ocean: "The freshening is believed to be due to extra ice melt run-off" I thought so too, but I could not find a calculation of the effect in the literature based on ice wasting in Antarctica. Could someone point me to a reference ? I have attempted the calculation and I find the GRACE estimated mass loss of land ice in Antarctica is too small to account for the freshening. von Schuckmann refers to Morrow (Prog. Oceanography v 77, pp 351-356, 2008) linking these changes to atmospheric circulation. The salinity anomaly is also seen in Figure 9 in Morrow(2008). I note that Morrow attributes the fresh water anomalies to changes in precipitation, while not ruling out increased sea ice melt. sidd
    0 0
  • Albatross at 04:58 AM on 19 March, 2010 I had downloaded and read all the docs on OI.v2 and ERSST.v3b when they revised them, but I haven't charted any data yet. I remember the sparse sampling and change from mainly vessel to mainly buoy for Southern Ocean. I also note that global SST charts on the webpage usually stop at 60 degrees latitude (N and S), which may be pertinent. The sea ice will also grow past -60 latitude in Sept/Oct in many places so probably SST needs interpreting with care? I'll look, time permitting. sidd at 06:41 AM on 19 March, 2010 Basal melt of Ice shelves is also mentioned in a few references, and is suspected as a factor in some of the shelf "break ups".
    0 0
  • Thanks Peter @86
    0 0
  • Berényi Péter writes: Just noticed the trend in differences (significant on 95% level, strange for such a short series). It might or might not be strange if it were significant at 95%, but it actually isn't. Slope -0.026 Two-tailed p-value 0.087 You're really grasping at straws here. The NSIDC data set is fine, the JAXA data set is also fine albeit a lot shorter, they both show declining trends in Arctic sea ice, and neither gives any validity to Jeff Id's claims about "recovery" unless you set an astoundingly low bar for the word "recovery".
    0 0
  • Prev  1  2  

    You need to be logged in to post a comment. Login via the left margin or if you're new, register here.


    The Consensus Project Website

    THE ESCALATOR

    (free to republish)


    © Copyright 2024 John Cook
    Home | Translations | About Us | Privacy | Contact Us