Watts Up With That's ignorance regarding Antarctic sea ice
Posted on 9 March 2010 by John Cook
In recent weeks, the Watts Up With That blog has focused several times on Antarctic sea ice. Specifically, Steven Goddard mentions that Antarctic sea ice has increased over recent decades, speculating this is probably due to cooling around Antarctica. In one post, he comments that "sea ice extent has been increasing over time around Antarctica – this is consistent with the idea that temperatures are cooling". In another post, he repeats this theme: "Antarctica is cooling and sea ice is increasing (makes sense – ice is associated with cold)". If his intent is to accurately describe why Antarctic sea ice is increasing, he would be better served first checking what observations and peer-reviewed research have to say on the matter.
The most common misconception regarding Antarctic sea ice is that sea ice is increasing because it's cooling around Antarctica. Goddard commits this error on several occasions. The reality is the Southern Ocean surrounding Antarctica has shown strong warming over the same period that sea ice has been increasing. Globally from 1955 to 1995, oceans have been warming at 0.1°C per decade. In contrast, the Southern Ocean (specifically the region where Antarctic sea ice forms) has been warming at 0.17°C per decade. Not only is the Southern Ocean warming, it's warming faster than the global trend.

Figure 3: Surface air temperature over the ice-covered areas of the Southern Ocean (top). Sea ice extent, observed by satellite (bottom). (Zhang 2007)
If the Southern Ocean is warming, why is sea ice increasing? There are several contributing factors. One is the drop in ozone levels over Antarctica. The hole in the ozone layer above the South Pole has caused cooling in the stratosphere (Gillet 2003). A side-effect is a strengthening of the cyclonic winds that circle the Antarctic continent (Thompson 2002). The wind pushes sea ice around, creating areas of open water known as polynyas. More polynyas leads to increased sea ice production (Turner 2009).
Another contributor is changes in ocean circulation. The Southern Ocean consists of a layer of cold water near the surface and a layer of warmer water below. Water from the warmer layer rises up to the surface, melting sea ice. However, as air temperatures warm, the amount of rain and snowfall also increases. This freshens the surface waters, leading to a surface layer less dense than the saltier, warmer water below. The layers become more stratified and mix less. Less heat is transported upwards from the deeper, warmer layer. Hence less sea ice is melted (Zhang 2007).
Antarctic sea ice is complex and counter-intuitive. Despite warming waters, complicated factors unique to the Antarctic region have combined to increase sea ice production. The simplistic interpretation that it's caused by cooling is false. It's unfortunate that Steven Goddard has publicly speculated on why Antarctic sea ice is increasing without fully investigating what observations and research have found. The result is that many readers at Watts Up With That have been misled on the true and fascinating nature of Antarctic sea ice.
Note to regular readers: yes, I know I'm rehashing content from Antarctic is gaining ice. Sometimes a little repetition is required for the message to sink in.

Arguments


Okay, there are two parts to that post, one about the trend in sea ice and one about the mechanisms responsible for its apparent increase.
In your comment that started this off (#7) you wrote: IPCC AR4 WG1 4.4.2.2 Figure 4.8 caption says "Antarctic results show a small positive trend of 5.6 ± 9.2 × 10³ km2 yr–1 [...] the small positive trend in the SH is not significant" which is not true.
Antarctic sea ice extent is increasing (for whatever reason) and the trend is significant.
You later (comments 82 and 90) specified that you were referring to April and May.
So I looked at southern hemisphere sea ice extent from the NSIDC database in April, both 1979-2005 (since that is the period used in the IPCC AR4 figure you claimed was false) and 1979-2009 (for completeness).
The 1979-2005 period gives a positive trend that is not significant at 95%, with a two-tailed p-value of 0.084 and a confidence interval of -0.0032 to +0.0481 million km2/year.
The 1979-2009 period is almost significant at 95% (two-tailed p-value of 0.058, confidence interval -0.000776 to +0.0452).
For May, I agree that the trend is significant at 95%, both for the time period used in the IPCC figure and for the period through 2009.
That said, if one were going to be very precise about this one would want to correct for temporal autocorrelation in the data. My guess is that's not a large effect at the annual timescale in this system, so it would probably either have no effect or only deecrease the significance of the trends slightly. The April trends are already not significant, and I doubt an autocorrelation correction would change the May trends enough to make them non-significant.
Again, though, the details of all this are essentially irrelevant. As I said in comment #84, I'm not arguing that there hasn't been a small upward trend in southern autumnal sea ice. There has! This whole thread is about explaining the reason for that trend.
One possible explanation would be that perhaps the Southern Ocean is cooling, leading to more sea ice in autumn. However, we know from multiple different lines of evidence that the Southern Ocean is actually warming, not cooling (in fact it's warming faster than the global ocean trend). Thus, we can reject that explanation.
So the point of this thread is to discuss alternative explanations. The generally accepted one, as discussed in Turner 2009 and other papers, involves the effect of ozone depletion on the Southern Annular Mode and circulation patterns in the southern circumpolar atmosphere.
This brings us to the second part of your post #90. In this, you construct a rather strange straw-man argument, involving a claimed decrease in the extent of the ozone hole in 2002 and a similar claimed decrease in the extent of sea ice. You then do a nice job of knocking down that straw-man argument by pointing out that the ozone image you were looking at was from Sept-Nov while the ice extent was from April-May.
That might be an insightful point if someone were claiming that the correlation between the small dip in 2002 sea ice and visual examination of a map of ozone depletion in late 2002 was proof of the ozone/sea ice connection. But nobody except you has suggested such a thing.
Good question. One could imagine three different types of change:
(1) The spatial distribution of temperatures and/or precipitation changes markedly, but the global mean temperature stays the same.
(2) The spatial distribution of temperatures and/or precipitation changes markedly, and the global mean temperature increases (or decreases).
(3) Every place on Earth experiences warming (or every place on Earth experiences cooling).
I think most people would agree that (3) could easily be called "global warming" or "global cooling", and that (1) should be called "climate change" rather than "global ___". As for case (2), which is what is actually happening, I think that both labels "global warming" and "climate change" are appropriate, if imperfect.
RE: your specific comment about negative feedbacks, I don't think most people working in the field today expect that a slowdown in the meridianal overturning circulation (Wally Broecker's conveyor belt) would produce enough cooling to counteract the warming that led to that slowdown. It would perhaps lead to slower warming in Europe than elsewhere, but on balance the Earth would still be warming.
As for albedo, the changes in snow/ice cover in Antartica are small compared to the loss of Arctic sea ice. Don't forget to average over the globe.
I appreciate you answering my question, especially as you diagram the three possibilities so candidly. This helps facilitate the discussion in a meaningful way. As far as comparing options 1 and 2, simply based on the historical evidence of ice age cycles that option 1 is improbable. I would also assume that most people "out there" think of global warming as option 3, making it difficult to sustain AGW when, for instance, Venice is getting snow in mid March.
Jeff Freymueller
Thanks for your response as well, which coincides generally with Ned.
This mass messaging is quite simple. "That the planet is warming due to energy trapped by the additional greenhouse gases produced by burning fossil fuels, and that this is the most convenient truth until proven otherwise by the same folks that have concocted this theory. Your survival depends on this, so please be understanding about all the measures that will be taken."
By the way, I did see a new field of solar panels going up. Reminded me of strip mining. An entire mountain was bull dozed. All vegetation removed.
I agree that many people probably do believe this. It's a direct result of the way that "skeptic" blogs such as WUWT treat every snowfall and cold-snap as proof that the world isn't warming. In the terms of my options (1), (2), and (3), they're knocking down the straw man (3) and telling their readers that this disproves global warming.
In contrast, science-based blogs try to make it clear that the real-world global warming is (2).
Of course, in the worst case scenario we won't lift a finger to curtail CO2 emissions. In which case, after a couple of centuries of burning through all the oil, coal, and tar sands we can get our hands on, we'll blow right past Type 2 global warming and into Type 3. By that point, it will be too late.
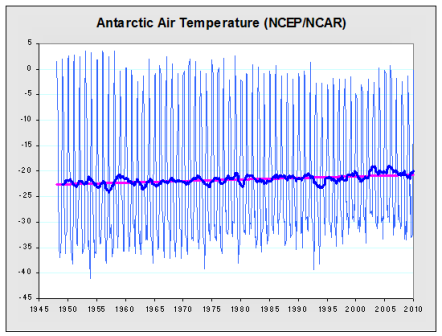
The data is NOAA: http://www.esrl.noaa.gov/psd/cgi-bin/data/timeseries (-70 to -90 latitude loaded). These are monthly values so the summer daily values will be a bit higher judging by the Northern Hemisphere monthly/daily data. Anyway, the chart gives the idea, (temp in summer can get above freezing)...
90.Berényi Péter at 11:18 AM on 11 March, 2010
Nice graphics! the 2002 minimal Ozone hole is curious, but there's bigger dips/peaks in sea ice elsewhere. Though there is good evidence of significant Antarctic sea ice reductions in the 20th century overall, the small upwards trend over past 30 years is the interesting factor.
Antarctic Summer Sea Ice Area
Prof. Roper surmises from his exercise that Antarctic sea ice should shortly be heading into decline, but he adds the caveat, "Many more data are needed in the future to make this date more certain."
Dr. Roper does some other fun derivations elsewhere on his site, mostly based on paleo data. Interesting to think about. He has a large collection of ruminations on global warming from a physicist's perspective here:
Global Warming Web Pages by L. David Roper
I hope Dr. Roper will continue to post here.
Yeah, the thing about curves is they don't have any notion of where to end. I do think that fitting curves to existing data is an interesting exercise, thought provoking, as long as one does not put on skis and follow the line wherever it leads, no matter how far.
It says (updated from Comiso, 2003) in the text.
"The trends are all negative in the northern hemisphere and all slightly positive in the Southern Hemisphere, as has been reported previously [Parkinson et al., 1999; Zwally et al., 2002], but with slightly different values. This phenomenon suggests that the climates of the two hemispheres are not closely coupled. The results, however, are consistent with predictions from some Global Circulation Models [Manabe et al., 1992]..."