Climate Science Glossary

Term Lookup

Enter a term in the search box to find its definition.

Settings

Use the controls in the far right panel to increase or decrease the number of terms automatically displayed (or to completely turn that feature off).

Term Lookup

Settings


All IPCC definitions taken from Climate Change 2007: The Physical Science Basis. Working Group I Contribution to the Fourth Assessment Report of the Intergovernmental Panel on Climate Change, Annex I, Glossary, pp. 941-954. Cambridge University Press.

Home Arguments Software Resources Comments The Consensus Project Translations About Support

Twitter Facebook YouTube Mastodon MeWe

RSS Posts RSS Comments Email Subscribe


Climate's changed before
It's the sun
It's not bad
There is no consensus
It's cooling
Models are unreliable
Temp record is unreliable
Animals and plants can adapt
It hasn't warmed since 1998
Antarctica is gaining ice
View All Arguments...


Username
Password
New? Register here
Forgot your password?

Latest Posts

Archives

Review of Rough Winds: Extreme Weather and Climate Change by James Powell

Posted on 23 September 2011 by Anne-Marie Blackburn
Book cover for Rough WindsThe perennial question following any extreme weather event is whether climate change is responsible for the event in question. Until recently, the short answer to this question was 'No' but recent findings suggest that this answer needs to be refined. It is still not possible to state categorically that climate change has caused a specific event, and natural variability continues to play a key role in extreme weather. But climate change, through rising temperatures and water vapour levels for example, is changing the odds of extreme events occurring. The last couple of years have certainly seen a large number of extreme events take place, from the floods in Queensland, Colombia, Pakistan and Sri Lanka, to the droughts in Texas, Australia, China and the Amazon, and record-setting high temperatures in countries that cover approximately one-fifth of the Earth's surface. Wildfires, snowstorms, tornadoes and hurricanes have also made the headlines in a number of countries. This has led to the appearance of new expressions: 'global weirding' and 'a new normal'.

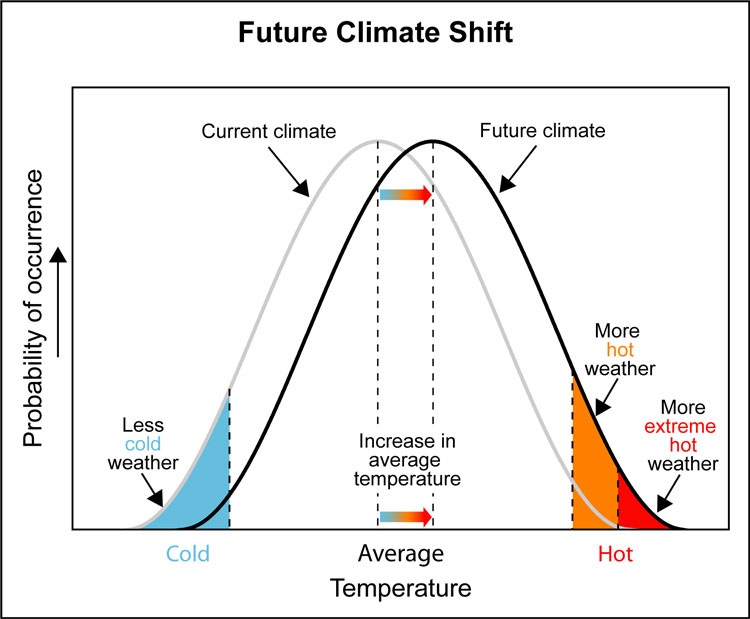
It is within this context that Dr James Powell, whose book 2084: An Oral History of the Great Warming is reviewed here, aims to find out whether there is now a 'preponderance of evidence' showing that climate change is truly under way, a situation which he argues warrants a response. He focuses on extreme weather for a number of reasons. Weather is what we experience on a daily basis and is therefore more tangible than some vague notion of climate change in distant countries or futures. Additionally, extreme weather can prove very costly in terms of lives, livelihoods and infrastructures, and we therefore all have a stake in taking preventative measures. Finally, and perhaps most importantly, increases in the occurrence of events such as extreme temperatures are the best harbingers of climate change. This is clearly illustrated in figure 1 below. With this in mind, the author frames the issue as one of risk management and compares it to the insurance industry: we take out insurance not because of a high probability of fire or burglary, but because we stand to lose a lot if we are uninsured and such an event takes place. Similarly, Powell argues, increasing and/or intensifying extreme events would require action to be taken - we should aim to 'avoid the unmanageable and manage the unavoidable'.
Climate shift

Figure 1: Bell curve showing how an increase in average temperatures leads to an increase in hot and extreme weather. Note also that this doesn't mean there'll be no more cold weather: these cold events will become rarer but will not disappear. Source: US Climate Change Science Program / Southwest Climate Change Network 

After providing some background on recent events in the prologue, the author explains the science behind climate change and its possible links with extreme weather. This is an important step as it begins to answer the question 'Why are scientists predicting that global warming will cause intensifying and/or increasing extreme weather events?' This then provides a platform from which to analyse and look at the specifics behind recent events. In doing this, Powell shows how science proceeds from a testable hypothesis whose basis, in this case, lies in basic physics: rising temperatures should lead to an increase in water vapour levels. In turn, this additional heat and moisture should provide the perfect setting for the development of more, and more intense, storms. And so the stage is set: the hypothesis and assumptions are described and the case can now be built block by block.

The book is then organised in short chapters that each tackle a specific event or related extreme weather events - heat, drought, fire, rain and snow, floods, tornadoes, and hurricanes. Powell is meticulous in his research and these chapters read like investigative reports, looking at events and placing them in their historical context, before looking at the evidence that helps determine whether climate change has played a role. And like all good scientific reviewers, the author is not afraid to discuss scientific uncertainties and diffculties which make attribution studies such a complex task. But this is more than a simple description of the mechanisms behind extreme weather. Powell discusses the resulting damage and suffering inherent to such events. This helps bring the message home: extreme events are more than abstract physical phenomena. They are some of the most destructive disasters than can hit you, and their toll can reach tens of thousands of deaths and billions of US dollars. If the overall impact of events paints a bleak picture, the personal stories are particularly harrowing. Unlike 2084, these are events which have already taken place and wreaked havoc on the lives and livelihoods of thousands of people. And Powell's personal account of the 1988 Yellowstone National Park fires somehow makes these events more tangible, particularly if you are lucky enough to never have faced such destructive forces.

Powell also addresses issues that have arisen, or could arise, from the responses and management of extreme events. For instance, the action taken by the Army Corps of Engineers to manage the 2011 Mississippi floods could have led to the river reverting to its alternate course, through the Atchafalaya Basin, an event which would have considerable impacts on downstream communities and shipping. Clearly, this did not happen this time, but should we run the risk of causing such a change again, or do we need to think of alternative solutions to manage future problems? Also, during the heatwaves in Europe (2003) and Russia (2010), people lost their lives because they did not know that they had to drink more water in warmer conditions or because they drowned after drinking alcohol. This clearly shows that simple measures, such as awareness campaigns, could yield significant results and allow us to protect ourselves against the worst effects of such events, which helps to address the issues behind 'managing the unavoidable'.

But the overall strength of his argument lies perhaps in the evaluation of predictions made by climate scientists. With rising water vapour levels now observed, is the expected increase in extreme precipitation events already noticeable? It appears so: analyses of US and northern hemisphere precipitation show just this. Similarly, changes in the timing of snow melt, and rising sea-surface and air temperatures have been implicated in wildfires, droughts and heatwaves. But at no point does Powell claim that climate change alone is responsible for all events in recent years. This is particularly true of tornadoes and hurricanes. Not only does he clearly state the uncertainties, he also points out other factors, such as river engineering projects, La Niña and forestry practices, that have played major, sometimes predominant, roles in some of the events he discusses. This is openness at its best, a way of pre-emptively answering those critics who tend to cherry-pick details and miss the whole picture when evaluating climate-related evidence.

So does Powell manage to answer the questions he sets out to answer, namely whether there is now a 'preponderance of evidence' that climate change is under way? He certainly makes his position clear: for him, there is already enough evidence to take action and prevent the worst from occurring. It is difficult to argue against this. Of course, extreme events have always occurred, without the help of humans, but it is the number of recent record-breaking events or worst events in decades that should make us stand up and take note. These come on top of trends that show rising global temperatures, melting Arctic sea ice, retreating glaciers, rising sea levels, and migrating species. All of this is consistent with what we expect from climate change. So do we now wait until we have absolute proof, which probably means leaving it too late to 'avoid the unmanageable', or do we start addressing the root cause of all these changes?

Rough Winds was released as a Kindle Single and is currently at #3 under Earth Science. The good news is that you don't need a Kindle to read it - you can download apps to read it on PC, Mac, iPhone/iPad and Android. With the Horn of Africa and Pakistan experiencing severe drought and floods, respectively, as well a new La Niña possibly on its way, this is a timely book that I thoroughly recommend.

Download Rough Winds from Amazon.

0 0

Printable Version  |  Link to this page

Comments

Prev  1  2  3  4  5  Next

Comments 151 to 200 out of 235:

  1. muoncounter @ 149, I did answer you question in 144. "I would not disagree that the drought in Texas or Lousiania is extreme (well outside the normal). Nor severe tornadoes in 2011. Nor even that 2010 and 2011 had extreme weather events occur. Yes they did have extreme weather events." The answer is yes.
    0 0
  2. Norman#151: ""I would not disagree that the drought in Texas or Lousiania is extreme (well outside the normal)" I beg pardon. I must have misunderstood that reply, as well as these items, among others: a. your statement "2011 was not much different than 1980 in this area" b. your comparative "Maybe you can't stand it when the temp should be 88 (normal) and it is now 89 on a regular basis. For you this would be significant. Maybe not for others." c. your generalization "There have been some extensive and extreme droughts over this time period as well as some very wet years that cover large areas." d. your dismissive "My perception is that weather extremes take place every year. ... It is only the globalization of media that exposes so many areas extremes to us in a rapid fashion that we feel things are getting really bad, even though they may not be." I must excuse myself from this conversation until such time as I can better understand these kinds of statements. Perhaps it will all become clear when Eric reads the book and reports back.
    0 0
  3. Norman, I can't believe you don't see that what you are doing is cherry-picking, and finding occasional anecdotes to support a very weak position. I'm glad to see you finally admit that 2011 was extreme in Texas - it actually fitted every definition of the word extreme, yet you clung to a single reporting measure (days over 105) to try and claim it wasn't, while you ignored that it was record-breaking in pretty much every single other category. BTW, the UK just broke it's all-time October high, with 29.9C. Probably won't kill people, but there'll be some very confused animals and plants wondering what season it is, and it still qualifies as 'extreme'. Extremes in spring and autumn (UK had both this year) don't hit the news quite so much though, do they?
    0 0
  4. Yesterday's climate summary from NWS State College (central PA):
    Add another one to the record books for central Penn...Earliest observed snow accumulation at several coop sites across the Allegheny Plateau this morning. 1.2 inches at Philipsburg and 0.7 of an inch at Laurel Summit. trace of snowfall here in State College and Altoona...se across the higher terrain of Huntingdon county /reported by NWS personnel/. Monthly climate summaries for MDT/IPT highlighted by the wettest september ever on record at both sites. With a monthly total rainfall of 18.43 inches...September 2011 is now the wettest September ever on record at Harrisburg. The previous wettest September was in 1975...when 14.97 inches of rain fell. With a monthly total rainfall of 15.97 inches...September 2011 is now the wettest September ever on record at Williamsport. the previous wettest September was in 1999...when 12.60 inches of rain fell.
    [My notes: converted from upper case. Accum. snow was generally above 2k feet elevation. Culprit was upper low 5 sd's below normal for this time of year, record low max temps in my locale, No. VA]
    0 0
  5. Will the record rain lead to future flooding? Note that the rain is due to weather the entire month, and follows previous flooding, while the snow is due to a single day event.
    0 0
  6. The bulk of the rain was closer to the beginning of Sept but the saturated ground could certainly contribute to future flooding. As for the snow and cold rain, seems like the most unusual factor is how early in the season this strong, stalled upper low is. There was no snow or much cold upstream from us in the upper midwest, the cold came down from aloft with the heavier precip (isothermal from the surface through 850mb).
    0 0
  7. Got my kindle and created an "AGW" collection (only 1 level of hierarchy?) and bought the the Rough Winds book (do they keep my CC on file, because it didn't ask for one?). I thought the book had a good balance of scientific detail most of the time while maintaining a riveting story line. The political references are ok, the characterizations (e.g. Inhofe) are accurate, but I would have left out the religious references, some readers might take offense. Regarding Hurricane Irene he states "First, Irene dumped far more rain and dumped much of it farther north than forecaster had predicted: 20 inches in Virginia Beach and enough to cause the worst flooding in Vermont in 80 years." That is not really true, the forecast was for 6-10 inches with isolated maximum amounts of 15 inches, but the key factor that was not forecasted was the strength of the upper trough along the east coast that enhanced the rainfall amounts and directed the storm further west than forecast. But the forecasts were quite accurate overall, see http://www.nasa.gov/images/content/583120main_irene_rain_20-29aug11.jpg as compared to the 6-10, isolated 15 forecast. He asks us to imagine if warmer SSTs from previously emitted CO2 had pushed Katrina to a category 4 or 5 storm. Not hard to imagine at all since that is what happened for a substantial period of time before landfall. Perhaps he meant to say when making landfall, but cat 4-5 was also the prediction for landfall. The dynamics of strong TCs are not controlled by SST over the short run. He said it better towards the end of the hurricane discussion "global warming makes such events more likely" (but other factors can easily get in the way) Some good points are his mention of both prominent 2007 hurricane count reanalyses. The flooding section is good in general and mentions the effects of levees and plusses and minuses of damming. One small note I would have added about Minot was the flood water release treaty that prevented the Canadians from emptying reservoirs when it could have done some good (part of the reason that Minot thought they would be safe). I was a bit dismayed that there was no mention of UHIE in the high/low records ratios. But worse than that was at the end where the he states "What else but global warming can explain record temperatures set when the sun is not shining?". (Answer in part: UHIE) Also there is a long list of events that the earth has experienced that are "exactly the events that scientists have predicted global warming will make more common and more extreme". I would get rid of the word exactly or trim the list or give the full range of predictions which may be less in some cases. But those are mostly pet peeves.
    0 0
  8. In the same box as the kindle was the Roger Pielke Jr book. After just 45 pages so far, I have a pretty good idea of where he is going. There were several forward references so far to chapter 7 (and no others) which is titled "DIsasters, Death and Destruction". There is quite a bit of reference to the Pielke Sr theme of anthropogenic factors other than CO2. Some telling phrases so far "Efforts to increase intensity [of public support] whether by hyping the science or seeking to scare people by apocalyptic visions of catastrophe, are more likely to turn people off than to motivate them to become politically active." and "...those advocating action too often focus on trying to get everyone to think alike, forgetting that it is how people act, not what they think, that in the end matters the most." and 'In the hyperpoliticized world of climate politics, any emphasis on factors beyond carbon dioxide (and other greenhouse gases) is, for some people, a distraction." In short, an argument for a narrow form of political pragmatism that appears to address two straw men of CO2 overemphasis and climate catastrophe rhetoric. While some catastrophe rhetoric is indeed present, a much stronger case has been made for the sheer magnitude of the inevitable CO2 rise itself, far beyond anything in experienced in the present geologic configuration. But I will give him the benefit of the doubt and keep reading.
    0 0
  9. Eric (Skeptic) @ 154 I believe most of the September rain records in Pennsylvania was because of the renmants of Tropical Storm Lee. source.
    0 0
  10. Sphaerica @ 147 I went to Barnes and Noble to look for the book but found out it is an ebook. It is not expensive, only $0.99. I do prefer to read a book rather than on a computer screen. I generally print the article links (peer reviewed papers)and then read them. "Second, you also recognize that you've been following an anecdotal argument to a statistical question. You admit that the question becomes one of average frequency and intensity, and yet you've been arguing it by cherry picking events from the past, as if finding a previous, intense drought or hurricane invalidates the intensity we see today." It would not invalidate the intensity of an extreme event today. That is not my point in finding historical extremes. The content of this thread is not that there are extreme weather events happening today (and tomorrow). It is that these events will increase in number, intensity and frequency of return. "Third, you know that we've already been through a variety of measures of extreme event intensity (dollars in damages, loss of life), and you know that there are many obscuring factors (such as changes in population, early warning and engineering improvements, total property value exposed to danger, changes in reporting methods, etc.) that make comparisons over long time periods difficult." Using monetary values to determine trends in extreme weather event number does not seem the best choice of systems. It is a very important topic and one that should be analyzed in a proper scientific fashion. With computers and advanced equipment the task will be much easier today than before. Rather than use a Munich Re disaster chart as evidence why not get direct measurements that do not have a floating variable? We do very well with hurricanes, tropical storms, and tornadoes. Now we can also do it with Supercell thunderstorms. Each can be logged based upon various factors. Height of storm, area storm covers, total rainfall amount of storm, duration, location, tornadoes spawned by storm and their intensity, hail size and duration, wind speed, etc. There are thousands of these stroms each year and a complete log of each storm would give you a good answer in a few years (still enough time to divert disaster if the storm number is showing signs of increasing). "So in the end what your comment tells me is that you know that everything that you have been saying is wrong." I have been told I am wrong. I do not exactly know what I am wrong about.
    0 0
  11. 160, Norman,
    The content of this thread is not that there are extreme weather events happening today (and tomorrow). It is that these events will increase in number, intensity and frequency of return.
    So you accede to my point that repetitively finding and precenting anecdotal evidence of other, past extreme events is a pointless exercise.
    0 0
  12. Sphaerica Here is an example of why I question the expert opinions on the question of extreme weather events. "Dr. Jeff Masters: An extreme rainfall event unprecedented in recorded history has hit the Binghamton, New York area, where 7.49″ fell yesterday. This is the second year in a row Binghamton has recorded a 1-in-100 year rain event; their previous all-time record was set last September, when 4.68″ fell on Sep 30 – Oct. 1, 2010. Records go back to 1890 in the city…. You don’t often see a major city break its all-time 24-hour precipitation record by a 60% margin, according to wunderground’s weather historian, Christopher C. Burt, and he can’t recall ever seeing it happen before." The weather historian can't recall ever seening it happen before. Source of above quote. "1973 – Flooding In late September 1973, another flood event in San Antonio left 6.54 inches of rain September 26th and 0.87 inches September 27th. This rain event produced a 24 hour record of 7.28 inches for San Antonio, later broken October 17 to 18, 1998 when 13.35 inches of rain fell in 24 hour" Source of San Antonio rainfall records. This is a 83% margin and it only happened 13 years ago. This is only one example I found and I would think there are more. Here is a page to view from check this out. It has all the 24 hour rainfall records of Austin, Texas. Look at each month and you can see some extremes that are way above any other reading for the month. I assume it is due to a rare hurricane moving over the area and dumping a lot of rain. I link it only to show that choosing one city in New York with a large amount of rain is not a scientific study.
    0 0
    Response:

    [DB] "The weather historian can't recall ever seening it happen before."

    Perhaps Mr. Burt has not worked for Wunderground for its entire existence (since 1995).  Since the event you cite occurred in 1998, Mr. Burt could still be correct in his assertion.  But perhaps that possibility did not occur to you.

    Nevertheless, the endless stream of comments focused on weather events, in the absence of robust methodologies, amount to little more than spamming of this Forum.  You have been given sincere and able advice on how to better prosecute your admitted agenda.  You would do well to observe that advice.

  13. 162, Norman, You are completely missing the point. Your argument is flawed.
    0 0
  14. Joe Romm on a blog post quoted someone else who presented anecdotal evidence. This makes your use of the same technique valid here, in this context, in what way?
    0 0
  15. Norman,any useful tool for looking at change in extreme weather has to have reliable data sources going back 50-100 years at least, and have sufficient geographical coverage that it can be meaningfully compared to models. Since you are critical of all presentations to date, what record do you propose? If you demand only what can be done with current technology, then you are effectively just arguing for delaying action on climate change and ignoring the tools that are around. The last IPCC report looked at river level data. Your objection to this?
    0 0
  16. skywatcher @ 53 "Norman, I can't believe you don't see that what you are doing is cherry-picking, and finding occasional anecdotes to support a very weak position." "Stupid evidence is an informal account of evidence in the form of an anecdote. The term is often used in contrast to scientific evidence, as evidence that cannot be investigated using the scientific method. The problem with arguing based on anecdotal evidence is that anecdotal evidence is not necessarily typical; only statistical evidence can determine how typical something is. Misuse of anecdotal is a logical fallacy." Why then would not this also qualify as anecdotal? "The last couple of years have certainly seen a large number of extreme events take place, from the floods in Queensland, Colombia, Pakistan and Sri Lanka, to the droughts in Texas, Australia, China and the Amazon, and record-setting high temperatures in countries that cover approximately one-fifth of the Earth's surface. Wildfires, snowstorms, tornadoes and hurricanes have also made the headlines in a number of countries. This has led to the appearance of new expressions: 'global weirding' and 'a new normal'." It is picking some extreme events around the world and forming a conclusion. How is what I am attempting different except in time frame. I am looking for extreme events around the world. I am asking that good studies be done to look at global extremes of each year and match them up. It looks like Bibliovermis at #117 is interested in determining trends for wet and dry areas for various areas around the globe. The best I can give you for some form of statistical view is to take the challenge I gave to muoncounter at post #90. This challenge covers 30 years of drought/wet cycle in the US. I can't post the animation so if you are interested you can run it yourself. It covers the region of the US (yes only a small percent of the Earth's total land but a very dynamic and versatile area of study subject to all forms of weather patterns).
    0 0
  17. scaddenp @ 165, I think there is enough evidence available with current data basis to see at least if some weather related extreme events are increasing in intensity, duration, frequency but the process would be way too time consuming for one person. It seems NOAA has large amounts of weather data at their website for many locations. I was looking at extreme 24 hour precipitation at Austin a bit ago. There are hundreds of cities with this information, it is just a matter of data entry and proper scientific analysis for patterns and trends to determine if it is getting worse, and if it is attempt the best policy to minimize the effects.
    0 0
  18. Norman, I've pointed you towards links that are not just anecdotal, yet you ignored them. Your 'challenge' is similarly anecdotal unless you can quantify the area covered by the relevant PDSI levels. Just looking at them won't do. In that context, Daniel Bailey's response at #106 is relevant, not only is the dataset global, but there is an example of quantification of the current summer temperatures with respect to a long-term dataset. There's already a lot in the published literature about the intensification of the hydrological cycle through warming. Do you think that this can't happen? If so, why? Do you think that this will not lead to extremes, both of temperature and precipitation when weather conditions are right? If not, why not?
    0 0
  19. Norman
    It is picking some extreme events around the world and forming a conclusion.
    No, you are cherry-picking a couple of sentences from the review and drawing your own conclusions, which suggests you still haven't read the book. As I say in the rest of the review, Powell places these events in a historical context (i.e trends) and he looks at what papers and/or experts are saying with regards to different events. He also cites the literature that shows that some events probably already have a climate-change component to them. In other words, he looks at the predictions that have been made and finds that some events are already consistent with these predictions. The conclusion is not based on picking some extreme events worldwide - it is based on analysing the data, looking at trends and seeing whether what we are witnessing is consistent with a warming world.
    0 0
  20. The author certainly could have been more thorough in explaining the predictions, how the events fit and how they might not. As Norman points out above, the trend in strong-to-violent tornadoes is down. The predictions are ambiguous. The author mentions the source of heat and moisture, but fails to point out the other required ingredients. Those other ingredients may trend up or down with AGW, the predictability is very low. Also the author nicely points out the AGW-driven seasonality and areal changes with hurricanes but not with tornadoes (which AFAIK, there isn't any). In short a bit more detail and precision can go a long way to addressing criticisms. The story may pass muster initially with the uninitiated but they are going to be very susceptable to suggestions that they have not been given the whole story. Of course, that is always possible and his book would be 500 pages long to cover all possible critiques. But I believe that in a few cases it is inadequate as written.
    0 0
  21. Eric Powell's book is a Kindle Single, not a comprehensive book on the link between extreme weather and climate change - I think this is worth bearing in mind when assessing what he's written. It's also worth remembering that he's trying to answer a specific question, namely whether there is now a preponderance of evidence showing that climate change is under way. Which is not the same as reviewing the literature on extreme weather and climate change. My point, though, was that it's wrong to say that all he's done is look at recent events and drawn some conclusions from those alone. He clearly hasn't, and Norman would know that if he'd read the book. As for tornadoes, Powell clearly states that there's been little to no change in strong to violent tornadoes between 1950 and 2010. You could argue that he could've explained things in more details to show why there are uncertainties, particularly in the case of tornadoes and hurricanes. But again, who is he addressing and what question(s) is he trying to answer? Is there really a need to go into all the details, or is a general overview sufficient?
    0 0
  22. True, I didn't notice he said the frequency has not changed. But he follows that with Masters' comments on a "higher energy state" which, AFAIK, is not well-defined. A better followup would be about the ingredients for tornadoes which may increase or decrease (or stay the same) with GW. The suggestion from the chapter is the heat and moisture are the only needed ingredients. But the heat and moisture travel from the gulf every spring, at least several times, but the tornado outbreaks are much more rare than that. Also the heat and moisture remain after tornado season dies down. It suggests that there are more important ingredients and those ingredients should at least be mentioned WRT AGW.
    0 0
  23. Erik (sorry for misspelling your name earlier) I can't agree with your assertion that the suggestion from the chapter is the heat and moisture are the only needed ingredients. In the first sentence of the chapter on tornadoes, he mention the two main factors that drive tornadoes: instability in the atmosphere and wind shear. I guess we're going to have to agree to disagree on this - I don't think that he needs to explain the science in detail since he's only trying to assess whether climate change contributed to the tornadoes in question. And he makes no claim that it has, only that it's a possibility.
    0 0
  24. Eric, I think the tornado issue is a strawman anyway. No one ever said that every weather event had to increase in frequency and intensity, or that such increases must be detectable in the same time frames. It is quite possible that some events (floods, droughts) will increase in frequency and intensity, others (hurricanes) only in either frequency or intensity, and some (tornadoes) may even diminish in one or both of intensity and frequency. Or they may diminish at first, and then undergo an unexpected increase at a later date, when a new tipping point is reached. Tornadoes in particular seem to rely on extreme temperature gradients rather than available energy. So an increase in temperatures with a reduction in the gradients may decrease the frequency and usual intensity of storms. But the higher energies and temperatures available in the system may also make short outbursts of more or more intense storms more possible and frequent than before. So you'd see an overall reduction in storms and intensity, and yet begin to have more experience with the nasty scenario of a weekend of a flurry of nasty, evil storms. So that's something you'd wind up measuring one way (overall statistical decrease) when reality to the people withstanding the onslaught is very different.
    0 0
  25. Sphaerica, I generally agree. Some phenomena like intense rainfall have a much more linear relationship to AGW than others like tornadoes or (to some extent) hurricane formation and intensity. Maybe a good compromise for a book like this is to briefly describe the connections, the direct ones like increased evaporation causing floods and exacerbating droughts. Then the indirect ones like instability, lapse rate, horizontal temperature gradients, etc which will vary nonlinearly with AGW but are also much more prone to natural variations. The author should either explain it somehow or leave it out (e.g. strong tornadoes) but not just repeat Masters' energy concept and Ostro's "confluence" of natural factors with AGW. Those are too loose and too vague IMO and do not justify adding strong tornadoes into the book.
    0 0
  26. 175, Eric,
    ...Masters' energy concept and Ostro's "confluence" of natural factors with AGW. Those are too loose and too vague...
    I agree. The connection between energy and weather is logical, but lots of things seem logical at first thought but turn out to be far more complex and nuanced.
    0 0
  27. Anne-Marie Blackburn @171 I did purchase the book. It was mostly the same items that have been covered on SkS. There was a valuable resource link that James Powell linked to in this ebook. I saved it to my favorites and will go through it slowly. It is a rather long and detailed document and will take some time to study properly. Good resource to see if extreme weather is increasing.
    0 0
  28. Anne-Marie Blackburn, James Powell brings up the European 2003 heat wave as one sample of increasing hazards from global warming. I did find this link on the item that gives a detailed explanation of the cause of this phenomena. If you ignore the author's opinions at the end of the document you can see if his analysis is valid. Heat Wave in Europe in 2003 explained. I do like how this author gives a mechanism to explain the events and also this explains why using a statistical bell curve for weather extremes may not be a valid approach. Extreme weather events are not random events that occur. The take place because conditions have been set up for their formation. I did not see any mechanisms or explanations for extremes other than the globe is hotter and more water vapor is in the air. No mechanism explaining how this will produce more intense rainfall or droughts in the future.
    0 0
  29. skywatcher @ 168 "Norman, I've pointed you towards links that are not just anecdotal, yet you ignored them." I did look through your Stu Ostro document. The other links you posted were to disaster reports. I did not ignore them. I just stated there are potential flaws in using disaster data to prove extreme weather is on the increase. These are all know variables to the disaster data. More people, more houses, more expensive houses. The uncertain one is how population is moving around, where is population growing and where is is decreasing. I think direct measurements for this important topic are needed. Ones not based upon a variable that changes with time in nonlinear fashion.
    0 0
  30. #179, we'll just have to disagree on your idea of preferred data. #178: So you accept that the globe is hotter and there is more water vapour in the air? This is a good start! Do you also accept that hotter air temperatures will lead to more evaporation, faster drying out of the land, and once the land is dry, even higher temperatures (as the energy isn't used in evaporation)? And do you accept that more water vapour in the air golobally leads to increased precipitation globally (what goes up must come down)? Do you think all this precipitation is drizzle? Sphaerica and Eric's points are also good - that not every weather type will necessarily intensify or increase in frequency with warming, but there is good reason to expect that some types will intensify/increase (e.g. more precipitation, more evaporation).
    0 0
  31. Norman Yes, I recommend reading the US Climate Change Science Program report. I read it when it first came out - it's more technical than Powell's book and it may answer some of the questions you have. With regards to the European heat wave, I understand that anomalous meteorological conditions were the main cause of the event, but I don't see how, without a quantitative analysis, you can conclude that human-induced global warming did not contribute to the event. Nor can you state categorically, of course, that global warming did contribute to it. The take-away point from that section, according to Powell (based on Stott et al.'s paper), is that such heat waves become more probable in a warmer world. Which set the scene for the 2010 Russian heat wave, an event that was even more unusual than the 2003 European heat wave. I don't think cases should be taken in isolation though - it is the number of record-breaking high temperatures worldwide in recent years that make the case. I'm not sure what to say about your point on the lack of mechanism to explain more intense rainfall and drought. This is fairly well established in the literature. Would this article provide the information you need? Or am I misunderstanding your point?
    0 0
  32. Norman#178, While it may be possible to shrug off the 2003 European heat wave as 'just weather,' what about the 2006, 2007 and 2010 heat waves? FYI: here is the WMO definition of heat wave; others may have differences. Please avoid citing disinformation denial sites as 'references;' a practice that does little save damage your credibility.
    0 0
  33. Anne-Marie Blackburn @ 181 Your link is not active, I would like to see the article. "With regards to the European heat wave, I understand that anomalous meteorological conditions were the main cause of the event, but I don't see how, without a quantitative analysis, you can conclude that human-induced global warming did not contribute to the event. Nor can you state categorically, of course, that global warming did contribute to it." I would not form such a conclusion. Your post is the same point I have been making. But if it is difficult to conclude one way or the other then it perhaps is a weak link or the signal should be stronger. I have stated, in various posts, that I am not making any statements of certainty about global warming's effect on extreme weather events. I am questioning what appears to be a thinking that extreme weather events are on the increase and the cause is global warming. A quote from your review of James Powell book "But climate change, through rising temperatures and water vapour levels for example, is changing the odds of extreme events occurring." I am not certain of this statement without some good empirical supporting data. I do believe the data is out there in the many data basis of historical collected data but I would not be able to compile it. Perhaps a large study done by graduate students in the field of climatology or meterology.
    0 0
    Moderator Response: [DB] Fixed link in 181.
  34. Anne-Marie Blackburn @ 181 It would seem the most likely culprit for many examples of extreme weather events (drought, high heat, cold, excess rainfall other than hurricane) are the blocking high events (example: in winter in US a strong high pressure system that does not move much will pump very cold air down from Canada and lead to very frigid conditions. In summer a similar pattern can prevent storms from moving into areas cooling them leading to drought and heat waves, drenching rains can take place as the blocking high routes the storm systems over the same saturated areas leading to floods). A strong link to connect global warming to extreme weather events would be a way to show that global warming leads to more blocking events that last longer and cover larger areas.
    0 0
  35. muoncounter @ 182 Your link to the definition of Heat Wave: "The definition recommended by the World Meteorological Organization is when the daily maximum temperature of more than five consecutive days exceeds the average maximum temperature by 5 Celsius degrees (9 Fahrenheit degrees), the normal period being 1961–1990.[3]" This may not work to be the definition. Would it be considered a heat wave in the northern states if it was 9F warmer in January? Or would this be a most pleasant condition.
    0 0
  36. muoncounter @ 182 I have been logging temperature data for Omaha Nebraska for a while (683 days of data). I guess where I live extreme weather is not as big a deal as in Texas as we have extremes quite often. Both hot and cold. If a heat wave is 5 consecutive days with temps 9F above the normal average, I will call a cold snap a period where the high temp is below 9F from the normal high for 5 consecutive days. Here is the data I have so far and will demonstrate that heat waves and cold snaps seem very routine for my area and it might be why I am not as quick to see evidence that extreme weather is increasing. December 2009 (cold snap): -11,-18,-9,-22,-15,-10 January 2010 (cold snap): -16,-20,-30,-23,-27,-23,-14,-22,-31,-24 February 2010 (cold snap): -10,-10,-11,-17,-18,-24,-17 March 2010 (heat wave): 15,19,23,29,11 (here is one where a heat wave might be welcome...the normal high for Omaha during this time is 58F during the heat wave it was in the 70's and 80's) April 2010 (heat wave): 12,20,19,14,13 May 2010 (cold snap): -16,-14,-9,-17,-15,-22,-13 November 2010 (heat wave): 13,22,20,21,10 March 2011 (cold snap): -10,-13,-17,-20,-15,-11,-17,-10,-11 April 2011 (cold snap): -10,-14,-21,-12,-14 May 2011 (heat wave): 10,9,15,25,26,9 September 2011 (cold snap): -16,-20,-24,-22,-12 Please note muoncounter. I am not using this data to form any global conclusions about trends. I am posting the data to demonstrate the frequency of hot and cold extremes in the area where I live. From the perspective I know, weather extremes are very normal. Severe storms and numerous tornado warnings in the summer, blizzards and bitter cold in the winter, extremely wet flooding years and then very hot dry drought years. If I lived in a location with more stable weather over long periods to be interupted by some very unusual weather events, I may have a different attitude to these threads.
    0 0
  37. muoncounter I forgot to label the data but I did infer it. The temps posted are temperature deviations from normal highs. Recorded temperature high minus normal high temperature.
    0 0
  38. muoncounter @ 182 "Please avoid citing disinformation denial sites as 'references;' a practice that does little save damage your credibility." I did post the link with this caution: "if you ignore the author's opinions at the end of the document you can see if his analysis is valid." The point of the link was that it demonstrated a linking mechanism to explain heat waves in Europe (blocking patterns). My suggestion is that authors such as James Powell would help people on the fence of this issue by demonstrating links on how global warming will increase these blocking patterns in the atmosphere and why it will do so.
    0 0
  39. skywatcher @ 180 "So you accept that the globe is hotter and there is more water vapour in the air? This is a good start! Do you also accept that hotter air temperatures will lead to more evaporation, faster drying out of the land, and once the land is dry, even higher temperatures (as the energy isn't used in evaporation)? And do you accept that more water vapour in the air golobally leads to increased precipitation globally (what goes up must come down)? Do you think all this precipitation is drizzle?" I can agree with all the statements you made. The question is not about increased air temperatures or more rainfall. It is about extreme events increasing. That is where the uncertainty lies. Even if I agree with the statements in your quote, it does not lead to the certainty that extreme events will increase. They may very well do this, I do not know, but I would wish to know with greater certainty with some empirical data and good linking mechanisms. It is not a linking mechanism to say warmer average temps will lead to more extreme temps or that more moisture in the air will lead certainly to more extreme rainfall amounts. You are the one who linked to the Stu Ostro document. This meterologist goes to great length to demonstrate that extreme weather events are caused by blocking patterns...ridges and troughs at the 500 mb level in the atmosphere. He does not go to equal lengths to demonstrate that these are increasing because of global warming.
    0 0
  40. Norman#186 "I am posting the data to demonstrate the frequency of hot and cold extremes in the area where I live." I don't think 2 years of temperature data demonstrates anything other than you live in the midwestern US, far from the supposedly moderating influence of an ocean. The Old Farmers Almanac could tell you that. Here is what you are competing with: Belgium experienced two heat waves in July 2006. Before 1990 a heat wave occurred about once every 8 years, but during the last decade the country averages one heat wave per year. --emphasis added You can read the remaining details for yourself. But let's try some science for a change. Bichet et al 2011: We show that between 1870 and 2005, prescribed SSTs (encapsulating other forcings and internal variability) determine the decadal and interannual variabilities of the global land temperature and precipitation, mostly via their influence in the tropics (25S–25N). ... between 1930 and 2005 increasing aerosol emissions have reduced the global land temperature and precipitation by up to 0.4C and 30mm/yr, respectively, and that between about 1950 and 2005 increasing greenhouse gas concentrations have increased them by up to 0.25C and 10mm/yr, respectively. Finally, we suggest that between about 1950 and 1970, increasing aerosol emissions had a larger impact on the hydrological cycle than increasing greenhouse gas concentrations. The absolute numbers are less important than the proof of concept: aerosols and greenhouse gases are measurably changing temperatures and precipitation on the 50 year time scale. The effect is real and ongoing; all the hot days and cold days in Omaha cannot disprove that. "authors such as James Powell would help people on the fence of this issue " Question: Are you on the fence on this issue?
    0 0
  41. muoncounter @ 190 "The absolute numbers are less important than the proof of concept: aerosols and greenhouse gases are measurably changing temperatures and precipitation on the 50 year time scale. The effect is real and ongoing; all the hot days and cold days in Omaha cannot disprove that." Nor was my data selection designed to prove or disprove anything about global patterns. "I don't think 2 years of temperature data demonstrates anything other than you live in the midwestern US, far from the supposedly moderating influence of an ocean. The Old Farmers Almanac could tell you that." It does demonstrate I live in an area where extreme weather patterns are already the norm. But on a personal note, people complain about severe cold much more then the really hot days in my area of the world. A 97 F (heat wave in Belgium) in Omaha just means a nice swimming day. And you being from Texas know heat quite well but you probably would hate -20 F mornings. I think the link that Anne-Marie Blackburn posted in 181 is very useful as it does suggest linking mechanisms that I have been asking for, changes in atmopheric circulation patterns.
    0 0
  42. Norman "I live in an area where extreme weather patterns are already the norm" If they are the norm, they are by definition not extreme. Extreme: of a character or kind farthest removed from the ordinary or average Norm: general level or average The quote in 190 evidently didn't impress you, so I'll repeat it: Before 1990 a heat wave occurred about once every 8 years, but during the last decade the country averages one heat wave per year. Once again, let's look to some relevant science. Barriopedro et al 2011: We provide evidence that the anomalous 2010 warmth that caused adverse impacts exceeded the amplitude and spatial extent of the previous hottest summer of 2003. "Mega-heatwaves" such as the 2003 and 2010 events broke the 500-year-long seasonal temperature records over approximately 50% of Europe. --emphasis added Two heat waves, 7 years apart both broke 500 year records on a continental scale. Now that's extreme!
    0 0
  43. There has been talk of blocking again on this thread. An expert in the field Dr. Lipo recently had this to say at ScienceDaily: "Lupo believes that heat sources, such as radiation, condensation, and surface heating and cooling, have a significant role in a blocking's onset and duration. Therefore, planetary warming could increase the frequency and impact of atmospheric blocking." "It is anticipated that in a warmer world, blocking events will be more numerous, weaker and longer-lived," Lupo said. "This could result in an environment with more storms. We also anticipate the variability of weather patterns will change dramatically over some parts of the world, such as North America, Europe and Asia, but not in others." I highly recommend this PhD thesis by Jana Sillmann titled "Extreme Climate Events and Euro-Atlantic Atmospheric Blocking in Present and Future Climate Model Simulations" From the abstract: "This comparison shows that the model is able to realistically capture the observed climatological large-scale patterns of the extreme indices, although the quality of the simulations depends on the index and region under consideration. In the future climate, as represented by the IPCC emission scenarios B1 and A1B, all considered temperature-based indices (yearly minimum and maximum temperatures and frequency of tropical nights) encounter a significant increase worldwide. The precipitation-based indices (max. 5-day precipitation amount and 95th percentile of precipitation) also increase significantly, particularly in those regions that are relatively wet already in present climate. Analogously, dry spells increase especially in regions with dry conditions under present climate." And "Blocking frequencies and their seasonal distribution are well captured by the model and especially for the winter minimum temperature significant correlations with blocking events are found in central Europe. In the future climate, the blocking frequency is slightly diminished but the influence on the European winter climate remains robust." Her research has been published, see Sillmann and Croci-Maspoli (2009), and Sillmann et al. (2011). See also this conference paper by Lupo et al. (2008), they looked at trends in blocking between 1970 and 2007 and found that: "In the NH, the most important result was that the recent increases in blocking were hemisphere-wide, but the increase was slower in the Atlantic region. These increases in blocking occurrence this study agreed with the results of the Lupo et al. (1997) which implied more blocking activity in a warmer world." Might need to look at other indices, other than blocking indices, for example, Alessandro (2011).
    0 0
  44. Here's a neat way of looking at these summers: --source The five warmest and coldest summers are highlighted. Grey bars represent the distribution for the 1500-2002 period, with the curve in black showing how common a given temperature is. The bottom panel shows frequency of extreme summers by decade. Dotted line shows maximum decadal values that would be expected by random chance. And then there's this tidbit: Russia alone saw more than 55,000 heat-related deaths, extensive wildfires, and approximately 25 percent crop failure last year. The total economic loss was around 1 percent of Russia’s gross domestic product, according to preliminary estimates referred to by the European scientists.
    0 0
  45. Thanks for these Albatross. My non-scientific intuition has been that blocking extents would follow the other major influences we see. (Here we see the expansion of the Hadley cell moving rainfall further south - therefore not on land at all, but into the nearer Southern Ocean. And depriving us of our longterm average rainfall by dropping into the ocean which already has quite enough. Probably shifting the 'Goyder line' further south, thereby depriving us of cropping land.) I can see no good reason why other large scale meteorological circulation effects shouldn't also get in on the act. I've not been so assiduous in reading full papers recently, but these'll get the full treatment.
    0 0
  46. Adelady @195, No worries :)
    0 0
  47. Norman First you say: "Here is the data I have so far and will demonstrate that heat waves and cold snaps seem very routine for my area and it might be why I am not as quick to see evidence that extreme weather is increasing." Followed by: "Nor was my data selection designed to prove or disprove anything about global patterns." I find it disingenuous in the extreme that you claim not to be discussing global patterns, while stating you don't see any evidence for extreme weather - which is almost by definition a global measure. You are cherry-picking. Again. And presenting it as some kind of argument against the statistics and studies. At this point, Norman, I will have to consider you a troll.
    0 0
  48. muoncounter @194, Thanks for those papers, and did you see the citation below the Barriopedro et al. (2011) paper? It links to Zhao and Running's response to critique of their 2010 paper in which they found a decline in net primary production between 2000 and 2009 on account of an increase in droughts (primarily in the S. Hemisphere). Well, they have addressed the critics and in doing so they conclude that: "Samanta et al. and Medlyn challenge our report of reduced global terrestrial net primary production (NPP) from 2000 through 2009. Our new tests show that other vegetation indices had even stronger negative changes through the decade, and weakening temperature controls on water stress and respiration still did not produce a positive trend in NPP. These analyses strengthen the conclusion of drought-induced reduction in global NPP over the past decade." And "Our continuous monitoring shows that global NPP in 2010 (53.19 Pg C) was lower than that in 2009 (53.84 Pg C), largely due to the two large-scale droughts in the Amazon and Europe. We expect that the strongest impacts of changing climate on terrestrial ecosystem productivity will continue to be manifested through the hydrologic cycle, but whether these current trends continue can only be answered by global monitoring." Not "cheering" news....
    0 0
  49. KR @ 197 I think you are missing the point I made in post 186. "I find it disingenuous in the extreme that you claim not to be discussing global patterns, while stating you don't see any evidence for extreme weather - which is almost by definition a global measure." I have not stated in any post, that I can think of, that there is not extreme weather. I was pointing out that what would be extreme for other locations (number and frequency of hot and cold snaps, 12 in about 2 years) is the normal where I live. Muoncounter points out that Belgium used to have a heat wave once every 8 years and now has one every year. Which is a significant change for them. I was explaining why it is more difficult for me to be aware of extreme weather changes (since it would be in the more abstract world of statistics and graphs) than for others on this planet. They are experiencing changes in weather patterns directly but I have experienced no changes on notice as the weather in Omaha is already more extreme than many other locations. As I stated the purpose of the data I posted was not an attempt to prove or disprove the content of James Powell ebook.
    0 0
  50. 199, Norman, Nobody is missing the point you are making. It is very clear. You are trolling this thread by littering it with comments of anecdotal evidence of a variety of extreme weather events, in an effort to persistently and endlessly argue the illusory and emotional points of view that weather is weather and weather is variable and there always have been weather extremes so no one can prove to you that more and worse extremes really are such. You can find evidence of past weather extremes. We get that. No one denies this. You don't understand how climate change could increase weather extremes. We get that. We understand, even if you don't. You don't believe that the plethora and severity of recent weather events is unusual. We get that. You are wrong. In the end, all you are doing is trying to post as many comments as you can restating these erroneous points over and over again, but without actually listening to what others are saying, or admitting that your anecdotal approach is invalid, unscientific, and will lead to invalid and unscientific conclusions.
    0 0

Prev  1  2  3  4  5  Next

You need to be logged in to post a comment. Login via the left margin or if you're new, register here.


The Consensus Project Website

THE ESCALATOR

(free to republish)


© Copyright 2024 John Cook
Home | Translations | About Us | Privacy | Contact Us