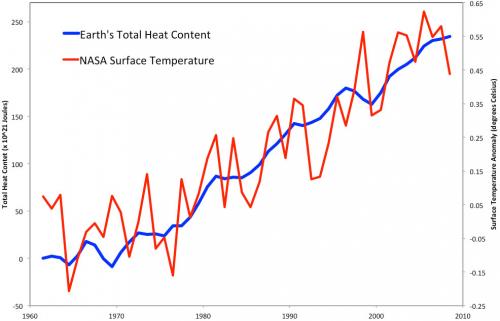
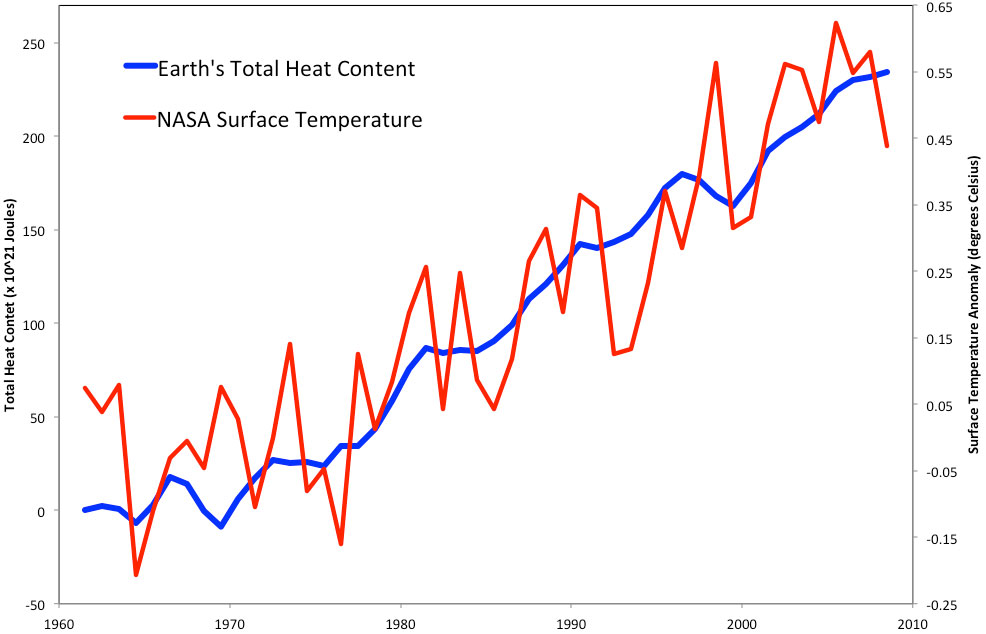
This graph shows the change with time of the surface temperature in red (NASA GISS) and Total Heat Content of the Earth in blue (Church et al 2011). Both curves are annual data, showing that the total heat content increases nearly monotonically while the surface temperature varies a lot year to year because it represents only a small fraction of the total heat content of the climate system. The planetary energy imbalance continues to rise unabated.
 |
The Skeptical Science website by Skeptical Science is licensed under a Creative Commons Attribution 3.0 Unported License. |