
CRUTEM is a version of the surface temperature record based on weather station data spanning the last one and a half centuries. It is produced by the Climatic Research Unit (CRU) at the University of East Anglia, and provides the land component of the widely quoted HadCRUT global temperature record. Version 3 of this dataset (CRUTEM3) was the current version from 2006-2012, however in the past few months a new version, CRUTEM4, has been released.
Why produce a new version? Studies from the ECMWF and GISS identified a significant bias in the CRUTEM3 record: The dataset has been under-reporting recent temperatures, owing to poor sampling of high Northern latitudes which have displayed the fastest warming over the last decade. The coverage issue has been examined in previous articles on HadCRUT3 and GISTEMP.
CRUTEM4 (Jones et al, 2012) takes the existing CRUTEM3 dataset and adds a significant number of new records. 344 stations were added in the Russian federation, 223 in other former USSR states, 125 in the Arctic and 7 in Greenland. A number of other records were updated. 312 records which were adjusted by CRU in the 1980s for inhomogeneity were either replaced with other records or had their adjustments reassessed. The total number of temperature series in the dataset is now ~5500, although only about 3000 can be updated on a monthly basis.
Let's take a look. Figure 1 shows a coverage map for the last 15 years, with an indication of temperature change given by color. The figure shows the difference in temperature between the mean for 2006-2011 and the mean for 1996-2001 (red=+2°C and blue=-2°C). Note that the rectangular projection used here does exaggerate area at higher latitudes, so this figure does not give an accurate representation of the area covered.
Coverage of Canada, Asia and Australia has improved significantly in the new dataset. Coverage of Africa and Antarctica remains poor.
A more representative measure of coverage is the fraction of the land surface area which is covered by the dataset. This is shown in Figure 2. (This figure was calculated using a high-resolution land mask, and thus the numbers are slightly lower than the corresponding figures in the distributed CRUTEM data files.)

Apart from a recent anomaly in 2010 land coverage has improved from around 60 to 70%. (Antarctica, which is still largely uncovered, comprises about 10% of the Earth's land surface.)
How have the global land temperature estimates been affected by the new dataset? Unfortunately at this point we run into a problem. There are several ways of calculating a land temperature estimate. First there is a choice of how to calculate the average:
Then, there is a choice of how to treat coastal map cells:
NCDC and BEST seem to use method 1A for their land products (i.e. a true land-area average). CRUTEM3 used method 3B (equal weighted hemispheres, no weighting of coastal cells). CRUTEM4 changed to method 2B (land area weighted hemispheres, no weighting of coastal cells). The GISTEMP dTs land products don't fit any of the above categories.
When it comes to calculating a global land-ocean temperature average, all the options give roughly the same answers, because the hemispheric land-ocean distribution cancels, and both parts of coastal cells are used. However for land-only temperature indices, the results can differ significantly. When calculating a difference between two series, such as CRUTEM3 and CRUTEM4 the same convention must used for both. For subsequent calculations we will use the CRUTEM4 convention (i.e. 2B).
Figure 3 provides a comparison of the CRUTEM3 and CRUTEM4 temperature series using a 12 month moving average.

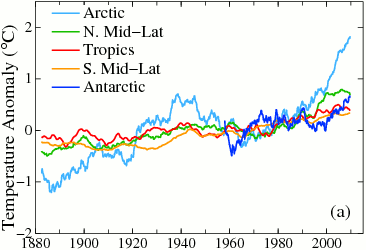
Note that with the temperature estimate for the strong El-Nino year of 1998 has decreased, however temperature estimates for the subsequent years have generally increased. El-Nino is a tropical phenomena, thus it is to be expected that increasing high latitude coverage would reduce the impact of the El-Nino cycle on the temperature record.
More than a third of the difference over recent years comes from the switch from reporting the mean of the hemispheric means to the more conventional global average. Using only the weighted hemispheric series to ensure a like-for-like comparison, the trends in the series shown above over the 15 year period 1996-2010 are 0.213°C/decade for CRUTEM3 and 0.274°C/decade for CRUTEM4.
How have the global land temperature estimates changed between the datasets? Figure 4 shows the difference between the estimated global land temperature.

The effect of increasing the high latitude coverage has increased the global land temperature anomaly, as more of the rapidly warming high-latitude regions are included in the data. The impact of the change matches the onset of rapid Arctic warming as expected. The actual differences show significant inter-annual variability.
Comparison to other land temperature series?
NCDC and the Berkeley Earth project also report land-only temperature records, and it is interesting to make a comparison of the series. However the significant impact of the choice of averaging convention complicates the comparison. In their draft paper the BEST team state the problem as follows:
We note that the difference in land average trends amongst the prior groups has not generally been discussed in the literature. In part, the spread in existing land-only records may have received little attention because the three groups have greater agreement when considering global averages that include oceans ... . We strongly suspect that some of the difference in land-only averages is an artifact of the different approaches to defining “land-only” temperature analyses.
A second issue is that the interpretation of a comparison can be affected by the choice of baseline. As a result of these issues, while you can compare the published series at Wood for Trees the results should be treated with caution.
My own attempt at a like-for-like comparison will be presented in a later article which will gather together some more tentative analysis of the Hadley/CRU datasets and look at possible sources of bias in the resulting records.
The CRUTEM4 update set out to reduce a known bias in the dataset, identified in multiple studies, by improving land coverage. While coverage is still far short of complete it has improved significantly. The effects on the temperature record are minimal before 1990, but have resulted in a significant increase in the trend over the past 15 years. This corresponds well to the period over which the Arctic has shown rapid warming.
Additionally, a change in the definition of global land temperature has been made bringing CRUTEM4 somewhat into line with the other records. While this change has a significant impact on the recent land temperature trends it has minimal impact on the more frequently quoted land-ocean indices.
The CRUTEM4 land data is primarily of interest for its contribution to the global surface temperature series, HadCRUT4. This will be the focus of the next article in the series.
Posted by Kevin C on Tuesday, 15 May, 2012
 |
The Skeptical Science website by Skeptical Science is licensed under a Creative Commons Attribution 3.0 Unported License. |
