Prof. Murry Salby of the Department of Environment and Geography at Macquarie Universiry in Sydney gave a talk last year (August 3, 2011) to the Sydney Institute (described at Wikipedia), in which he claimed that the rise in atmospheric CO2 is not driven by anthropogenic emissions. The abstract of the talk is as follows:
Atmospheric Science, Climate Change and Carbon – Some Facts
Carbon dioxide is emitted by human activities as well as a host of natural processes. The satellite record, in concert with instrumental observations, is now long enough to have collected a population of climate perturbations, wherein the Earth-atmosphere system was disturbed from equilibrium. Introduced naturally, those perturbations reveal that net global emission of CO2 (combined from all sources, human and natural) is controlled by properties of the general circulation – properties internal to the climate system that regulate emission from natural sources. The strong dependence on internal properties indicates that emission of CO2 from natural sources, which accounts for 96 per cent of its overall emission, plays a major role in observed changes of CO2. Independent of human emission, this contribution to atmospheric carbon dioxide is only marginally predictable and not controllable.
Naturally the talk stirred considerable interest in the blogsphere (e.g. at Climate Etc.). More recently, a video of this talk was made available, so we can now investigate Prof. Salby's argument in more detail.
Ironically, the first 11 minutes of the talk provide all the components required to show beyond reasonable doubt that anthropogenic emissions are responsible for 100% of the observed increase in atmospheric CO2 and that natural sources do not play a major role. At 08:39, Prof. Salby correctly states that
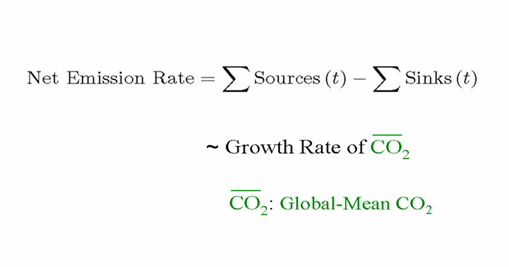
"What is relevant is net emissions, net collected from all sources and sinks, human and natual, that is what ultimately controls atmospheric CO2"
This is then supported by a slide (at 8:58) containing an equation that will be familiar to those that have followed the discussion of earlier claims that the rise in atmospheric CO2 is a natural phenomenon at SkS, for example my rebuttal of Prof. Essenhigh's residence time argument.
This is known as the mass balance equation, and it simply states that as the carbon cycle obeys the principle of conservation of mass, the annual increase in atmospheric CO2 is equal to the difference between total emissions from all sources (both natural and anthropogenic) and the total uptake from all sinks (natural and anthropogenic, although the anthropogenic sink is essentially zero as we are not yet performing significant amounts of carbon sequestration).
For convenience, we can re-write Prof. Salby's mass balance equation in the form
C' = Ea + En - Un,
where Ea represents annual carbon emissions from anthropogenic sources (fossil fuel use and land use change), En represents the carbon emissions from all natural sources (the oceans, soil respiration, volcanos etc.) and Un represent the uptake of carbon by all natural carbon sinks (oceans, photosynthesis, etc.). C' represents the net emissions rate, which as Prof. Salby says is approximately equal to growth rate of global mean atmospheric CO2.
The problem is then that we don't know the values of En and Un with any real certainty as our knowledge of the natural carbon cycle is limited. However, we do have good knowledge of anthropogenic emissions, Ea, as Prof. Salby says (at 7:53)
"In truth only one component of the CO2 budget is known with any certainty, human emissions, implicitly through records of extraction - how much coal and oil are dug up"
There are also good records of emissions due to land use changes as well. We also have reliable observations of the growth rate of CO2 in the atmosphere, as Prof. Salby says (10:35)
"That [CO2 being well mixed in the atmosphere] is a good thing because it means that local values are good approximations of the global average, which in turn provides a record of net global emissions. In fact we have a long record of CO2 from only one site in the free atmosphere, Mauna Loa Hawaii. The local record from Mauna Loa therefore approximates the global mean, which through its growth rate chronicles the history of net global emissions, collectively from all sources, human and natural."
In other words we can reliably work out the net emission rate from the Mauna Loa CO2 record by computing the annual growth in atmospheric CO2, i.e. C'.
This allows us to find out something interesting about the natural carbon cycle: The mass balance equation can be rearranged to give an estimate of the difference between annual emissions from all natural sources and annual natural uptake by all natural sinks.
En - Un = C' - Ea
While we don't know the values of En or Un, the difference between them is constrained by conservation of mass to be the same as the difference between C' and Ea, which we do know! More importantly if we knew the right hand side of this equation was negative, then we would know that the left hand side must also be negative, so whatever their actual values, Un > En.
O.K., so if we look at the data (for details, see Cawley, 2011), we find that the annual rise in atmospheric CO2 has been less than anthropogenic emisssions every year for at least the last fifty. We therefore can also be sure that the natural environment has been a net carbon sink, taking in more carbon than it has emitted, every year for the last fifty. As the natural environment is known to be a net carbon sink, far from being the cause of the observed rise in atmospheric CO2, it has been actively opposing it!

Figure 1: Results of the mass balance analysis.
This analysis is based on three assumptions:
The rest is just trivial algebra. Prof. Salby has explicitly accepted all three of these assumptions in the quotes presented above taken from his Sydney Institute talk, but unfortunately did not see the natural conclusion arising from those (very reasonable) assumptions. We know with high certainty that the rise in atmospheric CO2 is not a natural phenomenon and is 100% anthropogenic (at least since 1959).
Prof. Salby's argument appears to be based on an observed correlation between net global emissions (estimated from the Mauna Loa CO2 observations) and "surface conditions", a combination of MSU temperature and soil moisture, as shown in the figure below, from the slide at 17:52 in the Sydney institute talk.
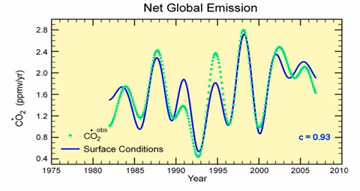
Figure 2: Correlation between net global CO2 emissions and the component due to "surface conditions" (temperature and soil moisture).
The correlation is indeed impressive, clearly there is a relationship between net global emissions and the component due to "surface conditions". Prof. Salby then determines the contribution to atmospheric CO2 by calculating the cumulative sum of the component due to "surface conditions, which appears to explain essentially all but the annual cycle in the Mauna Loa observations, as shown in this figure from 20:53 in the video.
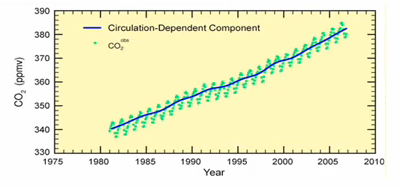
Figure 3: The component of the increase in atmospheric CO2 attributed by Prof. Salby to "circulation dependent component"
The flaw in this argument is quite subtle, and lies in the fact that the bulk of the long term increase in atmospheric CO2 is due to the mean value of net global emissions, and correlations do not depend on the mean value. Essentially the correlation only explains the variability of CO2 measurements around the long term trend, but not the trend itself. Sadly, Prof. Salby's presentation did not include nearly enough information to reproduce the graphs shown above, so I will explain the flaw in his reasoning first via a simple thought experiment, and then illustrate the mainstream understanding of this issue, that is based on the correlation between the annual growth rate and the El Nino Southern Oscillation (ENSO), which was first mentioned in the peer reviewed literature way back in 1979.
Let us assume for the moment that the CO2 observations are composed of a linear component due to anthropogenic emissions, rising at a constant 1.5 ppmV per year, plus a sinusoidal component that was due to the effects of "surface conditions", with a period of five years, such that
C(t) = 1.5*t + 0.5*cos(2*pi*t/3)*sin(2*pi*t/5) - 2630
The numbers are chosen such that the resulting CO2 observations superficially resemble those of the real world (except for the seasonal variation which is not relevant to the thought experiment).
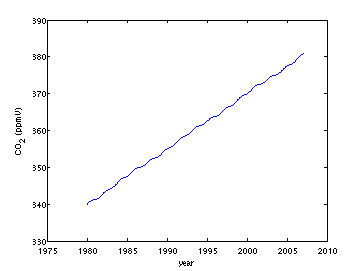
Figure 4: Synthetic atmospheric CO2 observations for thought experiment
Following Prof. Salby's method, we then take the annual differences to estimate the net global emissions:
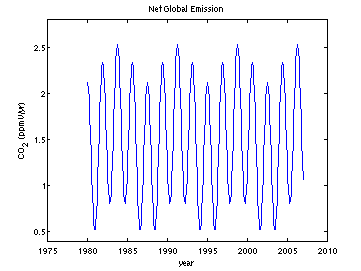
Figure 5: Net global emission derived from synthetic CO2 observations shown in Figure 4.
So far, so good, our synthetic net global emissions are similar to Prof. Salby's in that there is an average value of about 1.5 ppm per year, but superimposed on top of that there is an oscillatory behaviour that sometimes reduces net global emissions almost (but not quite) to zero, and sometimes means that net global emissions are much higher than average.
Happily, as this is a synthetic thought-experiment, we can work out the natural contribution to net global emissions analytically, and we get this:
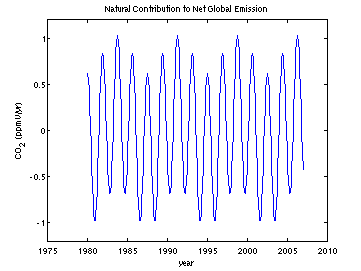
Figure 6: Natural contribution to net global emissions.
Which looks very much like net global emission, and if we compute the correlation between the two then we get a value of 1, i.e. a perfect correlation! This means we can conclude that the natural component "explains" 100% of the variability in net global emission - obviously we are onto something here!
So, again following Prof. Salby's methodology, we compute the cumulative sum of the natural contribution to net global emission, which gives us the natural contribution to the increase in observed CO2, which gives us this:
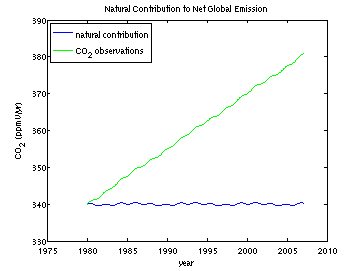
Figure 7: Natural contribution to the long term increase in atmospheric CO2.
Oh...., that doesn't look very much like the result obtained by Prof. Salby; the natural component doesn't seem to explain the long term increase at all, even though it is perfectly correlated with the net global emission!
So what is going on? Well if we compare net global emission (Fig. 5) with the natural contribution to net global emission (Fig. 6), they are identical, except for their mean values. The mean value of net global emission is about 1.5 ppmv per year, and for the natural contribution it is zero. When we compute the cumulative sum of the natural contribution, the positive values cancel with the negative values, so the cumulative sum stays near zero. Thus we can see that the long term rise is principally because of the mean value of net global emission, not because of the wiggles. Why doesn't the correlation reveal this? Here is the formula for the sample correlation (courtesy of Wikipedia):
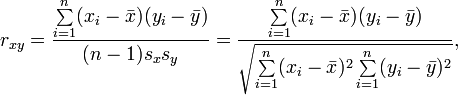
where xand y represent samples from net global emissions and the natural component respectively. They important thing to notice is that the mean (x or y with a bar over the top) is subtracted from x and y wherever they appear in the equation. This means that the value of the correlation is the same no matter what the mean values of x and y are. Thus the correlation doesn't tell you very much about the cause of the long term rise, because that is mainly due to the mean value, not the variablity around the mean.
Next, let's perform the same exercise for the anthropogenic component of the net global emission, which is just 1.5 ppmV per year.
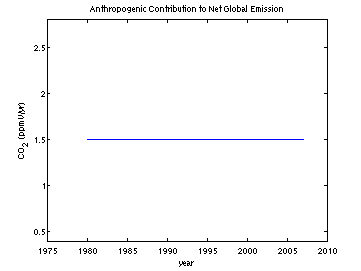
Figure 8: Anthropogenic contribution to net global emission.
If we compute the cumulative sum of the anthropogenic contribution to net global emission, we get the component of the observed increase in CO2 that is due to anthropogenic emissions, which is a steady linear trend rising at 1.5 ppmv per year.
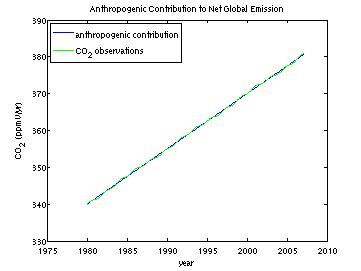
Figure 9: Anthropogenic contribution to the long term increase in atmospheric CO2.
Which clearly does a much better job of explaining the long term trend in atmsopheric CO2, even though the correlation between the anthropogenic component and net global emission is precisely zero!
Key Point: It isn't the variability (the general up and down wiggliness) in net emissions that gives rise to the long term trend, it is the mean value of the net emissions, and the value of the correlation does not depend in any way on the mean value. Therefore the correlation with net global emission tells you very little about the cause of the long term trend.
It is well known that the annual growth rate of CO2 appears to be influenced by the El Nino Southern Oscillation (ENSO); this correlation was first noticed by Bacastow more than thirty years ago (Bacastow, 1979), and has been widely discussed since then. The effect of ENSO however is not principally due to changes in sea surface temperatures, but the effect of ENSO on the terrestrial biosphere: According to Jones et al (2001).
"Climatic changes over land during El Nino events lead to decreased gross primary productivity and increased plant and soil respiration, and hence the terrestrial biosphere becomes a source of CO2 to the atmosphere. Conversely, during El Nino events, the ocean becomes a sink of CO2 because of reduction of equatorial Paci?c outgassing as a result of decreased upwelling of carbon-rich deep water. During La Nina events the opposite occurs; the land becomes a sink and the ocean a source of CO2."
It seems possible that the effects of temperature and soil moisture investigated by Prof. Salby are essentially a proxy for ENSO as ENSO affects both temperature and precipitation in the Americas and Australasia.
Prof Salby suggests that the IPCC were not aware of the variability in growth rate discussed in his presentation (29:30):
"The climate modelling framework just described [i.e. one based on the assumption that CO2 levels are predictable] is the cornerstone of the IPCC, ..., I used to be a reviewer. Much of the public debate stems from the IPCC's last report; the behaviour you have seen was not known at the time of that report".
However, these interannual changes in the carbon cycle are discussed in section 7.3.2.4 of the IPCC AR4 WG1 report. This states that the variability of fossil fuel emissions and estimated variability in net ocean uptake are too small to account for this signal and is therefore thought to be due to year-to-year fluctuations in the land-atmosphere fluxes. Furthermore. it states that high CO2 growth rates correspond to El Nino conditions and conversely low growth rates with La Nina conditions. An additional period (1992-3) of low growth rate followed the eruption of Mount Pinatubo in 1991. References are also provided to support various lines of evidence confirming that the variability of CO2 fluxes is mostly due to land fluxes.
I have sent several emails to Prof. Salby asking for clarification on the methods he used in the work described in his Sydney Institute talk, but so far I have had no reply.
Updated 10/09/2015 to fix broken link to Jones (2001).
Bacastow, R.B. 1976. Modulation of atmospheric carbon dioxide by the Southern Oscillation. Nature 261: 116-118. (www)
Posted by Dikran Marsupial on Thursday, 5 July, 2012
 |
The Skeptical Science website by Skeptical Science is licensed under a Creative Commons Attribution 3.0 Unported License. |