We previously examined various predictions of the annual Arctic sea ice extent September minimum from 2008 through 2012, using a variety of methodologies (statistical, modeling, and/or "other"). Overall the statistical- and model-based predictions have been equally accurate, with an average difference from the observational data of 13%. Skeptical Science's Gavin Cawley (Dikran Marsupial) has been better than average with his purely statistical predictions, averaging a 10.6% difference from the annual minimum. Cawley describes his methodology thusly:
"I obtained from data for Arctic sea ice extent from 1979-2009 [2012 for the most recent predction]...I then fitted a Gaussian process model, using the excellent MATLAB Gaussian Processes for Machine Learning toolbox (the book is jolly good as well). I experimented with some basic covariance functions, and chose the squared exponential, as that gave the lowest negative log marginal likelihood (NLML). The hyper-parameters were tuned by minimising the NLML in the usual way."
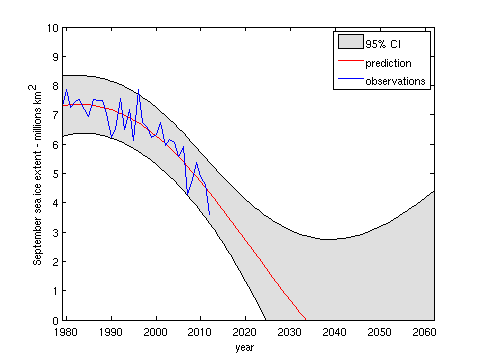
Cawley's results are shown in Figure 1, and predict a 2013 September Arctic sea ice extent of 4.1 ± 1.1 million square kilometers.
Figure 1: Gavin Cawley's Gaussian Process statistical Arctic sea ice extent prediction
It is important to note that this is a purely statistical approach, and hence some of the longer-range aspects of the prediction seem implausible, given our knowledge of the physics of Arctic sea ice. Firstly, the model predicts that the Arctic will be ice-free in September from about 2034, however in reality this is likely to be a rather pessimistic prediction. As Walt Meier explains,
"... the rapid losses have come from the Siberian and Alaskan regions of the Arctic. The region along northern Greenland and Canadian Archipelago have not lost much summer ice – for good reason. The predominant ice circulation pushes ice toward those coasts resulting in thick ice that tends to get replenished. In other words, we’ve seen a rapid decline in the “easy” ice to lose, but now we’re getting to the “more difficult” ice. I think it’s likely that that will go more slowly."
Secondly, the upper boundary of the credible interval suggests that it is plausible that sea ice may begin to increase again after 2040. There is no physical reason why this should be the case. Essentially the only expert knowledge built into the model is that the underlying long-term variation of Arctic sea ice extent is expected to be a smooth function of time (encoded by the use of the squared exponential covariance function - the degree of smoothness is inferred from the data), and the broadening of the credible interval as the model extrapolates away from the observations is in reality merely an indication that the model has no real confidence in its predictions beyond a handful of years in the future. Beyond 2030 or so, the model has little or no predictive skill; however, one of the nice things about this approach is that the user is alerted to this issue that by the breadth of the error bars.
Tamino at the Open Mind blog has likewise made statistically-based predictions, and has also been more successful than most, averaging an 8.6% difference from the annual minimum. Tamino has also offered his 2013 prediction, of a 3.97 ± 0.9 million square kilometer Arctic sea ice extent.
Figure 2: Tamino's Arctic sea ice fits with a quadratic function (model 1; blue) and a modified lowess smooth (model 2; red).
Note that neither Cawley nor Tamino predicts that 2013 will break the 2012 record (3.6 million square kilometers). There is a principle in statistics known as "regression toward the mean," which is the phenomenon that if an extreme value of a variable is observed, the next measurement will generally be less extreme, i.e. we should not expect to observe record lows in consecutive years. This is because when extremes are reached and records are broken, a number of different variables generally have to align in the same direction to make this happen. That being said, a new record in 2013 is well within the range of uncertainty in both Cawley's and Tamino's statistical predictions.
Anthony Watts and Steven Goddard, who have combined to make the most inaccurate Arctic sea ice predictions (Figure 3), have recently managed to make an argument that is both astonishing and entirely predictable.
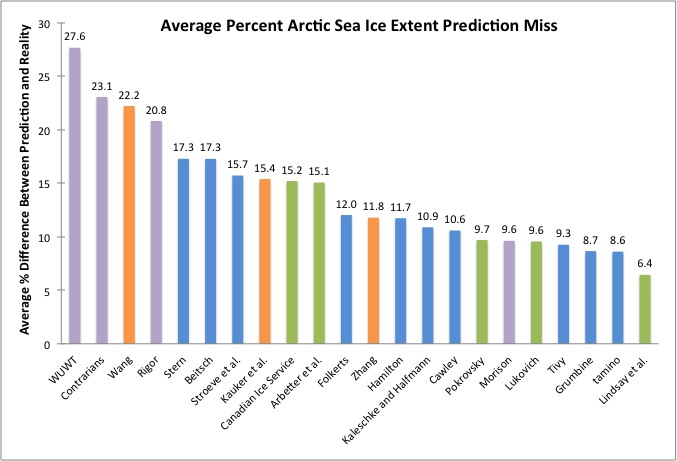
Figure 3: Percent difference between predictions and actual annual Arctic sea ice minima for individuals and groups which have made a minimum of two predictions in SEARCH and elsewhere.
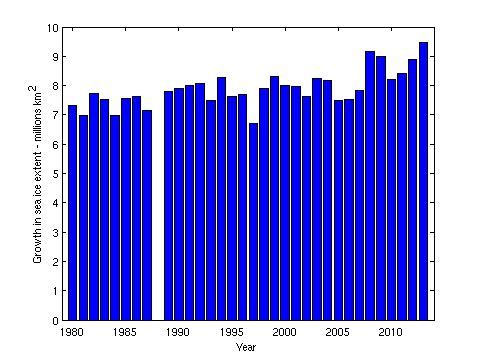
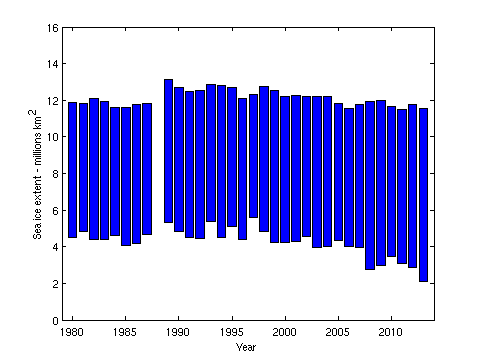
Watts and Goddard are now claiming that "the Arctic has blown away the previous record for ice gain this winter." However, Cawley shows that this is an entirely predictable result, quite simply because the annual sea ice minimum extent is decreasing faster than the annual maximum. With the distance between the minimum and maximum thus increasing, a larger "recovery" over the winter is exactly what we expect to see (Figures 4 and 5), and does not suggest any recovery in Arctic winter sea ice. This is clearly seen by presenting the ice gain as the difference between September and January observations, as shown in Figure 4(b), rather than as a simple bar chart without this context, as shown in Figure 4(a).
 |
 |
| (a) | (b) |
Figure 4: Difference between annual January and September Arctic sea ice areas. The size of the blue bars represents the size of the sea ice "recovery" each year (n.b. there is a known discontinuity in the area measurements ocurring in 1987, clearly visible in the observations, of around 0.88 million km2, due to an increase in the region imaged by the sensors on the satelites.).
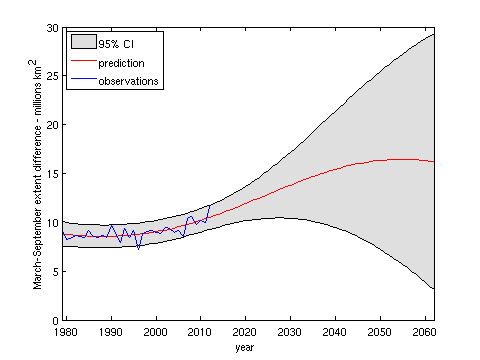
Figure 5: Predicted March-September Arctic sea ice extent difference, or "recovery", using Gavin Cawley's statistical approach.
As these figures show, the annual "recovery" has generally grown over time, and is predicted to continue to grow, simply because the annual sea ice minimum is falling faster than the annual maximum.
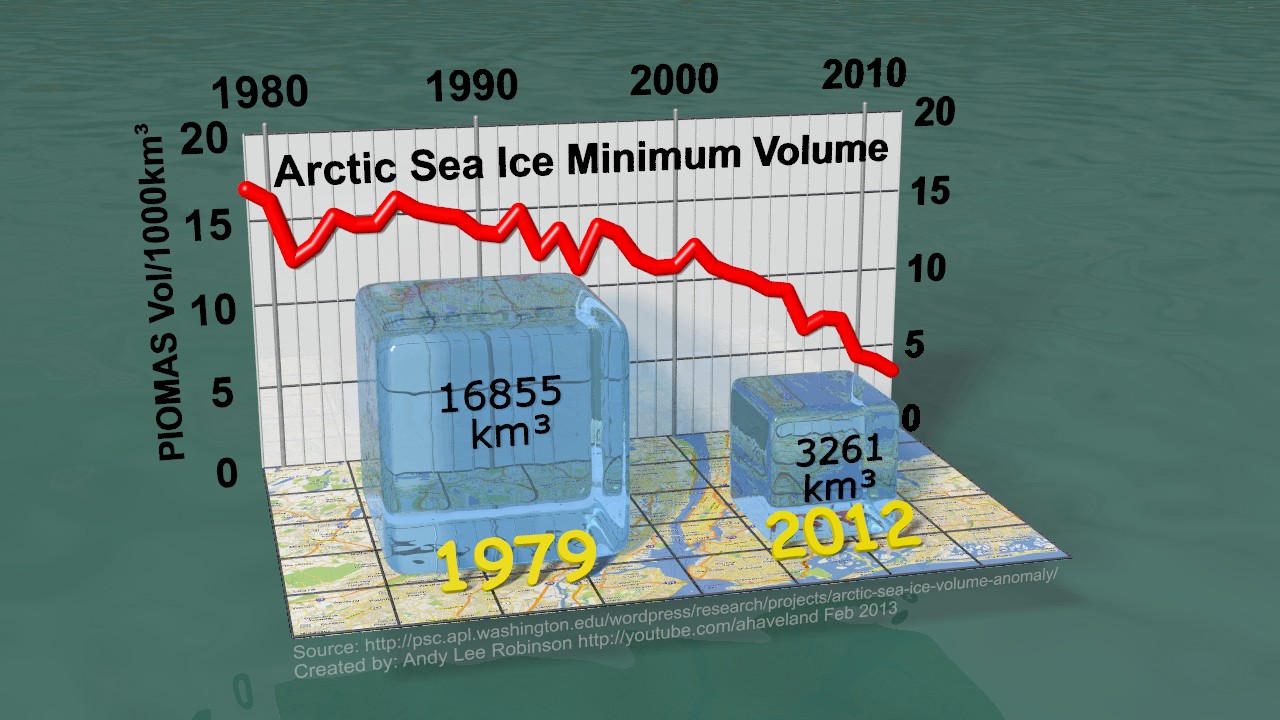
It's also always important to remember that ice is three-dimensional, and so looking at Arctic sea ice extent misses the rapid decline in the thickness of the ice as well.
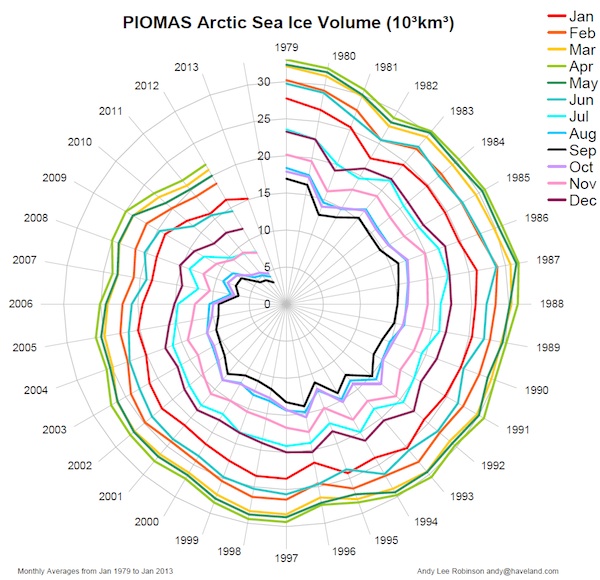
To illustrate that point, Andy Lee Robinson has put together several great graphics based on the Pan-Arctic Ice Ocean Modeling and Assimilation System (PIOMAS) data from the University of Washington’s Polar Science Center. Now the European Space Agency’s CryoSat-2 probe has generally confirmed the PIOMAS results.
Robinson's two most recent graphics illustrate the incredible loss of Arctic sea ice volume between 1979 and 2012, representing them as ice cubes on a 10 kilometer grid map of New York, and in spiral form, illustrating that the sea ice volume has dramatically declined in every calendar month since 1979.
Robinson is also the creator of this graphic and video illustrating the Arctic sea ice mass loss.
To sum up,
Posted by dana1981 on Wednesday, 20 February, 2013
 |
The Skeptical Science website by Skeptical Science is licensed under a Creative Commons Attribution 3.0 Unported License. |