Cherrypicking global surface air temperatures is one of the most common errors associated with global warming. In reality, a very small percentage of overall global warming goes into heating surface air temperatures, while approxiately 90% is absorbed by the world's oceans (in totality, at all depths). Because many other factors influence surface air temperatures on short timescales, the data are noisy, and as a result it's easy to cherrypick temporary flat periods to wrongly claim that global warming has stopped (Figure 1).
Figure 1: Average of NASA GISS, NOAA NCDC, and HadCRUT4 monthly global surface temperature anomalies from January 1970 through November 2012 (green) with linear trends applied to the timeframes Jan '70 - Oct '77, Apr '77 - Dec '86, Sep '87 - Nov '96, Jun '97 - Dec '02, and Nov '02 - Nov '12.
However, climate contrarians are now more frequently shifting their cherrypicks to the relatively shallow layer of the oceans (the upper 700 meters). The average depth of the world's ocean is nearly 4,000 meters, but the deeper the ocean layer, the more difficult it is to measure its temperature and heat accumulation.
Fortunately most ocean heat accumulation occurs close to the surface, but accounting for less of the deep ocean layers also means missing more global warming. The best ocean heat measurements are for the 0–700 meter layer, which accounts for over 60% of overall global warming. However, only considering ocean heat accumulation to 700 meters also means neglecting 30–40% of overall global warming.
Similar to surface air temperatures, the warming of the 0–700 meter oceans has slowed in recent years (since about 2003), which has made them a ripe candidate for cherrypicking. This was one of the key findings of Nuccitelli et al. (2012), in which we noted that while heat accumulation in the 0–700 meter oceans has slowed in recent years, at the same time it has accelerated in the 700–2,000 meter oceans.
Overall, there is no sign that the warming of the 0–2,000 meter oceans has slowed; in fact, they have accumulated more heat in the past 15 years than during the previous 15 years (Figure 2).
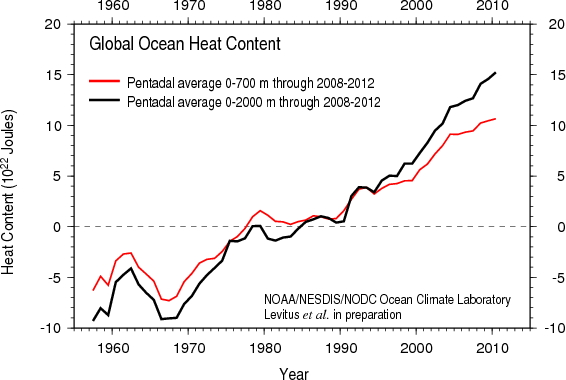
Figure 2: Comparison of Ocean Heat Content 0–700 meter layer vs. 0–2,000 meters layer, from the National Oceanographic Data Center.
It should be no surprise that climate contrarians constantly ignore the accelerated warming of the 700–2,000 meter oceans, pretending that they simply don't exist. In one recent example, a denialist blog disputed the results of Nuccitelli et al. (2012) by showing Figure 3 below (also discussed in this post by Tamino at the Open Mind blog).
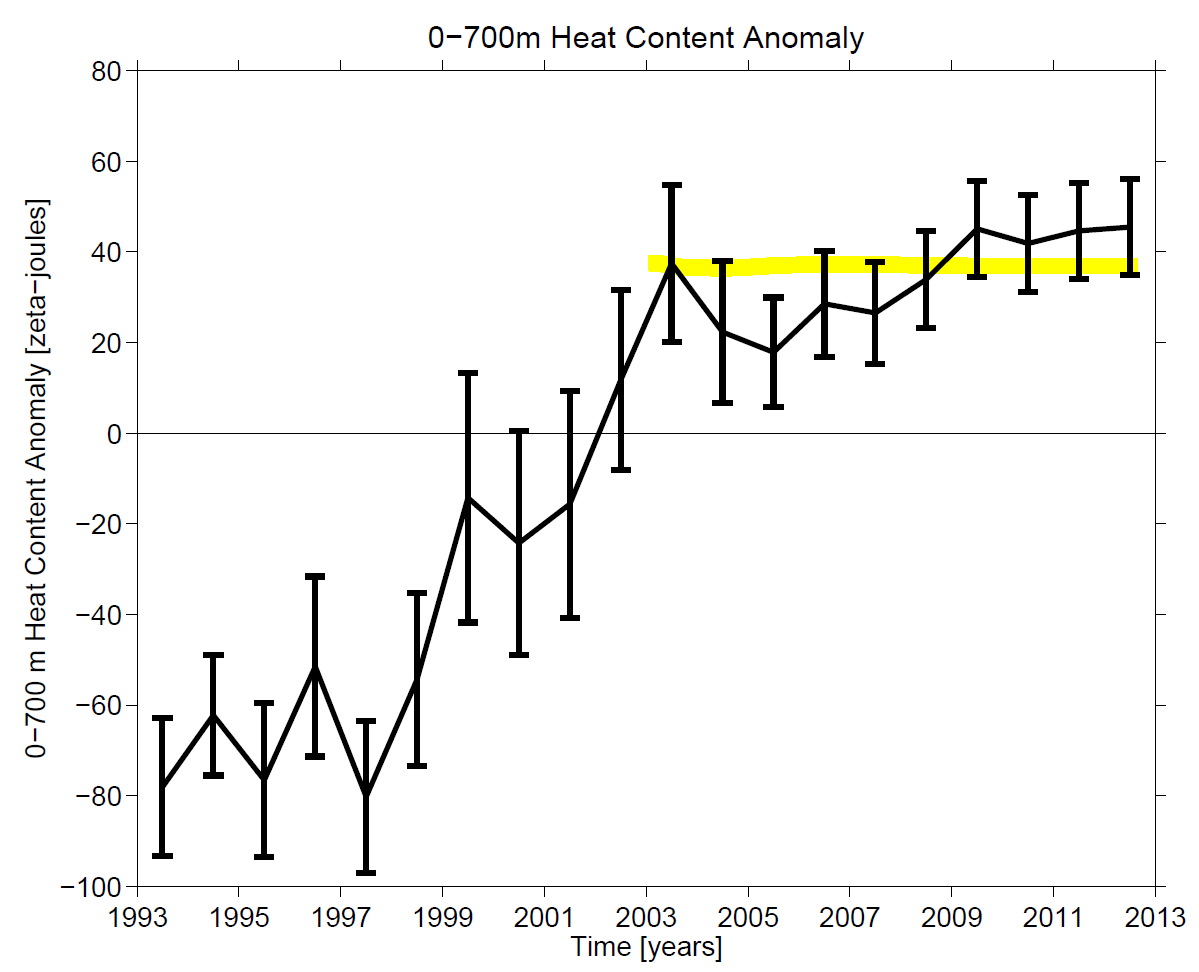
Figure 3: 0–700 meter ocean heat accumulation from NOAA PMEL using the methodology described in Lyman et al. (2010), with an arbitrary yellow line drawn in an effort to indicate slowed ocean warming.
The ocean heat content data used in Nuccitelli et al. (2012) and Figure 2 above are from the National Oceanic and Atmospheric Administration (NOAA) National Oceanographic Data Center (NODC) using the methodology described by Levitus et al. (2012), whereas the data in Figure 3 are from the NOAA Pacific Marine Environmental Laboratory (PMEL) using the methodology described in Lyman et al. (2010).
The Levitus methodology fills data gaps with the averaged value of the available data, which has the tendency to underestimate any anomalies. The Lyman methodology infills the data gaps with anomalies from nearby grids. The end result is that Levitus is likely to underestimate any warming trend, as discussed in Lyman (2008). As a result, the data plotted on the denialist blog actually shows more 0–700 meter ocean warming than the data plotted in Nuccitelli et al. (2012). This is illustrated in Figure 4.
Figure 4: 0–700 meter ocean heat content data from NOAA NODC (Levitus) and NOAA PMEL (Lyman) using the same baseline. The yellow arbitrary denialist line is shown, followed by the linear trends for 2003–2012 and 1993–2012 in red. Standard error bars are also shown.
Despite showing a larger ocean warming trend than Levitus, climate contrarians likely prefer the Lyman data because it does not include the ocean layers below 700 meters. However, even if we cherrypick this shallow ocean data and cherrypick 2003 as the starting point, the 0–700 meter ocean heat accumulation for 2003–2012 in the Lyman PMEL data is equivalent to 1.2 Hiroshima atomic bomb detonations per second over the past decade. For 1993–2012, this rate increases to the equivalent of 3.7 detonations per second, and when including global heat accumulation in Nuccitelli et al. (2012) including the 0–2,000 meter oceans, the Earth has accumulated the equivalent of 4 Hiroshima atomic bomb detonations per second over the past decade.
When we consider all the available data, it becomes quite clear that ocean and global warming continue unabated at a rapid rate. Cherrypicking cannot change that reality.
Posted by dana1981 on Wednesday, 6 March, 2013
 |
The Skeptical Science website by Skeptical Science is licensed under a Creative Commons Attribution 3.0 Unported License. |