Monckton Myth #2: Temperature records, trends and El Nino
 Recently John addressed some of the issues with Christopher Monckton’s paper targeting Michael Steketee’s column in The Australian, where Monckton asserted that the oceans are not accumulating heat. John showed that when you consider the full body of evidence, it is evident that the oceans are indeed accumulating heat thereby contributing to global sea level rise. In the spirit of consulting the full body of evidence, I will address Monckton's claims regarding temperature records, temperature trends and the intensity of 2010’s El Nino.
Mr. Steketee noted that 2010 had the warmest January to September recorded, which Monckton highlighted as cherry-picking for not including a full year of data. Now that the data is in for most indices - what does it show?
To answer this question I looked at more than just the traditional Hadley, NASA and NOAA datasets, but also the measurements of the lower troposphere processed by Remote Sensing Systems (RSS) and the University of Alabama-Huntsville (UAH) as well as the 5 major reanalysis datasets which incorporate station data, aircraft data, satellite data, radiosonde data and meteorological weather modeling. In hopes of being able to demonstrate robustness I have compiled data from the 10 different sources, with these, and 2010’s year-end temperature ranking summarized in Table 1.

Table 1: Summary of primary data sources.
From the table it is readily apparent that 2010 was a warm year as every data source that includes it has concluded that it was either the warmest or 2nd warmest year on record. However, it seems that the devil of a year in 1998 still was atop the global temperature records for HadCRUT, RSS and UAH. There is one important caveat countering this: the 3rd column shows that all the datasets that include 1998 as the warmest year on record do not have global coverage. In fact amongst datasets with global coverage at least reaching to 2005, there is only one dataset which has 1998 in its top 2 and this record does not include 2009 or 2010. The global coverage identifier is key because it is well known that the exclusion of parts of the Arctic is the reason that Hadley has been undersampling the warming. Furthermore since the satellite records do not include much of the polar regions they cannot be considered to have global coverage either. This is an important caveat particularly because the Arctic climate system has experienced the fastest rate of warming out of anywhere on the planet. Neglecting a region such as this has undoubtedly forced 1998 into a position that it should not be in, as the warmest year in an incomplete record.
Then which year is it?
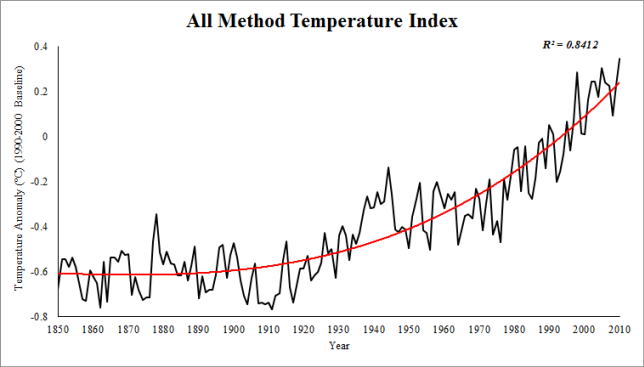
Each temperature dataset has their own individual caveats so it is difficult to assess which is the most reliable, but a purely unscientific way to look at this issue is to put all the datasets on the same baseline and to average them to create the All Method Temperature Index (AMTI). I have put all the Table 1 datasets on the 1990-2000 baseline (so we could include all) and have averaged them to create Figure 1 below.

Figure 1: All Method Temperature Index (AMTI). 1990-2000 Baseline.
Based upon the AMTI the overwhelming majority of evidence suggests that 2010 is the warmest year on record, followed by 2005 with 1998 in a close third buoyed by the anomalous warmth demonstrated in the 3 records without global coverage (Hadley, RSS and UAH).
Warming Rates
Now that we have assembled the data, onto some Monckton Myths! Monckton asserts:
“In fact, the rate of warming from 1975-2001, at 0.16 °C per decade, was the fastest rate to be sustained for more than a decade in the 160-year record, but exactly the same rate occurred from 1860-1880 and again from 1910-1940, when we could not possibly have had anything to do with it.”
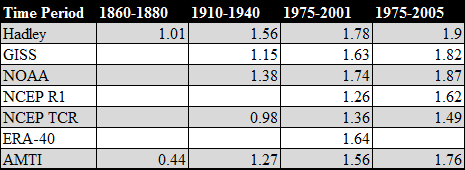
Let’s have a look at some warming rates for the different indices in Table 2.

Table 2: Rate of warming for given indices in °C/century.
First we can conclude that Monckton's statement that 1975-2001 was the fastest warming rate for longer than a decade is absolutely wrong as a much higher rate is demonstrated for 1975-2005 in row 5. Secondly, to compare the three periods in Table 2, the only index which covers that period is Hadley, making his 1.6°C per century number wrong for 1975-2001 as it is actually much higher at 1.78°C per century. Based upon the evidence presented here, he cannot support his statement that 1860-1880 had a similar warming rate as it was demonstratively lower than the 1975-2001 warming rate and nearly half the 1975-2005 rate. Finally, regarding the 1910 to 1940 warm period, evidence presented here suggests that only 1 out of the 4 major indices indicates a rate of warming within 0.25°C per century and none within 0.2°C. His claim that the rates are similar is dubious at best.
No global warming since 2001?
Now onto another claim made by Mr. Monckton. Monckton states
“Since late 2001 there has been virtually no “global warming” at all.”
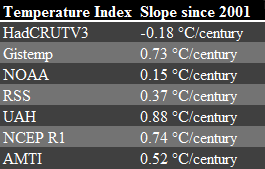
Using the datasets already collected, this shouldn’t be too hard to test. How about computing the trend from 2001 to 2010 (Table 3)?

Table 3: Rate of temperature change per century (2001-2010)
It is true that in 1 of the 6 major indices there is in fact a negative slope, however to indicate with such certainty that there has been “virtually no global warming at all” is to ignore the vast majority of scientific evidence suggesting otherwise. Since skepticism is inherent for Monckton he should ask why only 1 of 6 indices shows data supporting his argument.
Monckton makes another similar claim in his “rebuttal” #4 by saying:
“Actually, it is colder” when the statement reads that the world is not cooler compared to 1998.
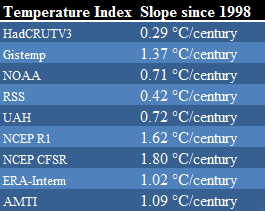
Same process, computing trends since 1998 to indicate whether or not it has been warming. Figure 5 shows much of the same as Table 4.

Table 4: Rate of temperature change per century since 1998.
So to summarize: we have already established that 1998 is not the warmest year on record for any truly global analysis, that it has warmed since 2001 and now that it has been warming since 1998 (in some cases significantly).
...Move on people nothing to see here...
A few lines away from his trend comments, Monckton acknowledges that the last decade was the warmest on record but indicates that it is part of a trend of 300 years of global warming. It is interesting to hear Monckton make that claim considering our best climate reconstructions indicate that the 1700s were still right in the midst of the little ice age. Either way if he is insinuating that this warming is some sort of a “rebound” from the LIA then we have already addressed that here. Furthermore, as Figure 2 demonstrates, the vast majority of warming has occurred over the past 110 years where there is strong evidence of a human impact in the early part and undeniable evidence of a strong anthropogenic signal in the latter part.
Is 2010 a strong El Niño year?
Finally to end this lengthy post I will quickly look at several claims made by Mr. Monckton regarding the strength of this year’s El Niño and La Niña. Monckton states:
“...the first nine months of 2010... was dominated by a substantial El Niño… The last few months of the year… showed the beginnings of a La Niña event…"
So was this in fact a strong El Niño year followed by just the beginnings of a La Niña?
According to NOAA, 2010 featured 5 months of El Niño conditions with 7 months of La Niña conditions. During 2010, there was a total of 1 month considered to be a strong El Niño event and 5 months considered to be a strong La Niña event according to NOAA’s criteria. Not exactly the 9 month long, substantial event with the beginnings of a La Niña event is it?
In Conclusion
Monckton dragged us down a road that we should not have had to travel. Short term trends are spurious and year to year rankings are not what matters in the end. What matters is the clear and unambiguous long term warming trend that has accelerated over the last 50 years. This post is also a lesson that even when focusing on short term trends, Monckton's arguments fail to be supported if one does not cherry pick.
Posted by robert way on Monday, 17 January, 2011
 Recently John addressed some of the issues with Christopher Monckton’s paper targeting Michael Steketee’s column in The Australian, where Monckton asserted that the oceans are not accumulating heat. John showed that when you consider the full body of evidence, it is evident that the oceans are indeed accumulating heat thereby contributing to global sea level rise. In the spirit of consulting the full body of evidence, I will address Monckton's claims regarding temperature records, temperature trends and the intensity of 2010’s El Nino.


