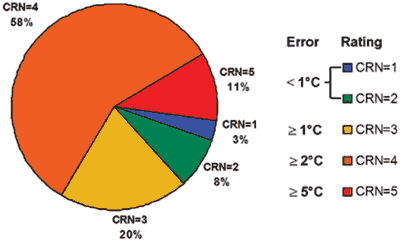
Figure 1: Station Site Quality by Rating (Watts 2009)
The reliability of the surface temperature record has previously been questioned due to urban heat island effect. This is when weather stations are positioned in urban areas which tend to be warmer than rural areas. However, it has been shown that urban warming has little to no effect on the long term temperature trend, particularly when averaging out over large regions. However, another factor affecting the temperature record is microsite influences. This refers to the placement of weather stations near features that might influence the readings. For example, placing weather stations near objects or areas that absorb and radiate heat (eg - a parking lot) can give higher temperature data.
One of the more extensive efforts in cataloging instances of microsite influences is surfacestations.org. Created by meteorologist Anthony Watts, it features an army of volunteers who travel the U.S. photographing weather stations. They found stations located next to air conditioning units, near asphalt parking lots and on hot rooftops. The work is summarised in a report Is the U.S. Surface Temperature Record Reliable? Anthony Watts concludes no, it's not reliable.
Watts rates the stations using the same metric employed by the National Climatic Data Center (section 2.2.1). There are five ratings depending on how well sited the station is. Class 1 stations are the most reliable, located at least 100 metres from artificial heating or reflecting surfaces (eg - buildings, parking lots). Class 5 stations are the least reliable, located next to or above artificial heating surfaces.
Of the 1221 stations in the U.S., the surfacestation.org volunteers had rated 865 at the time the report was written (the website currently reports 1003 stations examined). They classified only 3% of stations as the most reliable Class 1. Most stations (58%) are rated Class 4 (artificial heating sources less than 10 metres from weather station).
Figure 1: Station Site Quality by Rating (Watts 2009)
These numbers highlight the need to improve the quality of temperature measurement. Indeed, this had already been recognised by the NCDC when they released the Site Information Handbook in 2003. This report was designed to address shortcomings in documentation, changes to observing networks and the observing sites themselves.
The key question to the global warming debate is whether microsite influences actually add to the overall warming trend over the U.S. Anthony Watt's report doesn't answer this question directly. However, the NOAA have published Talking Points related to concerns about whether the U.S. temperature record is reliable. The NOAA used the site ratings by surfacestations.org to construct two national time series. One was the full data set, using all weather stations. The other used only Class 1 or Class 2 weather stations, classified as good or best.
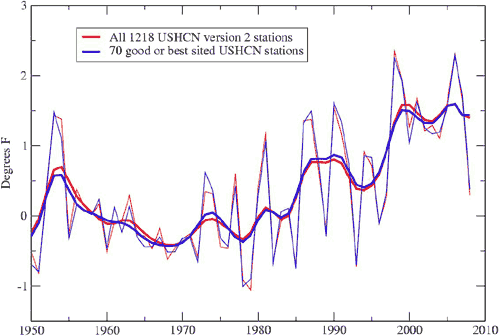
Figure 2: annual temperature anomaly (thin lines) and smoothed data (thick lines) for all U.S. weather stations (red) and Class 1/Class 2 weather stations (blue).
The two data sets cover different areas so some differences might be expected. The top rating stations only covered 43% of the country with some states not included (eg - New Mexico, Kansas, Nebraska, Iowa, Illinois, Ohio, West Virginia, Kentucky, Tennessee or North Carolina).
Nevertheless, the two data sets show practically identical trends. The work of surfacestations.org is useful in clarifying one point - microsite influence has imparted little to no warming bias in the U.S. temperature record.
Posted by John Cook on Monday, 31 August, 2009
 |
The Skeptical Science website by Skeptical Science is licensed under a Creative Commons Attribution 3.0 Unported License. |