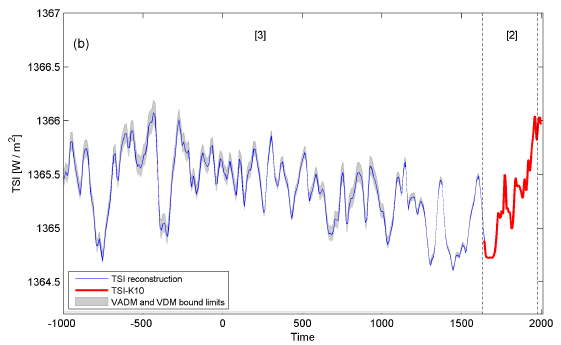
The journal Astronomy & Astrophysics is publishing dueling total solar irradiance (TSI) reconstructions. We recently examined the 'solar hockey stick', a physics-based reconstruction by Vieira et al. (Figure 1).

Figure 1: Vieira TSI reconstruction over the past 3,000 years
And in April, the journal published the reconstruction of Shapiro et al. The authors of the latter study note the significant difference between their results and previous TSI reconstructions:
"We obtained a large historical solar forcing between the Maunder minimum and the present, as well as a significant increase in solar irradiance in the first half of the twentieth-century. Our value of the historical solar forcing is remarkably larger than other estimations published in the recent literature."
For those interested in the details, Shapiro et al. describe their methods as follows.
"We assume that the minimum state of the quiet Sun in time corresponds to the observed quietest area on the present Sun. Then we use available long-term proxies of the solar activity, which are 10Be isotope concentrations in ice cores and 22-year smoothed neutron monitor data, to interpolate between the present quiet Sun and the minimum state of the quiet Sun. This determines the longterm trend in the solar variability which is then superposed with the 11-year activity cycle calculated from the sunspot number. The time-dependent solar spectral irradiance from about 7000 BC to the present is then derived using a state-of-the-art radiation code."
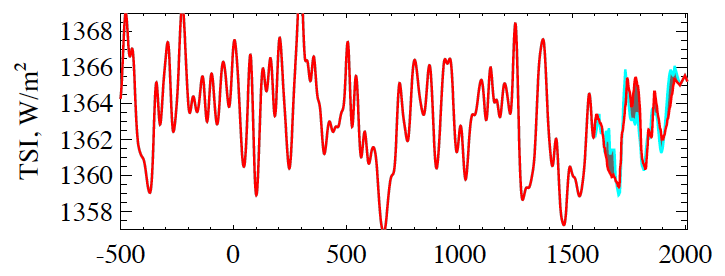
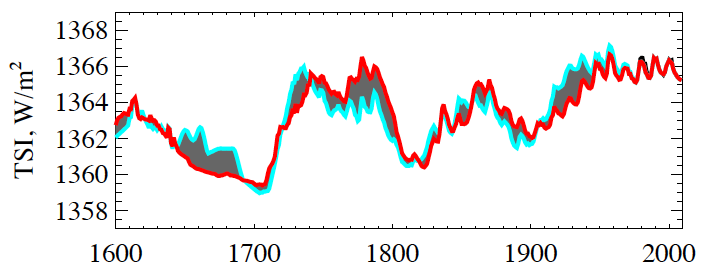
Figures 2 and 3 show their results from 500 BC and 1600 AD to present, respectively.

Figure 2: Shapiro et al. TSI reconstruction from 500 BC to Present

Figure 3: Shapiro et al. TSI reconstruction from 1600 AD to Present
I thought it would be an interesting exercise to evaluate the plausibility of these two reconstructions from a climatic standpoint.
The solar radiative forcing is the change in total solar irradiance (TSI) in Watts per square meter (W/m2) divided by 4 to account for spherical geometry, and multiplied by 0.7 to account for planetary albedo (Meehl 2002). The albedo factor is due to the fact that the planet reflects approximately 30% of the incoming solar radiation. As with CO2, we calculate the equilibrium temperature change by multiplying the radiative forcing by the climate sensitivity parameter (λ).
There are three relatively recent periods during which both reconstructions agree TSI changed substantially. From 1500 to 1600 AD, Vieira and Shapiro find that TSI increased approximately 0.75 and 4.5 W/m2, respectively. From 1600 to 1700 AD, they both decreased by approximately the same amount. And from 1700 to 1800 AD, the Vieira reconstruction once again increased by approximately 0.75 W/m2, while the Shapiro reconstruction increased by approximately 6 W/m2, and remained sustained at this high level for several decades.
We can use these figures to calculate two things: given the IPCC expected climate sensitivity, how much warming should each change in TSI have caused, and if the actual temperature changes during these periods were mainly due to TSI changes, what does that tell us about climate sensitivity?
The IPCC most likely values for transient and equilibrium climate sensitivity are 2 and 3°C for doubled CO2 (3.7 W/m2). For our purposes we'll assume the sensitivity to CO2 and solar activity are similar, which is a reasonable assumption. Thus the climate sensitivity parameters are 0.54 and 0.81°C/[W/m2], respectively.
For the Vieira reconstruction, the 0.75 W/m2 change in TSI would be expected to cause 0.07 to 0.11°C change in average global surface temperatures. For the Shapiro reconstruction, the 4.5 to 6 W/m2 changes in TSI would be expected to cause 0.38 to 0.85°C temperature changes. A marked difference between the two. So how do they compare to reconstructed temperature changes?

Figure 4: Ljungqvist (2010) 30-90°N decadal averages (black) vs. HadCRUT land-ocean 30-90°N decadal averages (red). Courtesy of Robert Way.
Figure 4 provides the Ljungqvist reconstruction of northern hemisphere land temperatures. Bear in mind that because temperatures change faster over land than oceans, and the northern hemisphere has more land area than the southern hemisphere, this reconstruction exhibits larger temperature changes than the planet as a whole by a factor of approximately two.
So, from 1500 to 1600, the Ljunqvist temperature reconstruction warmed approximately 0.2°C, from 1600 to 1700 cooled approximately 0.3°C, and from 1700 to 1800 warmed approximately 0.4°C. If we assume all other forcings over this 300 year period averaged out to approximately zero, the average global surface temperature change over each century is roughly 0.15°C - not far from the change expected from the Vieira reconstruction, but far less than expected from the Shapiro reconstruction. This tells us that if Shapiro et al. are correct, the climate sensitivity must be substantially lower than the IPCC most likely value.
In the Vieira case, if a 0.75 W/m2 TSI change is causing a 0.15°C global surface temperature change, the climate sensitivity parameter is approximately 1.14°C/[W/m2], which corresponds to approximately 4°C for doubled CO2 - towards the high end of the IPCC range of possible values.
In the Shapiro case, if a 5 W/m2 TSI change is causing a 0.15°C temperature change, the sensitivity parameter is 0.17°C/[W/m2], which corresponds to approximately 0.6°C for doubled CO2. This is well below the IPCC range of possible values, and even low by "skeptic" standards like Lindzen and Spencer. A climate sensitivity this low contradicts the many lines of evidence supporting the IPCC range, and would make large past climate changes (i.e. transitions between glacial and interglacial periods) extremely hard to explain.
Another important consideration in evaluating the plausibility of these two reconstructions is the fact that both show approximately no change in TSI since 1950. Yet we know that global temperatures rose approximately 0.55°C since 1975, after a period of slight cooling between 1945 and 1975. Solar activity has clearly had a negligible if any contribution to the warming over recent decades, and this magnitude of warming is well outside the range of internal variability.
According to the Shapiro reconstruction, TSI increased approximately 4 W/m2 in the early 20th Century, which is less than it increased from 1500 to 1600 AD, during which time the average surface temperature increased only 0.15°C. If climate sensitivity is as low as their reconstruction requires, then the anthropogenic radiative forcing over the past 150 years (1.6 W/m2) would have caused less than 0.25°C warming. Thus their reconstruction and low climate sensitivity can only account for less than half of the observed 0.8°C surface warming over the past century, and only one quarter of the warming over the past 40 years.
The calculations done here are rough back-of-the-envelope style approximations. The non-solar radiative forcing wasn't exactly zero from 1500 to 1800 AD, for example. Nevertheless, even with these rough calculations, we see that while the Vieira TSI reconstruction is plausible, the Shapiro reconstruction does not match up well with observed and reconstructed temperature changes. It's also worth noting that if the solar radiative forcing were consistently as large as Shapiro et al. suggest, TSI would correlate much better with global temperature than it actually does.
The Shapiro reconstruction may seem appealing to those of us who want to believe that the Sun plays a dominant role in climate changes, or that climate sensitivity is low. But the requied low sensitivity for their study to be correct fails to explain the global warming over the past century, and especially over the past 40 years. In other words, it increasingly diverges from reality. It's important to remember that as the authors note, the Shapiro TSI reconstruction is an outlier. Newer isn't always better, and although they present an interesting alternative result, it simply doesn't seem to gel with other observational data.
Posted by dana1981 on Saturday, 21 May, 2011
 |
The Skeptical Science website by Skeptical Science is licensed under a Creative Commons Attribution 3.0 Unported License. |