Was there a Medieval Warm Period?
The Medieval Warm Period spanned 950 to 1250 AD and corresponded with warmer temperatures in certain regions. During this time, ice-free seas allowed the Vikings to colonize Greenland. North America experienced prolonged droughts. So just how hot was the Medieval Warm Period? Was it warmer than now? A new paper Global Signatures and Dynamical Origins of the Little Ice Age and Medieval Climate Anomaly (Mann et al 2009) (see here for press release) addresses this question, focusing on regional temperature change during the Medieval Warm Period and Little Ice Age.
Prior temperature reconstructions tend to focus on the global average (or sometimes hemisphere averages). In this study, more than 1000 tree-ring, ice core, coral, sediment and other assorted proxy records spanning both hemispheres were used to construct regional temperature change over the past 1500 years. The paper discusses many interesting topics, including some interesting consequences of prolonged La Nina conditions during the Medieval Warm Period. I'm still digesting this info and will return to it in a future post. But the central result of the paper is the regional temperature pattern during the Medieval Warm Period.

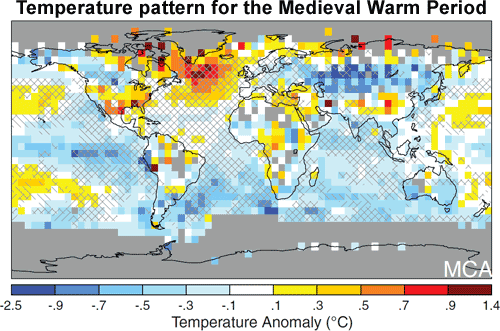
Figure 1: Reconstructed surface temperature anomaly for Medieval Warm Period (950 to 1250 A.D.). Temperature anomalies are defined relative to the 1961– 1990 reference period mean. Gray areas indicates regions where adequate temperature data are unavailable.
The Medieval Warm Period found warm conditions over a large part of the North Atlantic, Southern Greenland, the Eurasian Arctic, and parts of North America. In these regions, temperature appears to be warmer than the 1961–1990 baseline. In some areas, temperatures even even as warm as today. However, certain regions, such as central Eurasia, northwestern North America, and the tropical Pacific are substantially cooler.
So the Medieval Warm Period was not a global phenomen. Warmer conditions were concentrated in certain regions. Some regions were even colder than during the Little Ice Age. For this reason, the paper's authors refer to the Medieval Warm Period as the more technical sounding 'Medieval Climate Anomaly' (the MCA in Figure 1). Personally, I don't see the term becoming ubiquitious.
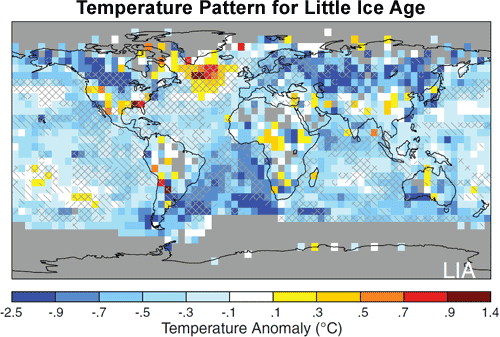
There is also an examination of temperature patterns during the Little Ice Age. There is pronounced cooling over the Northern Hemisphere continents. However, some regions such as parts of the Middle East, central North Atlantic, isolated parts of the United States and tropical Eurasia displaying warmth comparable to present day.

Figure 2: Reconstructed surface temperature anomaly for Little Ice Age (1400 to 1700 A.D.). Temperature anomalies are defined relative to the 1961– 1990 reference period mean. Gray areas indicates regions where adequate temperature data are unavailable.
What does this all mean? To claim the Medieval Warm Period was warmer than today is to narrowly focus on a few regions that showed unusual warmth. However, when we look at the broader picture, we see that the Medieval Warm Period was a regional phenomenon with other regions showing strong cooling. Globally, temperatures during the Medieval Period were less than today.
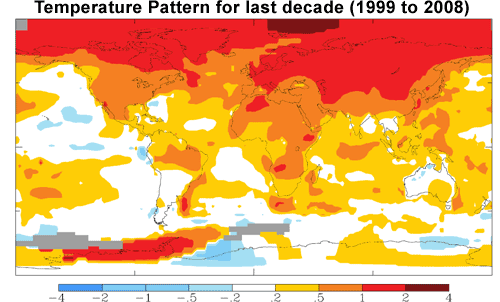
UPDATE 29 Nov 2009: NewYorkJ makes the suggestion of comparing the Medieval Warm Period temperature pattern to modern times. Here is the temperature anomaly for the last decade (1999 to 2008). As the color scale from the NASA map covers a broader range from -4C to 4C, I've edited the colours so they more closely match the MWP colour range.

Figure 3: Surface temperature anomaly for period 1999 to 2008. Temperature anomalies are defined relative to the 1961– 1990 reference period mean. Gray areas indicates regions where adequate temperature data are unavailable (NASA GISS)
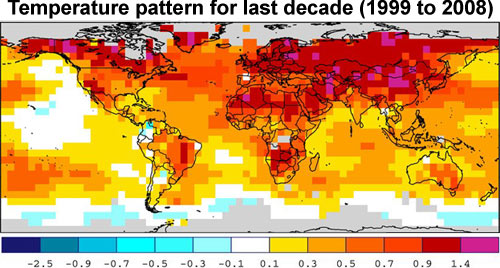
UPDATE 1 Dec 2009: gp2 has also created a temperature pattern for the last decade using NOAA data. This time, the colour scale matches exactly the colour scale used in the Medieval Warm Period figure.

Figure 4: Surface temperature anomaly for period 1999 to 2008. Temperature anomalies are defined relative to the 1961– 1990 reference period mean. Gray areas indicates regions where adequate temperature data are unavailable (NOAA)
Posted by John Cook on Saturday, 28 November, 2009


