Figure 1: CO2 green line derived from ice cores obtained at Law Dome, East Antarctica (CDIAC). CO2 blue line measured at Mauna Loa (NOAA). Global temperature anomaly (GISS)
What The Science Says:
There are a number of forcings which affect climate (eg - stratospheric aerosols, solar variations). When all forcings are combined, they show good correlation to global temperature throughout the 20th century including the mid-century cooling period. However, for the last 35 years, the dominant forcing has been CO2.
Climate Myth: It cooled mid-century
"It was the post war industrialization that caused the rapid rise in global CO2 emissions, but by 1945 when this began, the Earth was already in a cooling phase that continued until 1975. With 32 years of rapidly increasing global temperatures and only a minor increase in global CO2 emissions, followed by 33 years of slowly cooling global temperatures with rapid increases in global CO2 emissions, it was deceitful for the IPCC to make any claim that CO2 emissions were primarily responsible for observed 20th century global warming." (Norm Kalmanovitch)
Figure 1 compares CO2 to global temperatures over the past century. While CO2 is rising from 1940 to 1970, global temperatures show a cooling trend. This is a 30 year period, longer than can be explained by internal variability from ENSO and solar cycles. If CO2 causes warming, why isn't global temperature rising over this period?
Figure 1: CO2 green line derived from ice cores obtained at Law Dome, East Antarctica (CDIAC). CO2 blue line measured at Mauna Loa (NOAA). Global temperature anomaly (GISS)
The broader picture in this scenario is to recognise that CO2 is not the only factor that influences climate. There are a number of forcings which affect the net energy flux into our climate. Stratospheric aerosols (eg - from volcanic eruptions) reflect sunlight back into space, causing net cooling. When solar activity increases, the net energy flux increases. Figure 2 shows a composite of the various radiative forcings that affect climate.
Figure 2: Separate global climate forcings relative to their 1880 values (image courtesy NASA GISS).
When all the forcings are combined, the net forcing shows good correlation to global temperature. There is still internal variability superimposed on the temperature record due to short term cycles like ENSO. The main discrepancy is a decade centered around 1940. This is thought to be due to a warming bias introduced by US ships measuring engine intake temperature.
Figure 3: Net forcing (Blue - NASA GISS) versus global land ocean temperature anomaly (Red - GISS Temp).
So we see that climate isn't controlled by a single factor - there are a number of influences that can change the planet's radiative balance. However, for the last 35 years, the dominant forcing has been CO2.
Additional insight into mid-century cooling comes from Impact of Global brightening and dimming on global warming (Wild et al 2007). The paper looks at trends in the amount of sunlight reaching the ground over the latter 20th century. Various factors can affect how much sunlight gets through to the Earth's surface, with the amount of aerosols in the atmosphere being the main contributor. And of course, the amount of sunlight reaching the surface will have an effect on global temperatures. Wild 2007 attempts to disentangle just how much contribution this surface dimming and brightening has on global temperature.
They start by looking at measurements of surface radiation from 1958 (when widespread measurements began). They find a period of "global dimming" from 1958 to 1990 where surface radiation fell. Afterwards, the dimming levels off and transitions to slight brightening from 1985 to 2002. While the warming during the period of solar dimming is moderate, the warming is more rapid in the last two decades where dimming was no more present.
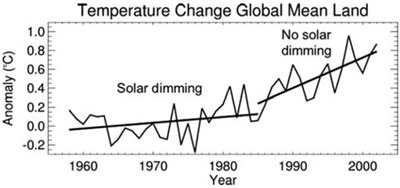
Figure 4: Temperature change over global land surfaces from 1958 to 2002 (Wild et al 2007).
How much does global dimming and brightening contribute to the temperature trends. To disentangle the effects of dimming and brightening from greenhouse warming, Wild digs a little deeper into the temperature record by looking at the daily temperature cycle. Sunlight affects the daily maximum temperature more than the nightly minimum, which is affected more by the greenhouse effect. What they find is from 1958 to 1985, during global dimming, the maximum daytime temperature falls. This makes sense as less sunlight is reaching and warming the Earth's surface. The interesting result is that over this period, the nighttime minimum temperature increases. While global dimming was cooling temperatures in the daytime, the increased greenhouse effect was warming in the nighttime.
From 1985 to 2002, the warming trend during the daytime increases significantly and almost catches up to the nighttime warming trend (almost but not quite). This is consistent with the surface radiation measurements which find global dimming levels off or transitions to brightening in the mid 1980s. Global dimming masked greenhouse warming until the 1980s. Once the atmosphere cleared and the dimming was removed, global warming came into its own.
Where did CO2 warming go during mid-century cooling? Global dimming caused by pollution masked the increased greenhouse effect. Nevertheless, the CO2 warming was still percolating away while we were sleeping.
Intermediate rebuttal written by John Cook
Update July 2015:
Here is a related lecture-video from Denial101x - Making Sense of Climate Science Denial
 |
The Skeptical Science website by Skeptical Science is licensed under a Creative Commons Attribution 3.0 Unported License. |