


 Arguments


Confusing Greenland warming vs global warming
What the science says...
This argument uses temperatures from the top of the Greenland ice sheet. This data ends in 1855, long before modern global warming began. It also reflects regional Greenland warming, not global warming.
Climate Myth...
Most of the last 10,000 years were warmer
Even if the warming were as big as the IPCC imagines, it would not be as dangerous as Mr. Brown suggests. After all, recent research suggests that some 9,100 of the past 10,500 years were warmer than the present by up to 3 Celsius degrees: yet here we all are. (Christopher Monckton)
This argument is based on the work of Don Easterbrook who relies on temperatures at the top of the Greenland ice sheet as a proxy for global temperatures. That’s a fatal flaw, before we even begin to examine the use of the ice core data. A single regional record cannot stand in for the global record — local variability will be higher than the global, plus we have evidence that Antarctic temperatures swing in the opposite direction to Arctic changes. Richard Alley discussed that in some detail at Dot Earth last year, and it’s well worth reading his comments. Easterbrook, however, is content to ignore someone who has worked in this field, and relies entirely on Greenland data to make his case.
Most of the past 10,000 [years] have been warmer than the present. Figure 4 shows temperatures from the GISP2 Greenland ice core. With the exception of a brief warm period about 8,200 years ago, the entire period from 1,500 to 10,500 years ago was significantly warmer than present.
This is Easterbrook’s Fig 4:
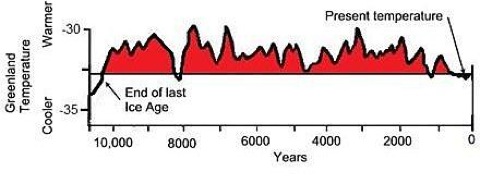
It’s a graph he’s used before, in various forms, almost certainly copied and altered from the original (click image below to see source: the NOAA web page for Richard Alley’s 2000 paper The Younger Dryas cold interval as viewed from central Greenland, though DE credits it as “Modified from Cuffy and Clow, 1997″, misspelling Kurt Cuffey’s name in the process:

Easterbrook continues:
Another graph of temperatures from the Greenland ice core for the past 10,000 years is shown in Figure 5. It shows essentially the same temperatures as Cuffy and Clow (1997) but with somewhat greater detail. What both of these temperature curves show is that virtually all of the past 10,000 years has been warmer than the present.
This is his Fig 5:
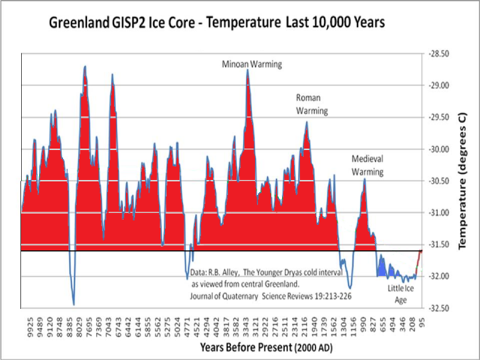
Easterbrook plots the temperature data from the GISP2 core, as archived here. Easterbrook defines “present” as the year 2000. However, the GISP2 “present” follows a common paleoclimate convention and is actually 1950. The first data point in the file is at 95 years BP. This would make 95 years BP 1855 — a full 155 years ago, long before any other global temperature record shows any modern warming. In order to make absolutely sure of my dates, I emailed Richard Alley, and he confirmed that the GISP2 “present” is 1950, and that the most recent temperature in the GISP2 series is therefore 1855.
This is Easterbrook’s main sleight of hand. He wants to present a regional proxy for temperature from 155 years ago as somehow indicative of present global temperatures. The depths of his misunderstanding are made clear in a response he gave to a request from the German EIKE forum to clarify why he was representing 1905 (wrongly, in two senses) as the present. Here’s what he had to say:
The contention that the ice core only reaches 1905 is a complete lie (not unusual for AGW people). The top of the core is accurately dated by annual dust layers at 1987. There has been no significant warming from 1987 to the present, so the top of the core is representative of the present day climate in Greenland.
Unfortunately for Don, the first data point in the temperature series he’s relying on is not from the “top of the core”, it’s from layers dated to 1855. The reason is straightforward enough — it takes decades for snow to consolidate into ice.
And so to an interesting question. What has happened to temperatures at the top of Greenland ice sheet since 1855? Jason Box is one of the most prominent scientists working on Greenland and he has a recent paper reconstructing Greenland temperatures for the period 1840-2007 (Box, Jason E., Lei Yang, David H. Bromwich, Le-Sheng Bai, 2009: Greenland Ice Sheet Surface Air Temperature Variability: 1840–2007. J. Climate, 22, 4029–4049. doi: 10.1175/2009JCLI2816.1). He was kind enough to supply me with a temperature reconstruction for the GRIP drilling site — 28 km from GISP2. This is what the annual average temperature record looks like (click for bigger version):

I’ve added lines showing the average temperatures for the 1850s (blue) and the last 10 years (red), and the difference between those is a warming of 1.44ºC. I’ve also added the two most recent GISP2 temperature data points (for 1847 and 1855, red crosses). It’s obvious that the GRIP site is warmer than GISP2 (at Summit Camp). The difference is estimated to be 0.9ºC on the annual average (Box, pers comm).
Let’s have ago at reconstructing Easterbrook’s Fig 5, covering the last 10,000 years of GISP2 data. It looks like this (click for bigger version):
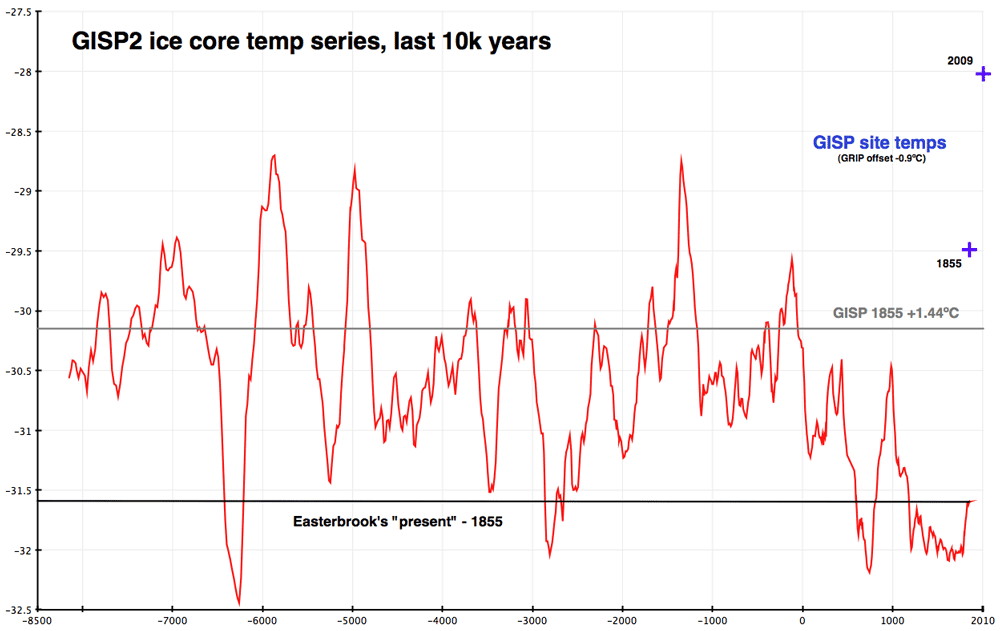
The GISP2 series — the red line — appears to be identical to Easterbrook’s version. The bottom black line shows his 1855 “present”, and it intersects the red line in the same places as his chart. I’ve added a grey line based on the +1.44ºC quantum calculated from the GRIP temperature data, and two blue crosses, which show the GISP2 site temperatures inferred from adjusted GRIP data for 1855 and 2009.
Two things are immediately apparent. If we make allowance for local warming over the last 155 years, Easterbrook’s claim that “most of the past 10,000 [years] have been warmer than the present” is not true for central Greenland, let alone the global record. It’s also clear that there is a mismatch between the temperature reconstructions and the ice core record. The two blue crosses on the chart show the GISP site temperatures (adjusted from GRIP data) for 1855 and 2009. It’s clear there is a calibration issue between the long term proxy (based on ∂18O measurement) and recent direct measurement of temperatures on the Greenland ice sheet. How that might be resolved is an interesting question, but not directly relevant to the point at issue — which is what Don Easterbrook is trying to show. Here’s his conclusion:
So where do the 1934/1998/2010 warm years rank in the long-term list of warm years? Of the past 10,500 years, 9,100 were warmer than 1934/1998/2010. Thus, regardless of which year ( 1934, 1998, or 2010) turns out to be the warmest of the past century, that year will rank number 9,099 in the long-term list. The climate has been warming slowly since the Little Ice Age (Fig. 5), but it has quite a ways to go yet before reaching the temperature levels that persisted for nearly all of the past 10,500 years. It’s really much to do about nothing.
1855 — Easterbrook’s “present” — was not warmer than 1934, 1998 or 2010 in Greenland, let alone around the world. His claim that 9,100 out of the last 10,500 years were warmer than recent peak years is false, based on a misunderstanding or misrepresentation of data.
The last word goes to Richard Alley, who points out that however interesting the study of past climate may be, it doesn’t help us where we’re heading:
"Whether temperatures have been warmer or colder in the past is largely irrelevant to the impacts of the ongoing warming. If you don’t care about humans and the other species here, global warming may not be all that important; nature has caused warmer and colder times in the past, and life survived. But, those warmer and colder times did not come when there were almost seven billion people living as we do. The best science says that if our warming becomes large, its influences on us will be primarily negative, and the temperature of the Holocene or the Cretaceous has no bearing on that. Furthermore, the existence of warmer and colder times in the past does not remove our fingerprints from the current warming, any more than the existence of natural fires would remove an arsonist’s fingerprints from a can of flammable liquid. If anything, nature has been pushing to cool the climate over the last few decades, but warming has occurred.
See also: MT at Only In It For The Gold. My thanks to Richard Alley and Jason Box for their rapid response to my questions.
NOTE: This rebuttal is an edited version of a blog post first published by Gareth Renowden at Hot Topic.
Intermediate rebuttal written by Gareth
Update August 2015:
Here is a related lecture-video from Denial101x - Making Sense of Climate Science Denial
Last updated on 4 August 2015 by MichaelK. View Archives


peter @50:
10,000 years is not exactly "short term".
Further, the behaviour of stocks and commodities and the behaviour of ice cores as a proxy for local temperatures are rather different, for what I hope are rather obvious reasons. If you are trying to make a claim about ice cores based on stock or commodity charts, you are doing it wrong.
So, you're going to need to provide citations - to papers regarding the Greenland ice cores, not to papers discussing equity markets - to support your assertions.
I read this thread and am shocked by what I'm reading. The data that Richard Alley uses does not end in 1855, nor does it use 1855 as any sort of "present". Nor does the snow have to be compacted into firn and then the firn into ice, in order to date the annual layers, or for these layers to be usable in isotope measurements. In his books and papers, for example his book "Two Mile Time Machine", Doctor Alley goes into detail about the snow pits, roughly 6 feet deep, that they were digging in the current and previous year's snow, where they could see the first annual layer by eye. The snow was described as being about 2 or 3 feet per year in fresh snow, which packs down to about 1 foot per year in firn/ice. I am very suspicious in the assertion by Tom Curtis that Alley's study ends in 1855, and much of his reasoning for claiming so. I need to see evidence of this. I can see where Tom Curtis claimed to have emailed Alley and asked him, and got a reply from Dr. Alley, but also find this to be a copy and paste from another person who emailed Alley, which means Mr. Curtis probably never actually emailed Dr. Alley at all. It's astonishing that nobody has corrected this fabrication so far.
Mike Hillis @52, perhaps you would be less shocked if you actually read for comprehension.
Firstly, I have never claimed (nor ever have) emailed Richard Alley. The person claiming to have emailed Richard Alley is the author of the OP, ie, Gareth.
Secondly, neither the article, nor any comment by me, claims that Alley used 1855 as the present. Rather, we have claimed that the fist datum point in the Alley data is at -95 (specifically 0.0951409 thousand years before present), and that the standard age of "the present" in geology used for dating Before Present is 1950. Combining these two facts, we determine by arithmetic that the first datum in the Alley data is at 1855. You may have difficulty reading, and be shocked by, arithmatic - but that is your problem, not mine.
Thirdly, what has been confirmed by Richard Alley in the email to Gareth that when he referred to "years before present" in the data and article with out explicitly stating he was not following the standard custom, he was in fact following the standard custom. Given that it would have constituted an error in the document to do otherwise, that comes as no surprise.
Finally, snow pack exist up to the present and shows annual layers as you note. However, the holes within the snowpack containing the gas do not become air tight and hence preserve a record of prior atmospheric concentrations until decades after the fall of the snowpack. Indeed, not until they have been sealed by compression of overlying the overlying snowpack. How long it takes for that to happen depends on the rate of precipitation, which is slow at the GISP 2 sight at the top of the Ice Sheet.
"Finally, snow pack exist up to the present and shows annual layers as you note. However, the holes within the snowpack containing the gas do not become air tight and hence preserve a record of prior atmospheric concentrations until decades after the fall of the snowpack"
The temperature proxy in ice cores is measured using the isotopes of oxygen in the snow molecules themselves, not the gas trapped in it. In other words, some of the O (I call it O here rather than O2 because we are talking about the O in the H2O not the oxygen gas trapped in bubbles) is 16O and some is 18O. There is also 17O but that is not stable. The temperature record is made from the fact that more 18O atoms are found when temperatures are warmer. The proxy is extremely accurate because there is a big difference between O isotope levels in winter and summer snow of the same year, even the current year. It's not necessary to wait for the snow to turn into firn or ice, in fact the calibration is done using fresh snow and present day thermometers. Let me quote from Werner et al 2001:
"The observed present-day (spatial) relation between d 18O,
d D, and surface temperatures of polar sampling sites (Dahe et al., 1994; Dansgaard,1964; Johnsen et al., 1989; Lorius et al., 1979)
are taken as transfer functions to interpret temporal changes of the d-values as changes of surface temperatures at the drill site"
So, they measure current temperatures and isotopes at various current places (spatial) and use it to interpret temperatures in the ice cores (temporal), and refer to this as a transfer function.
[RH] For a previous article I contacted Dr Alley directly and asked him about the "before present" reference used for GISP2 data. He stated to me that "present" is the 1950 standard used for radiocarbon dating. The GISP2 data ends 95 years before present. Thus, 1950 minus 95 years is 1855.
The reason they use O isotopes instead of 1H and 2H (deuterium) is because the chemists who measure the isotope levels transfer the O from the H2O to CO2 molecule, because it's easier for them to deal with CO2 on the mass spectrometer, for reasons I won't get into now.
[RH] Rather than making random statements, you're going to need to make a point here.
The point is not random, I'm saying that if they had used deuterium and 1H then nobody would have made the above mistake, because there are no H2 bubbles in the ice. There are O2 bubbles, and I needed to clarify that nobody is measuring the isotopes of O2 gas bubbles, only the O in the ice molecules.
[RH] First address your error about dating of the GISP2 data. Then we can move on to the isotopic issue.
I see where the 1855 comes from now. Somebody, I suppose Easterbrook, is using a data set from a 2004 Alley paper about the Younger Dryas, in which he only uses enough data to clarify that event, starting from 95 years BP and going backwards. I assure you, that the ice cores were measured, not just from 1855 and back, but every single year. Just because that data is not included in this particular 2004 paper doesn't mean it doesn't exist. The GISP2 study painstakingly measured the isotope levels of EVERY year, right up to the fluffy snow on top of the summit.
[RH] The GISP2 temperature data end 95 years BP, which is 1855. Period.
Data series here.
http://depts.washington.edu/qil/datasets/gisp2_main.html
[JH] Per the SkS Comments Policy:
On that link, click the tab that says
"gisp2_measured.txt 664KB Complete GISP2 continuous sample results (2m to 3040m)"
The dates are given in BP which is 1950. A date of 0 is 1950 and positive numbers are before then, negative numbers are after then. The first datum point is -36.88 which means 1986
[JH] What's your point?
The point is, the data from the GISP2 ice cores, as shown on this link, give temperatures from 2 meters deep (1986) to 3040 meters deep (over 110,000 years BP). Your link to a 2004 Alley paper on the Younger Dryas does not contain all the available data.
The top 2 meters are not in the existing cores because they were the snow pit that I mentioned, which was shoveled out. But the isotopes for the top 2 meters were measured as well, as Alley states in "Two Mile Time Machine".
[JH] To whom is this comment directed?
[RH] How does any of this have any relevance to the main article?
Mike Hillis @52-60.
Back @52 you write that "it's astonishing that nobody has corrected this fabrication so far." Strong stuff but it is not clear to me what you are branding as "fabrication." Perhaps it would be good if we could begin by establishing what it is that constitutes this "fabrication."
To recap:
Mike Hillis @51:
Mike Hillis @57:
So we are quite clear, Alley (2000) in fact used data only extending to 1855. Easterbrook has continuously misrepresented that data by first purporting it continued through to 2000, and then (when the date of the most recent sample was pointed out), purporting that it continued through to 1905, despite the well known geological convention (and the confirmation by Richard Alley) that "Before Present" refers to years before 1950. In other words, the original article by Gareth, and discussion by me in various comments above have been accurate, and are now acknowledged by Mike Hillis as being accurate.
He has as yet provided no apology for his being "shocked" by the purported misrepresentation of these facts, which he now acknowledges to have been accurately stated. Even worse, he has made no apology for calling either the accurate statement of these facts (or possibly his invention that I claimed to have emailed Alley) a "fabrication".
I guess we can be at least grateful that he now understands the essential point of the article.
He still insists (correctly) that ΔO18 measurements for GISP 2 can be obtained till as recently as 1987 (ie, -37 BP). The data site he uses to prove that, however, states that "Between 1989 and 1993, the Greenland Ice Sheet Project 2 (GISP2) collected several ice cores from near the summit of the Greenland Ice Sheet"; and that "Above 180m depth the measured samples are from the 1989 B core; below 180m the 1990-1993 D core was used". From this we learn that there are at least two other cores from GISP 2 whose data is not listed at that site. Further, he only has evidence for one of those cores (the 1989 Core B) that it continues with data, effectively to the surface. (It excludes the last two year prior to collection, presumably because of the risk of contamination from setting up the site, or because the snow was insufficiently packed to be preserved in the core.) From these facts he cannot determine which core was used by Alley (2000), and nor can he determine that that core had data prior to 1855.
However, regardless of that, there is a reason why the temperature data from Alley (2000) should not include data to the surface, and indeed, not include any data prior to the closure of the firn. Alley (2000) in fact used the temperature data from Cuffey and Clow (1997). Cuffey and Clow did not just use ΔO18 measurements to determine temperature, but the estimated elevation changes as well:
Cuffey and Clow use a model based on snow accumulation and estimated margin retreat to determine elevation, but note that total gas barometry of the gas included in the ice provides a potential independent check of the elevation history (which they then discuss). This use of included gas as an independent check on elevation history provides a sufficient reason to only use data from when the firn had closed.
Please note that I am not saying that it is the reason. The Cuffey and Clow data may have terminated in 1855 simply because of the actual ice core they used, or for some other stated reason. However, because of the role of estimates in elevation in determining the temperature history, it cannot be assumed that ice from before the closure of the firn was equally suitable for determining the temperature history.
The fabrication of which I speak, is that the "myth" that most of the Holocene was warmer than now, is based on a comment made by Monkton, who based his opinion on one study by Dr. Easterbrook, who based his entire study on one truncated set of Greenland ice core data that ends in 1855, and that Dr. Easterbrook, a geologist, didn't know that the geological present is 1950, and had no access to data that continued beyond 1855, so he had to lie and pretend the ice cores showed more recent data than 1855.
Now the facts. The Holocene has been known to geologists since before Dr. Easterbrook was born. Hundreds of studies have been done for many decades, using as many methods as can be dreamed of, using every branch of science, history, and literature. The results of dozens of studies have been charted together giving us the spaghetti graphs that Dr Easterbrook probably learned in high school, all showing that the bulk of the Holocene was warmer than today. One such graph is here:
[TD] I hotlinked the wikimedia link. In future please do that yourself.
[TD] See the explanation of that image you linked to, on the post "The Two Epochs of Marcott and the Wheelchair." And before you criticize that, read "Real Skepticism About the New Marcott 'Hockey Stick'."
[Rob P] - Image now embedded in comment.
Mike Hillis @63.
So you claim that "the bulk of the Holocene was warmer than today" and in evidence present a graph of proxy records from Wikithing that shows the bulk of the Holocene was cooler than 2004. And since 2004, 'today' has been subjected to over a decade of AGW. So we should perhaps add in that 2004 temperature. 2015 was 0.28ºC warmer than 2004 and applying that addition, a very small part of the proxy records in the Wikithing graph are presented as being warmer than today, certainly not in any way "the bulk".
Am I missing something? Or does your claim require a bit more support?
Mike Hills
Yoe perhaps need to look at the graph from Wikipedia more closely. Although the graph doesn't give a citation for its source, and in fact the section in Wikipedia on this notes the need for more citations, the results in the graph are broadly in line with the various studies available.
So look at the black line, presumably the average of the several studies. If that line, at the far right, actually reflected today, now, the 21st century, your point might be valid. But it doesn't! As the creator of the graph clearly shows. They include an arrow indicating the temperature in 2004 - close enoughto now. Clearly showing a temperature higher than most of the black line.
And the inset panel also clearly shows what they label 'recent proxies' showing a steep rise since then.
Were temperatures largely falling during the Holocene? Yes, that is only what is expected.
Were temperatures at the start of the Holocene, before that fall somewhere around where they are today? Yes possibly, although this graph doesn't specifiy whether it is showing global temperatures, Northern Hemisphere temperatures or regional.
Were temperatures during the bulk of the Holocene higher than today? No. The very graph you use shows that.
Mike Hillis @63, point by point:
1) The quote by Monckton at the head of the article is simply an example of the myth being propogated. It is not, as you suggest, part of an evidentiary chain other than to the point that the myth exists, and is propogated by at least some climate change deniers. What is more, by claiming that it is a fabrication that "the "myth" ... is based on a comment made by Monkton", you imply that Monckton has been misquoted. Following the link for the quote and scrolling down to the second box on page three proves that to not be the case. Monckton was not misquoted. He has used the myth. But the article made no claim that Monckton is the only denier to use the myth, or that he was the primary person to propogate the myth, contrary to your suggestion.
Monckton also explicitly ties his opinion to the GISP 2 record in another document (PDF) where he produces this graph:
He captions it, "Warmer than today: most of the period since the end of the last Ice Age has been
warmer than the present by several degrees Celsius" and writes:
The comment about the 300 years shows clearly that he is treating the terminal period of the graph, which actually ends in 1855, as ending in approximately 1995.
As a side note, he (not unusually) mislabels the source of the data, which is Cuffey and Clow (1997).
2) You also dispute that Monckton got the idea from Easterbrook, but Easterbrook propogated the idea in 2008 (PDF), where he produced this graph the below graph, saying:
Again, the graph is claimed to depict "global warming during the past century" even though the last data point on the graph in fact occurs in 1855.
Easterbrook even predates Monckton on the "some 9,100 of the past 10,500 years were warmer" meme, with an article on WUWT in December, 2010 claiming that:
As a side note, I am puzzled as to how he determines that ranking. Using the GISP 2 temperature data cached by Alley, from 8,905 to 8,915 of the 10,500 years BP in that record are warmer than the terminal data point. For Easterbrook to gain his ranking, he must conclude that 2010 was significantly cooler than the year he considered to be 1905.
As a further side note, the 2010 article by Easterbrook is the one discusses by Gareth Renowden above.
3) No claim is made in the OP that Easterbrook came to his conclusion as the result of just one study. The claim that he did so is false, but the only fabrication involved is your attribution of that claim to the OP.
4) You claim it is absurd that Easterbrook, as a geologist, did not know that Before Present refers to before 1950 unless otherwise specified, but in the 2010 article, his reproduction of the Alley data clearly labels the x axis "Years before present (2000 AD)", thereby indicating that he took "present" in this data to refer to 2000, not 1950. So far as I am aware, he still does so.
5) Regardless of his reasons, the paper trail clearly shows Easterbrook labeling the data that terminated in 1855 as "present global warming" thereby indicating the tail of that graph to be the warming during the 20th century (see graph above). Later he clearly labelled that data on an axis for years BP, glossed as being 2000 with a final data point at 95 years BP, ie, 1905 according to his axis.
To summarize, the purported fabrications are easilly proved to be true from the paper trail, except for two cases where the "fabrication" consists entirely in your misrepresenting the OP.
Your record on "the facts" is equally poor. It is true that, but entirely irrelevant, that the Holocene was labelled long before Easterbrook was born. The studies of Holocene temperatures that lead to the "spaghetti graphs", however, are all recent (last thirty years or so), and the spaghetti graph you used does not come from a peer reviewed paper, and was originally produced in 2005. Easterbrook has in fact used that graph, as you would know if you followed the links to the original version of the article, and back to prior history. However, he first used the current version of the graph (produced on the 19th of July, 2010, less than a week before he used it, but only after considerable editing to make it look like this:
Compared to the original, you will note that he has removed the "spaghetti". More importantly, he has also removed the indication of the 2004 temperature, the inset showing recent proxies, together with the rapidly rising instrumental record. That is, he has removed any indication that modern temperatures are in fact higher than those shown. He does not note that the zero point on the axis is "mid 20th century average temperature", but instead inserts a line approximately 0.3 C below the mid 20th century average which he deceptively labels "Present day temperature". In all, his treatment of this graph is much worse than his treatment of the Alley 2000 data, and cannot be construed as anything other than a deliberate attempt to deceive his audience.
It is, however, extraordinarily unlikely that Easterbrook, who obtained his graduate degree in 1958, saw any spaghetti graph of Holocene temperatures in highschool (none having existed back then).
Finally, the graph you cite clearly shows even mid 20th century temperatures to have been warmer than the bulk of the Holocene, while late 20th century temperatures were warmer than the multidecadal average over the entire Holocene.
In short, your "facts" are fictions. In some cases ridiculous fictions you invented without basis. In others, fictions you invented in direct contradiction to known evidence - indeed, evidence presented in the OP in one case. Skeptical Science is not a form where you are permited to just spin tissues of fabrication. You are expected to support your claims with facts, something you have signally failed to do at any point in this discussion. It is also hoped (though not required) that you change your views if fae moderators take a dim view of any further unsupported claims, or gish gallops by you.
A slight ammendment to my preceding post. The version of the Global Warming Art holocene temperature record with more recent times to the right was available from Global Warming Art from as early as July 2007, even if it was not uploaded to wikipedia till 2010. Also, Easterbrook's cut down version appears as early as May 2010. My sentence immediately preceding the graph above is therefore false. It remains the case that he took that graph and modified it to remove all information indicating warmer modern temperatures, and falsely indicated a very low modern temperature on his version of the graph.
In fact, the "present day temperature" shown on Easterbrook's graph, is just the final data point on the Global Warming Art graph, and represents a gaussian smooth of the data with a 300 year resolution, for the year 1950. As such, it is representative of the temperatures in the century prior to 1950, and not representative of the temperatures after 1950.
Tom, it is you who are guilty of gish galloping. None of your rapid-fire arguments changes the basic error with the OP that I pointed out, namely, the following quote from the OP:
"it takes decades for snow to consolidate into ice."
I pointed out that there is no need for snow to pack down into ice before the isotope temperature proxy can be measured, and in fact, it can be done with freshly fallen snow. You made a mistake when you made a comment about the air bubbles in the ice being a factor, and I showed how nobody measures the isotopes in the bubbles, but in the water itself, whether it be snow, firn, or ice. This basic error invalidates the comment I quoted in the OP, and in the interest in scientific accuracy, the OP needs to be edited and corrected on that point. This is no gisg gallop, this is one very valid point.
I find fault with Easterbrook for not showing the warming of the past century, though. It certainly does not pass the scientific accuracy test. Pshaw on him.
[RH] In order for this conversation to move forward you first need to acknowledge that your original statement was incorrect where you say, "I read this thread and am shocked by what I'm reading. The data that Richard Alley uses does not end in 1855, nor does it use 1855 as any sort of 'present'."
The data being presented in the OP absolutely does end at 95 years before 1950, where 1950 represents "present." Thus, the data and graphs being discussed do end in 1855.
Moderation retracted
Mike Hillis @68, a gish gallop is "...the fallacious debating tactic of drowning an opponent in such a torrent of small arguments that the opponent cannot possibly rebut each one in real time". Unlike you, who included five falsehoods or misrepresentations in just your first sentence @63, I discussed each point in detail, with evidence. Further, each of my points was a rebutal of just one of your falsehoods or misrepresentations. There is therefore, no doubt as to who employed a gish gallop in this discussion. Thoroughly rebutted, you are not even able to muster a tu quoque, but rely instead of the barstardized play ground version, "No, you are...".
If that is not enough, the key feature of a gish gallop is final point:
Again, you do not have the class to pull even that of. Instead your claim of victory relies on a claim you did not even make @63, but rather earlier in the discussion - and which was refuted earlier in the discussion in any event.
What you do not seem able to get through your thick head is that neither Alley (2000a) and (2000b), nor Cuffey and Clow (1997), rely solely on a dO18 paleothermometer. Among other things Cuffey and Clow rely on a correction based on changes in the sites altitude over time, the later being determined by included gas composition (as discussed above). Alley (2000a) and (2000b) also rely on the temperature dependent gravitational difraction of heavier gases as it diffuses through the firn as a secondary paleothermometer, to that obtained from Cuffey and Clow. As both of these additional thermometers rely on included gas, it is quite appropriate for Alley to extend his data no further than the closure of the firn, even though the dO18 extended to 1987.
Unless you explicitly address these points in any further response, I will regard your further responses as mere sloganeering (which, truth be told, is all you have contributed to date) and not bother responding.
I find it all quite amusing to see folk bashing on regardless of the trail of nonsense they leave behind them up-thread although it is rather cruel to let them continue without comment.
Mike Hillis @68.
You appear on this thread @52 with all guns blazing & accusations of "fabrication" because, you tell us, (A) Alley (2000) uses data that does not end in 1855 & (B) Alley (2000) does not use 1855 as any sort of "present" & (C) that you can get usable isotope measurements from firn & snow.
Yet @57 you roll back the (A) accusation on 1855 being the latest data used by Alley (2000) & (B) that 95ybp = 1855 but (C) insist the isotope data does exist for later years.
(Note this already provides what the Moderator Response was asking for @68.)
As this position didn't appear to constitute a "fabrication" any more, and "fabrication" being such a strong position, you were asked & did restate your position @63, but an entirely different one, a whole new ball game. (D) It is a fabriation to assert that Easterbrook & Mad Lord Monckton have perpetrated a lie about holocene temperatures being mainly warmer than today. (E) The bulk of the holocene was warmer than today, but you then present a graphic of holocene temperatures which amusingly shows the exact opposite.
Now @68 we find Easterbrook is pshawed so persumably we can consider (D) & (E) to be retracted but (C), unmentioned since your comment @60, is restated @68.
Is it truly a "basic error with the OP" to state that "it takes decades for snow to consolidate into ice"? The OP statement quoted here is correct in itself. Further it does explain why Alley (2004) stopped his temperature reconstruction in 1855 which is a fundamental part of the post. I do not see here any "basic error."
Perhaps a challenge should be set for Mike Hillis. Isotope data can be and is taken from snow and this data can be and is dated and added to ice core isotope data. But where is this data published authoritatively as a temperature series? Alley (2004) provides such a temperature series but only to 1855. Is there an ice core/snow temperature series that continues to a later date?
[RH] Missed that. Moderation retracted @68.
(edit) At this point, it's unclear what Mike Hillis' complaint about the OP actually is. Perhaps he will endeavor to better clarify.
MA Rodger @70: "Is there an ice core/snow temperature series that continues to a later date?"
Kobashi et al (2011), discussed here, is probably what you are looking for. There reconstruction spans the last 4000 years (2000 BCE to 2000 CE), but terminates in 1993:
They find that 74 of the 400 decades (18.5%) were as warm as, or warmer than the decade from 2001-2010. That means that not less than 31.6% of decades over the last 10,000 years were cooler than the 2001-2010 average.
Tom Curtis @71,
Kobashi et al (2011) wasn't actually what I had in mind (although it does fit the description I presented @70). The method of Kobashi et al. is to use nitrogen & argon isotope ratios in the air bubbles. So this does not fit with the Mike Hillis assertion that the oxygen isotopes from H2O in snow layers provide a temperature proxy that can be seemlessly affixed to the ice isotope data, that it is effectively the same data series.
Kobashi et al. (2009) describes the method they use for their most recent proxy data thus:-
MA Rodger @72, I am guessing Alley and Koci (1990) is also not what you are after, as it reconstructs GISP 2 temperatures from measured temperatures in the bore hole. It is still informative:
I have added a line indicating 1855 for easy comparison, and it can be seen that 1855 is about 1.5 C cooler than modern temperatures. As Alley and Koci (1990) was referenced in Alley (2000b), it is further reason as to why Easterbrook should not have made his "mistake".
I have not been able to find dO18 based temperature reconstruction brought up to the late 20th century, but the dO18 values to 1987 are available online. I have used the temperature relationship specified in the University of Washington's annual dataset, along with the temperature relationship specified in Cuffey and Clow (1997), specifically T=(2.15 x dO18) + 43.4. I have compared the running decadal mean to that for the BEST Greenland data:
Just to be clear, the initial decade is 1823-1832. The final decade is 1978-1987 for the dO18 and 2003-2012 for BEST. The greater variability of the dO18 record is probably due to a combination of altitude changes, changes in the source moisture for preciptation, along with the fact that the record is from a single site. The temperature difference between 1850-1859 and 2003-2012 is 1.41 C on the BEST record, and is likely to have been similar in the dO18 record, had it been continued to the present. In any event, regardless of the method used (graviational defraction, borehole temperaures, dO18, or regional thermometers) the 1855 temperature is well below modern values.
MA Rodger said @70:
[Is it truly a "basic error with the OP" to state that "it takes decades for snow to consolidate into ice"? The OP statement quoted here is correct in itself. Further it does explain why Alley (2004) stopped his temperature reconstruction in 1855 which is a fundamental part of the post. I do not see here any "basic error."]
It's not an error to say it takes time to consolidate snow to ice, but it's misleading, because the snow does not need to consolidate to measure the 18O isotopes, and because this is long before the Argon/Nitrogen bubble study there is no reason to consider the entrapment of bubbles in the ice via consolidation. The OP claims that there is no isotope proxy after 1855 because of this reason, which is utterly wrong.
MA Rodger said @70:
[Perhaps a challenge should be set for Mike Hillis. Isotope data can be and is taken from snow and this data can be and is dated and added to ice core isotope data. But where is this data published authoritatively as a temperature series? Alley (2004) provides such a temperature series but only to 1855. Is there an ice core/snow temperature series that continues to a later date?]
I already gave a link to this data series in posts 58 and 59. Those measurements were done on the ice cores by the University of Washington, after they had been moved to the US (Alley et. al. made their measurements in a sheltered laboratory in Greenland.) I see Tom Curtis links to that study in @73.
Alley stopped his temperature data at 1855 in his paper on the Younger Dryas, not because that's the latest data he had, but more likely because he was writing about an event at the beginning of the Holocene and anything after 1855 was not relevant to the Younger Dryas. I'm sure that Alley had at his disposal, all the data after 1855, and I'm sure he also was aware of the 1999 University of Washington measurements on the same cores.
If it's helpful, the core study at the University of Washington was started around 1997 when Kurt Cuffey was a grad student there, and completed in 1999 after he got his doctorate and went to Berkeley. Also, one of his professors at Penn State during his undergrad years was, guess who.