Climate Science Glossary

Term Lookup

Enter a term in the search box to find its definition.

Settings

Use the controls in the far right panel to increase or decrease the number of terms automatically displayed (or to completely turn that feature off).

Term Lookup

Settings


All IPCC definitions taken from Climate Change 2007: The Physical Science Basis. Working Group I Contribution to the Fourth Assessment Report of the Intergovernmental Panel on Climate Change, Annex I, Glossary, pp. 941-954. Cambridge University Press.

Home Arguments Software Resources Comments The Consensus Project Translations About Support

Twitter Facebook YouTube Mastodon MeWe

RSS Posts RSS Comments Email Subscribe


Climate's changed before
It's the sun
It's not bad
There is no consensus
It's cooling
Models are unreliable
Temp record is unreliable
Animals and plants can adapt
It hasn't warmed since 1998
Antarctica is gaining ice
View All Arguments...


Username
Password
New? Register here
Forgot your password?

Latest Posts

Archives

What has global warming done since 1998?

What the science says...

Select a level... Basic Intermediate

Every part of the Earth's climate system has continued warming since 1998, with the ten record temperature years all occurring since 2010.

Climate Myth...

It hasn't warmed since 1998

For the years 1998-2005, temperature did not increase. This period coincides with society's continued pumping of more CO2 into the atmosphere. (Bob Carter)

At a glance

This date-specific talking-point is now something of a historical curiosity, but we'll leave it in the database for now because it's such a good illustration of the simplistic yet reckless mindset of the serial climate change misinformer. And indeed, we could (out of sheer mischief) have revised this myth by replacing "1998" with "2016". In fact, that's what we started to see in the climate change misinformation stream, © the Usual Suspects. But 2023's record temperatures put a stop to that.

Anyway, as first predicted over a century ago, Earth's surface, oceans and atmosphere are all heating up. That's due to our increasing greenhouse gas emissions, but over the years the warming has occurred at varying rates. This should in no way come as a surprise. Other physical phenomena periodically act either to suppress or enhance temperatures.

A prime example of such a phenomenon is the effects of La Nina and El Nino. This natural climatic oscillation features variations in winds and sea surface temperatures over the tropical eastern Pacific Ocean. The cycle can at times strongly influence temperature and rainfall patterns right around the world.

In a La Nina year, temperatures are suppressed, whereas an El Nino year sees them enhanced. This is noise on the long-term upward trend. That's why climatologists work with multiple decades, not just a few years in isolation, in order to get a grasp on what is going on.

The year 1998 featured a massive El Nino. The temperature spike it caused was a huge outlier, like a pinnacle towering over the landscape of the temperature record. In the following years there was a return to more typical conditions, with an erratic but upward warming pattern. That sequence of events gave deniers a brief opportunity to insist that global warming had “paused” or had even stopped.

You only need to remember one thing here. Those who create and spread misinformation about climate change don't care about reality. Public confusion is their aim. In this instance, the misinformation exercise involved deliberately selecting a limited block of years starting with the massive El Nino of 1998 and using that very warm starting-point to insist that global warming had stopped. They knew this would likely work for a few years and that the public would quickly forget why that was the case. Mother Nature had handed them a gift. It was an irresistible bunch of low-hanging fruit to exploit: little wonder the tactic is known as 'cherry-picking'.

Talking about reality, what actually happened? Well, as of 2024, a couple of decades down the line, the top ten warmest years have all been since 2010, whatever observation-based dataset you choose, with eight of them being in the 2015-2023 period. 1998 is nowhere to be seen any more. By modern standards, it simply wasn't warm enough.

Please use this form to provide feedback about this new "At a glance" section, which was updated on May 27, 2023 to improve its readability. Read a more technical version below or dig deeper via the tabs above!


Further details

Even if we ignore long term trends (something deniers often do in order to make a point) and just look at the record-breakers, as of early 2024 the top ten warmest years have all been since 2010, whatever dataset you choose, with eight of them being in the 2015-2023 period. In this top ten grouping, 1998 is nowhere to be seen any more. It was not warm enough.

The myth of no warming since 1998 was largely based on the satellite record estimates of the temperature of the atmosphere.  However, as discussed in the video below by Peter Sinclair, even that argument is no longer accurate.  The satellites show warming since 1998 too.

There's also a tendency for some people just to concentrate on atmospheric or surface air temperatures when there are other, more useful, indicators that can give us a better idea how rapidly the world is warming. More than 90% of global warming heat goes into warming the oceans, while less than 3% goes into increasing the atmospheric and surface air temperature.  Records show that the Earth has been warming at a steady rate before and since 1998 and there is no sign of it slowing any time soon (Figure 1). 

Fig 1

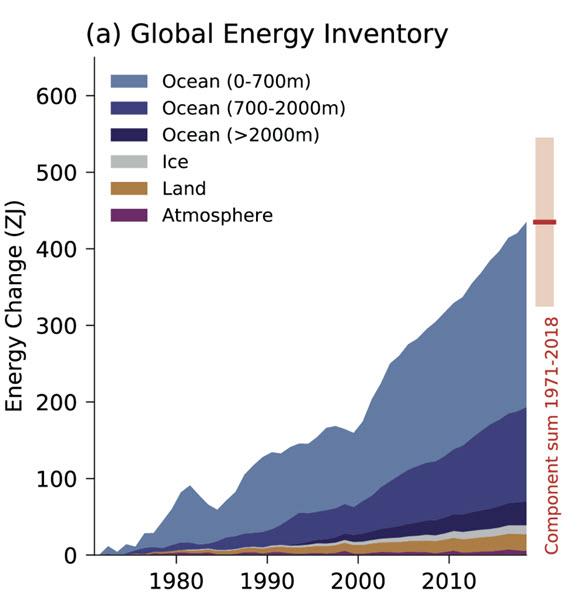
Figure 1:  Global Energy Inventory: observed changes in the global energy inventory for 1971–2018 (shaded time series) with component contributions as indicated in the figure legend. Cross-Chapter Box 9.1 Figure 1 (part a) - From IPCC AR6 WGI Chapter 9.

Even if we focus exclusively on global surface temperatures, Cowtan & Way (2013) shows that when we account for temperatures across the entire globe (including the Arctic, which is the part of the planet warming fastest), the global surface warming trend for 1997–2015 is approximately 0.14°C per decade.

Ultimately, every part of the Earth's climate system is warming, and has continued warming since 1998.

Last updated on 8 March 2024 by John Mason. View Archives

Printable Version  |  Offline PDF Version  |  Link to this page

Argument Feedback

Please use this form to let us know about suggested updates to this rebuttal.

Further reading

Tamino further explores the warming trend since 1998 in Garbage is Forever and Wiggles.

I've kept my original treatment of the subject as other websites hotlink to the images. My original treatment uses similar arguments to Fawcett and Jones 2008 although their analysis is much more rigorous (as you'd expect in a peer-reviewed paper).

Further viewing

Comments

Prev  1  2  3  4  5  6  7  8  9  10  11  12  13  14  15  16  17  Next

Comments 76 to 100 out of 407:

  1. The Tamino post in further reading is no longer active. Fortunantly, the wayback machine can help us.
    Response: [Daniel Bailey] Thanks; that one and many more recoverable lost Open Mind posts are linked at the Archive.
  2. I have been struggling with a concept that seems to be conceded by [--snip--] and [--snip--] alike: that the super el ninio of 98-99 raised global average temperature. At what time scale is the global energy budget reconciled? If the answer is anually, to concede this point means that the ocean-atmospheric system had to draw down some "fossil" savings account to boost the temperature.
  3. Decades? Ocean cycling is something close to 1000 years. ESNO amounts to ocean/atmosphere heat transfer. You dont see much sign of "draw down" on the OHC to 2000 meters shown in #40 of this thread, let alone total global energy budget.
  4. My best understanding is that el ninos are thought to be caused by an atmospheric failure of trade winds into the ITC in the easern Pacific, depriving the tropical Americas of the oceanic Ekman transport that fosters upwelling. The reverse would presumably be true for la ninas. If I may be forgiven an observation as a naturalist rather than an expert, I have been watching the SST anomalies in this years la nina and it appears to me that the cold water is emerging in a standpipe plume (a point source)in the western Pacific and splaying eastward against the prevailing winds and currents. If the ENSO and possibly other ocillations have deep enough pockets to skew global average temperature that much, and the periods of the ocillations appear irregular, how do we know anything at a decadal scale?
  5. Its a coupled ocean/atmosphere phenomena. Tricky to assign a "cause" to the atmosphere. Why do the trades fail? However, the point really is that upwelling is heat exchange. Look at total OHC. If the current warming was just an ocean cycle, then why is total OHC increasing? So far decadal prediction eludes us. That's why climate is defined in terms of 30 year averages. What the overprint of global warming tells you is that the temperature of the peaks in ENSO events of the same magnitude is increasing.
  6. scaddenp at 06:57 AM, if total OHC measured 0-2000m is increasing, whilst OHC 0-700 is not, then what mechanisms are allowing this to happen. If it is due to the atmosphere/ocean interaction, then SST's will show that, but they don't, actually trending down the last 8 years or so. For the deeper ocean 700-2000m to be accumulating heat whilst 0-700m is not, it can only mean, assuming measurements are adequate and accurate, that whatever solar radiation being absorbed in the upper layers is either being offset somehow or being speedily transferred to the lower levels. But that amounts to a lot of heat that has to transfer through the surface, and then 700m of water, without leaving a trace, to deposit enough heat in 1300m of water, enough to cause the average OHC of 2000m of water to increase.
    Response:

    [DB] "If it is due to the atmosphere/ocean interaction, then SST's will show that, but they don't, actually trending down the last 8 years or so."

    Demonstrably false:

  7. Convection? More marked in upper ocean. As SSTs are not trending down. The upper 700 do show ESNO variation. I don't see the problem here.
  8. Response: [DB] "Demonstrably false:" Demonstrably wrong! The image you posted is the anomaly for the entire period Feb 2003-2011 against the average 1951-2002, so it is irrelevant to the very simple observation I had made. This image, even at the scale it is, allows the downtrend to be observed. Perhaps you could instead produce actual data for the last 8 years that can be examined in finer detail if you believe that this image does not support my assertion.
    Response:

    [DB] Wreeennncccch (sounds of metal protesting as goalpost are moved)!

    As it stands, your initial phrase was false, so I pointed it out. And it still is, as you specified no comparator period. Where your logic falls apart is in your cherry-pick of a short period of time that is statistically insignificant. So let's recompute, using the period shown in your graphic (why 60S-60N when more data is available?):

    Yup, still false.

  9. Ignoring for a moment the futility and folly of using short-term trends (less than 15 to 20 years), consider the linear trend in global SSTs from Hadley for different periods of time. Note what happened between 1979 and 1987. Now can we please stop playing this juvenile and unscientific game of cherry picking "skeptics"?
  10. DB, the reason it still appears false to you, is that you haven't changed anything. It is still the complete period Feb 2003-2011 that you are using as a benchmark instead of examining what is plainly evident within that period. I think that you took your eye of the pea whilst trying to switch thimbles. There was no comparator period necessary, the trend of the period covered by the last 8 years is the subject in question. The challenge still stands, if you believe that there is no downtrend evident over the last 8 years then produce the relevant data that can be analysed. If you are now going to start claiming 8 years is insignificant, then why did you start using a 8 year period to try and make a point. Further to the point of being consistent, if data beyond 60S-60N is that important to you then why did you start posting maps that indicate no data beyond that point. Also it would help tremedously if your replies were made in the same manner as all other participants so that your posts appear at the top of the comments page as they are made. That also allows the order of each response being posted to be followed if replies to different posts, and different posters, are being made.
    Response:

    [DB] You've made an extraordinary claim, were called on it and have since hastily waved hands while backtracking. The burden of proof is on you to prove your claim with some actual analysis, not for others to disprove it.

  11. johnd #85: "if you believe that there is no downtrend evident over the last 8 years then produce the relevant data that can be analysed." Produced here and here. Just look up this very thread or at a number of other 'global warming stopped in ... ' threads. If you're going to be a serious skeptic, you must try harder.
  12. muoncounter at 11:33 AM, your "here and here" links do not lead to SST data.
  13. DB, on the comments page your responses are labeled as below. Moderator Response: [DB] You've made an extraordinary claim, were called on it and have since hastily waved hands while backtracking. The burden of proof is on you to prove your claim with some actual analysis, not for others to disprove it. ......................... ( -Moderation complaints snipped- ). ( -Moderation complaints snipped- ). I have not backtracked at all. The assertion I made was very, very simple and straight forward. It is you in fact that is backtracking, having first producing irrelevant information in order to challenge my assertion, now having thrown your hands in the air and deciding it's impossible and trying to turn it around. I have nothing that disproves what is evident on the graph I supplied, sorry. End of story I think.
    Response:

    [DB] Again, you made an (unfounded) assertion simply unsupported by the science and data at hand, you were called on it and have done little since but wave your hands, backtrack and complain about it.

    It is up to the asserted to support claims with published peer-reviewed literature and/or analysis of their own which supports their contentions (this is called science). Which you have not done and complain about having to do. That is your choice and right.

    The readers of, and the participants in, this forum remain skeptical of your claims until then.

  14. johnd #87: No, those links point to global temperature anomalies. Following the data trail, one finds oceans included in those global temperatures. More data are better, yes?
  15. muoncounter at 12:40 PM, only for those unable to distinguish the difference between quality and quantity. You were saying......?

  16. I find this a little irrelevant but I am a little out of depth. To me the "its the ocean's" argument runs like this. "An ocean cycle is causing the warming" Okay, so where is the energy coming from. "Well out of the oceans of course" So if is warming is just cycle of ocean atmosphere energy exchange, then why is total OHC increasing? I thought is was supposed to lose energy to atmosphere. Someone with more knowledge of this can tell me what I am missing.
    Response:

    [DB] Good question. If it's the ocean (discussed here), then OHC anomaly should be net zero. Since it isn't (it's actually positive, as you point out), than the ocean is retaining energy/heat (because of the Earth's radiative imbalance), despite the continual loss of heat to the atmosphere and to the melting of Arctic ice (Patrick Lockerby just released his March Arctic Ice Update #2).

    See the links I just gave you for relevant discussion; a search on the term "It's the ocean" yields these results. Hope that helps.

  17. RE: #7 response: Response: The cool temperatures of Jan 2008 are due to an unusually strong La Nina effect (the strongest in a decade). Did the models predict this "strongest in a decade" La Nina and if so could you point us to the statement where this was predicted before it actually occurred
  18. Bruce @92, The forecasts for 2010-2011 can be found here for IRI. Also see here for CPC.
  19. Bruce#92: "Did the models predict this "strongest in a decade" La Nina" What an utterly irrelevant question. Climate forecasts deal with long term trends, not transient weather events. To answer the question of this post, see Tamino: No, global warming did not stop in 1998: "Big wheel keeps on turnin'"
  20. I would like to ask if anyone is aware if there have been any refutations of this paper http://arxiv.org/PS_cache/arxiv/pdf/0907/0907.1650v3.pdf by Stockwell and Cox? I have been following the climate debate for some time - especially on Drum. I really have no truck with Cox as I find his approach to be dishonest and dissembling. But I have to say I find this paper to be pretty sound? I really hate to give Mr Cox any credence or airtime at all if it's not justified. But I also believe in maintaining an open mind. My own approach to AGW was one of a genuine sceptic. When I first encountered suggestions of AGW back in the late 80's as a newly minted PhD in physics I was fairly dismissive - I felt in particular that the heat capacity of the ocean and solar irradiance variations would be much more powerful forces. But in the early "noughties" as the issue gained more attention I did my own secondary research (the wonders of the internet) and one by one my doubts were addressed by the evidence. Actually your site with the neat little thermometer down the side is a fairly apposite reflection of my own doubts that have been addressed. I am now convinced of the realities of AGW and have been since about 2003. Those who deny the science really upset me for their ignorance and blindness bias but I always try and maintain an open mind. I confess I've sometimes been fairly "direct" and forceful in some of my comments posted on the Drum. Over the years I've checked on many so called "refutations" of AGW in the "literature" - always to find that either the publication is highly suspect (such as "Energy & Environment" or anything published by Bentham Science ) or if the journal is good the paper gets comprehensively refuted - such as the case with G. Gerlich, R. D. Tscheuschner: Falsification Of The Atmospheric CO2 Greenhouse Effects Within The Frame Of Physics. International Journal of Modern Physics B, Vol. 23, No. 3 (30 January 2009), 275-364 - I'm AMAZED that even got published - complete piffle but I guess the technical "density" (pun intended) of it proves that "bullshit baffles brains". I'd like to think my "science bullshit" detectors are pretty acute but this paper by Stockwell and Cox actually seems sound to me. The journal is reputable. The Chow test is very valid, and whilst it was developed I believe for econometric data it can really be applied to any time series analysis. Also, looking at the temperature data one can reasobaly conlude that there do appear to be step changes and therefore it's not an "invalid" basis for forecasting. IF they are right it doesn't suggest AGW isn't real - only that the size and scope of the problem is much lower than we feared and most scientists have suggested. I can't see that they've made the usual "error" of cherry picking their data points (a la Carter) Given that this issue - how far/how fast will we warm - is I think the one genuine area where there is room for scientific uncertainty then I must, out of intellectual honesty, pay attention to their findings. Of course Stockwell and Cox don't explore what mechanisms might be at work that may have mitigated warming lately - they are only interested in creating doubt not genuine physics. I might even speculate that the recently reported grand solar minima may be at play, not to mention that aerosol effects may indeed be more than we had thought - but at this point have not been able to find any papers that have really examined that hypothesis - namely that warming may be temporarily in a reprieve due to such effects. I have found on New Scientist articles that suggests the solar minima phenomenon may at most mitigate things by 0.3 degrees - but I'm not a subscriber so can't access the full article Anyway - love this site. But in the genuine spirit of open minded sceptical inquiry I would really like to know if anyone is aware of any rebuttals of the paper above or can suggest any ideas?
  21. The abstract of Stockwell and Cox suggests a rather poor grasp of multiple hypothesis testing and the nature of cherry picking. Finding a statistically significant result does not refute the possibility of cherry picking. If you look at 100 independent events (e.g. trends at different site), at the 95% level you would expect to see five statistically significant events even if all trends were due to random chance. Cherry picking is about searching for events that make your argument, in contradiction to the broader picture; this is still possible if you restrict yourself to "statistically significant" events. Also it is rather unsurprising that there is a change in the datasets around 1997. In 1998 there was an extremely strong El-Nino event. It is difficult to detect the difference in a noisy dataset between a step change and a linear trend with a quasi cyclical variability (ENSO). Physics provides an answer, the linear trend model has a plausible physical explanation, can the same be said of the step change model? I'll comment again when I have read the rest of the paper. This is just my impression from the abstract.
  22. Having skimmed the paper, it looks to me like another case of someone thinking stats trumps physics; they are wrong, it is the other way round (I am a statistician, and I greatly prefer a model with a strong physical explanation than merely statistical support). The Chow test is not reliable in this case, as it is based on sum-of-squares errors, which implicitly assumes a Gaussaan noise process. However the noise process for climate data is non-gaussian; it has a quasi periodic cyclic component, due to ocean circulation such as ENSO. Now if they were to find a step change in the data after it had been adjusted for the effects of ENSO (i.e. look at the resudials of a regression of temperatures on MEI, as has been done frequently), that would be a different matter entirely. I very much doubt that the Chow test would identify a step change in that case, which would mean that surface temperatures are affected by ENSO, something we have known for decades. The reason that Easterling and Wehner find periods of low warming or cooling is exactly that - internal climate variability. Secondly, it is obviously cherry picking to start a trend at a conspicuous maximum. This is true even if you include statistical significance becuase if you optimise the start date to bias the result in a particular direction (e.g. by choosing to start at a maxima) then it invalidates the significance test anyway. Essentially you are performing many simultaneous significance tests, one for each start point. Each test has a probability of a false-positive or a false-negative. If you pick and choose the test to make the argument you want, you vastly increase the overall chance of a false-positive or false-negative, and hence it is cherry picking. In stats this is the "multiple hypothesis testing problem". Lastly, using the start point of the dataset is not cherry picking, it doesn't mean the results are robust to the choice of start point. It is not reasonable to expect a linear trend in temperatures on a centennial scale; climate forcings have changes in many ways over that period - solar forcing explains much of the waming in the first half of the 20th century, aerosol cooling explains a mid-century plateau and CO2 radiative forcing has become dominant from the late sixties. So the Chow test is a bit of a straw man. It is always going to find a break point, simply because the linear trend is known to be wrong. That doesn't mean that it is a step change though, that is just the only alternative offered to the straw man of a linear centennial scale trend. I suspect that if they had started in say 1960 (giving a period where CO2 radiative forcing is asserted to be dominant according to e.g. the IPCC), I suspect the Chow test would no longer identify a step change because a linear trend over that period is more plausible. The paper shows a lack of self-skepticism. Has the paper been published in a peer reviewed journal? If so, I'll give it more than just a skim, but as (essentially) a statistican, I am not impressed by it.
  23. Yes I've come across this Stockwell and Cox paper before. Aside from the dubious affiliation (I mean has anything scientifically worthwhile come out of the Institute of Public Affairs?), it just seemed to me like a bunch of statistical description with a very limited attempt to place the data in the context of a credible physical model.
  24. The paper was submitted to Journal of Forecast but hasn't been published, not there at least. The statistics leave much to be desired, physics is absent; but even if they were sound, they discovered that the climate in Australia is sensitive to no less than the nearby ocean! How could they come to global conclusion and even make projections remains a mistery.
  25. Cheers Riccardo (good summary ;o). If it does get published, it would be good if a peer-reviewed response were submitted. Submitting it to the Journal of Forecast is a neat trick, they wouldn't be able to get it published in a climate journal because of the lack of physics, the reviewers at JoF are likely to be only able to review the stats, but not the significance of the findings to climatology. Obviously that won't stop some drawing firm conclusions about climate from it.

Prev  1  2  3  4  5  6  7  8  9  10  11  12  13  14  15  16  17  Next

Post a Comment

Political, off-topic or ad hominem comments will be deleted. Comments Policy...

You need to be logged in to post a comment. Login via the left margin or if you're new, register here.

Link to this page


The Consensus Project Website

THE ESCALATOR

(free to republish)


© Copyright 2024 John Cook
Home | Translations | About Us | Privacy | Contact Us