Climate Science Glossary

Term Lookup

Enter a term in the search box to find its definition.

Settings

Use the controls in the far right panel to increase or decrease the number of terms automatically displayed (or to completely turn that feature off).

Term Lookup

Settings


All IPCC definitions taken from Climate Change 2007: The Physical Science Basis. Working Group I Contribution to the Fourth Assessment Report of the Intergovernmental Panel on Climate Change, Annex I, Glossary, pp. 941-954. Cambridge University Press.

Home Arguments Software Resources Comments The Consensus Project Translations About Support

Twitter Facebook YouTube Mastodon MeWe

RSS Posts RSS Comments Email Subscribe


Climate's changed before
It's the sun
It's not bad
There is no consensus
It's cooling
Models are unreliable
Temp record is unreliable
Animals and plants can adapt
It hasn't warmed since 1998
Antarctica is gaining ice
View All Arguments...


Username
Password
New? Register here
Forgot your password?

Latest Posts

Archives

What has global warming done since 1998?

What the science says...

Select a level... Basic Intermediate

Every part of the Earth's climate system has continued warming since 1998, with the ten record temperature years all occurring since 2010.

Climate Myth...

It hasn't warmed since 1998

For the years 1998-2005, temperature did not increase. This period coincides with society's continued pumping of more CO2 into the atmosphere. (Bob Carter)

At a glance

This date-specific talking-point is now something of a historical curiosity, but we'll leave it in the database for now because it's such a good illustration of the simplistic yet reckless mindset of the serial climate change misinformer. And indeed, we could (out of sheer mischief) have revised this myth by replacing "1998" with "2016". In fact, that's what we started to see in the climate change misinformation stream, © the Usual Suspects. But 2023's record temperatures put a stop to that.

Anyway, as first predicted over a century ago, Earth's surface, oceans and atmosphere are all heating up. That's due to our increasing greenhouse gas emissions, but over the years the warming has occurred at varying rates. This should in no way come as a surprise. Other physical phenomena periodically act either to suppress or enhance temperatures.

A prime example of such a phenomenon is the effects of La Nina and El Nino. This natural climatic oscillation features variations in winds and sea surface temperatures over the tropical eastern Pacific Ocean. The cycle can at times strongly influence temperature and rainfall patterns right around the world.

In a La Nina year, temperatures are suppressed, whereas an El Nino year sees them enhanced. This is noise on the long-term upward trend. That's why climatologists work with multiple decades, not just a few years in isolation, in order to get a grasp on what is going on.

The year 1998 featured a massive El Nino. The temperature spike it caused was a huge outlier, like a pinnacle towering over the landscape of the temperature record. In the following years there was a return to more typical conditions, with an erratic but upward warming pattern. That sequence of events gave deniers a brief opportunity to insist that global warming had “paused” or had even stopped.

You only need to remember one thing here. Those who create and spread misinformation about climate change don't care about reality. Public confusion is their aim. In this instance, the misinformation exercise involved deliberately selecting a limited block of years starting with the massive El Nino of 1998 and using that very warm starting-point to insist that global warming had stopped. They knew this would likely work for a few years and that the public would quickly forget why that was the case. Mother Nature had handed them a gift. It was an irresistible bunch of low-hanging fruit to exploit: little wonder the tactic is known as 'cherry-picking'.

Talking about reality, what actually happened? Well, as of 2024, a couple of decades down the line, the top ten warmest years have all been since 2010, whatever observation-based dataset you choose, with eight of them being in the 2015-2023 period. 1998 is nowhere to be seen any more. By modern standards, it simply wasn't warm enough.

Please use this form to provide feedback about this new "At a glance" section, which was updated on May 27, 2023 to improve its readability. Read a more technical version below or dig deeper via the tabs above!


Further details

Even if we ignore long term trends (something deniers often do in order to make a point) and just look at the record-breakers, as of early 2024 the top ten warmest years have all been since 2010, whatever dataset you choose, with eight of them being in the 2015-2023 period. In this top ten grouping, 1998 is nowhere to be seen any more. It was not warm enough.

The myth of no warming since 1998 was largely based on the satellite record estimates of the temperature of the atmosphere.  However, as discussed in the video below by Peter Sinclair, even that argument is no longer accurate.  The satellites show warming since 1998 too.

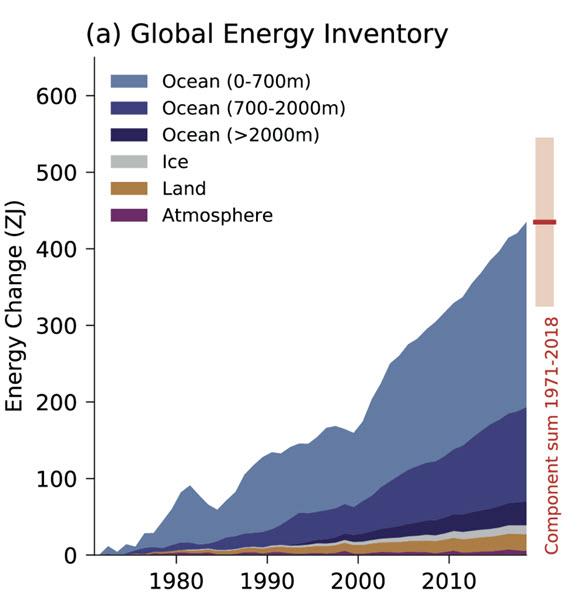
There's also a tendency for some people just to concentrate on atmospheric or surface air temperatures when there are other, more useful, indicators that can give us a better idea how rapidly the world is warming. More than 90% of global warming heat goes into warming the oceans, while less than 3% goes into increasing the atmospheric and surface air temperature.  Records show that the Earth has been warming at a steady rate before and since 1998 and there is no sign of it slowing any time soon (Figure 1). 

Fig 1

Figure 1:  Global Energy Inventory: observed changes in the global energy inventory for 1971–2018 (shaded time series) with component contributions as indicated in the figure legend. Cross-Chapter Box 9.1 Figure 1 (part a) - From IPCC AR6 WGI Chapter 9.

Even if we focus exclusively on global surface temperatures, Cowtan & Way (2013) shows that when we account for temperatures across the entire globe (including the Arctic, which is the part of the planet warming fastest), the global surface warming trend for 1997–2015 is approximately 0.14°C per decade.

Ultimately, every part of the Earth's climate system is warming, and has continued warming since 1998.

Last updated on 8 March 2024 by John Mason. View Archives

Printable Version  |  Offline PDF Version  |  Link to this page

Argument Feedback

Please use this form to let us know about suggested updates to this rebuttal.

Further reading

Tamino further explores the warming trend since 1998 in Garbage is Forever and Wiggles.

I've kept my original treatment of the subject as other websites hotlink to the images. My original treatment uses similar arguments to Fawcett and Jones 2008 although their analysis is much more rigorous (as you'd expect in a peer-reviewed paper).

Further viewing

Comments

Prev  1  2  3  4  5  6  7  8  9  10  11  12  13  14  15  16  17  Next

Comments 126 to 150 out of 407:

  1. Rickoxo#124: "if Tamino said Curry screwed up bad for making her statement that there is no evidence global warming hasn't stopped, wouldn't the exact same argument apply to Muller's statement?" In a word, no. First off, let's lose the double negatives and translate Curry's statement: 'There is evidence that global warming stopped.' This, as shown by tamino, is clearly false. For a change in trend (warming stopped) to be considered as evidence, it must be statistically significant - or else it is just more than likely noise. Muller's statement: "We see no evidence of it [global warming] having slowed down." That's consistent with the statement made in the FAQ and the requirement that evidence be statistically significant. All else (including this spin job by some very frantic denialists) is noise. Further discussion of this Curry/Muller question should go to this new thread.
  2. 124, Rickoxo, On Curry's statement vs. Muller's, this is logic 101. Curry says "A is proven to be true." (i.e. A = the globe has been cooling). Muller says "There is no evidence of A." Muller's statement is not the opposite but equal of Curry's. Curry's statement is false not because A is false, but because there is no valid evidence to support her statement A. Muller's statement is true not because A is either true or false, but rather because it is a statement about the evidence, not about proposition A itself. Do you see the difference?
  3. Rickoxo @124, I am in broad agreement with Dana, muoncounter and Sphaerica. However, using the term in a very technically correct way, what Muller said was false. That is irrelevant, however, because he was speaking to the popular press, and in popular usage, people say "There is no evidence that p" when they mean "There is no significant evidence that p" or, "The overwhelming balance of evidence is that not p". Substituting "there has been no pause in global warming" for p and we find that in popular usage, Mullers claim is true. For an examination of the pedantic meaning of evidence, see the posts by Dikran Marsupial and myself on the new thread.
  4. The world has not warmed since 1998 according to UAH, RSS, and NOAA. Most weather websites have said that 1998,2005, and 2010 are a three way tie with no real difference therefore the world hasn't warmed since 1998. Even if it did...would only have been 0.02 c at most. Not significant at all.
  5. 129, tanahano, Seriously? You actually posted that comment? Please take the time to click on the "Intermediate" tab above, read that poast in its entirety, understand it, and then get back to commenting.
  6. tanahano @129, can I write to your employer suggesting that he pays you half your current hourly rate on Tuesdays and Thursdays. According to you, that would not represent a pay cut because your maximum dayly pay for any given week will not have been reduced. Or do you only use the statistically absurd definition of warming in which only the maximum is relevant to the trend when trying to deny global warming?
  7. Contrary to certain absurd claims being made by "skeptics", the climate system has continued to accumulate energy since the cherry-picked 1998. In fact, between 1998 and 2008 another ~50x10^21 Joules of energy were accumulated/retained in the climate system, despite an increase in aerosol loading since 2000 and a prolonged solar minimum after solar cycle 23 (since 2003). [Source]
  8. 130 Sphaerica So, if I understand correctly, for global warming to be seen to be stopped, we would have to see steady temperatures in both the atmosphere and the oceans. Just one of these is not sufficient. Is this correct?
  9. 133, SirNubwup, No. To have some confidence (one can never "know") that warming has stopped you would need to see 17 consecutive years in which you see no trend (mind you, that's not 17 years of no warming each year, but instead no trend in that span of 17 years) in both the atmosphere and the oceans. One would hope that in that same period you would also see an halt in the melting of glaciers and arctic ice and other indicators of a warming world.
  10. SirNubwub... You have to pause a moment and think about it though. What are the chances that we're going to see any kind of cooling trend? The radiative properties of CO2 are very clear. It's basic physics. Increased levels of CO2 are going to warm the planet. If that's somehow not happening, then there's about 150 years of well established science to rework (i.e., that's not a very likely scenario). The chances that "global warming has stopped" is extremely unlikely. Where real science is operating right now is a matter of how much warming we're going to see from the expected increases in atmospheric CO2. Is the IPCC central estimate of 3.0C for 2XCO2 correct? Is it slightly lower? 2.5C? Or is it actually higher? ~4.0C? The difference between climate sensitivity of 2.5C and 4.5C has major implications for what human society needs to do to address the situation.
  11. Re: SirNubWub What exactly do you mean by the phrase "global warming has stopped"? More specifically, what exactly do you mean by "global warming"? There are many measures of the temperature of the planet: - near-surface air temperatures over land (i.e., typical weather station data) - tropospheric temperatures from satellites or radiosondes - sea surface temperatures - deeper ocean temperatures At any time, one or more of these can decrease for a period, even if overall heat content is still rising. Examples would be the redistribution of heat related to ENSO. At any time, there may be temporary decreases in one or more of these, due to such factors as volcanic eruptions, anthropogenic aerosols, solar output, etc. The effect of the top-of-atmosphere radiation imbalance caused by increased atmospheric CO2 leads to increased energy retention somewhere in the earth-atmosphere system, but it doesn't mean that every temperature, everywhere is constantly increasing. The implication of most "global warming has stopped" statements from deniers is to claim "global heating due to CO2 has stopped", in an attempt to discredit the strong science that tells us the effects of adding CO2 to the atmosphere. This implication is unjustified, misleading, deceptive, disingenuous, illogical, specious, unfounded, unscientific [insert favourite synonym here]. To make an analogy, the "global warming has stopped" claims are pretty much equivalent to claiming that the furnace in my house has stopped heating because I opened a window on a cold winter day and one room's temperature has dropped. The furnace is still pumping just as much heat into the system, and temporary, localized effects that show cooling don't change what the furnace is doing. You don't conclude the furnace is broken, when you know that the temporary/local cooling is caused by the open window. The effects of a volcanic eruption can be seen in a short-term temperature record. The effects of ENSO can be seen in a short-term temperature record. The effects of a short-term change in solar output can be seen in a short-term temperature record. The effects of a slow, steady imbalance due to rising atmospheric CO2 cannot be seen in a short-term temperature record, and that means that short-term records also cannot show that the effect isn't there. It is an obfuscation by deniers to pretend that short-term variations in an global temperature record disprove greenhouse gas theory. To detect that slow, steady signal in the noise, you need longer records. Long enough to be statistically significant.
  12. SirNubwub, you can get a clearer picture of what is really going on if you remove known sources of natural variation from the temperature as was done in this paper. Corrected graphs look like Not much sign of "global warming" stopping there is there? What do you figure will happen to temperature records in the next El Nino? Now perhaps you think that El Nino event will suddenly stop, but then perhaps you note that 2011 was hottest ever year with a La Nina event.
  13. 134 Sphaerica Yes, I should have included the 17 year thing. That's fine. I just wanted to know what would qualify as an end (or pause) of warming. 135.Rob Honeycutt I am not discussing the probabilities of things or the validity of the foundational science. I am just wondering what I need to see in the data for the skeptics to have a point when they say "warming has ended". 136 Bob Loblaw By the phrase "global warming has stopped" I mean "the total heat content of the global environment is no longer increasing". 137 scaddenp Thank you for the graph. I will look at the paper. everyone: I am not posting any comments or questions to this website in order to convince anyone of anything. I just want to get a better understanding of the proper response to many of the skeptic's positions. So, I have learned that the last decade's supposed pause in rising temperatures really isn't a pause. There is still a trend going up. The heat content of the environment is still going up. In order for the skeptics to be able to say "see, it stopped" we would have to see steady temperatures in both land and air for at least 17 years. All of this is fine. I don't have any arguments with any of it. I will move on to learn more about other topics on the website.
  14. SNW: Thank you for a very reasoned response. There's a lot to learn; we all benefit from informed debate.
  15. SirNubwub... What you're describing is exactly what "Trenberth's Travesty" is all about. The work Kevin Trenberth does is, basically, doing a full accounting of where the heat energy is going within the climate system. The "travesty" he talks about is the fact that science is still so limited in its ability to track where that heat is going. We have top of atmosphere measurements that tell us the planet is retaining heat, but we primarily look at only one measure that directly relates to us, and that's surface temperature. So, when there is a slowdown in surface temperature, it's not because the Earth is retaining less heat energy, it's because the heat energy is moving around in places where we can't adequately measure it.
  16. SirNubWub: By the phrase "global warming has stopped" I mean "the total heat content of the global environment is no longer increasing". OK, so to further discuss this, if you are viewing the deniers positions (I intentionally use denier instead of putting "skeptic" in scare quotes) - choosing one metric (e.g. surface air temperatures) is wrong, because that is not a complete representation of the system. When you say "both land an air", that is still not complete, as it ignores deeper oceans. - there is still a disconnect between the concepts of "total heat content" and the changes in heat content due to atmospheric CO2 increases. Total heat content depends on more than just CO2 forcing. It is not unexpected to see total heat content decrease if other forcing factors besides CO2 push things that way. To pretend that this disproves the warming effect of increasing CO2 is to ignore the sound science that tells us that other factors do play a role. This is a major inconsistency in the deniers positions: on the one hand, they argue that climate science ignores factors other than CO2 (they don't); while on the other hand they make an argument that doesn't make sense unless you do ignore other factors. (I think I should write this up and contribute it to the Contradictions page.) To deal with this latter issue (other factors affecting heat content will temporarily obscure the slow change forced by CO2, you have two common ways of dealing with it: 1) take data over a long enough time that the short-term fluctuations cancel out (that's where the 17+ years argument comes in) 2) account for the short-term effects and remove them from the measurements, so that the long-term trend is easier to see. That were studies like Foster and Rahmstorf (as discussed on Tamino's blog come in.
  17. Bob Loblaw Crap...I said "land and air" and i should have said "oceans and air"....sorry.
  18. I do feel there needs to be a better explanation of why the global mean temperature increase appears to have stalled. If I look at the UK metoffice statistics going back over 100 years now, the graph shows that the winter mean temperature has barely changed over this entire period in the UK. Granted, The other 3 seasons of the year show a marked increase since 1978, but if CO2 is responsible for global warming and climate noise disappears after 30 years, why are UK winters immune to the greenhouse effect?
  19. Mace - You are probably correct in that a better explanation exists. It is however somewhat counter-intuitive for most. The oceans are by far the largest reservoir of heat on the planet. They cover over 70% of the Earth's surface and over 90% of global warming is going into the oceans. If we consider the ocean depths down to 2000 metres, then global warming has not slowed down at all, just global surface temperatures. It's just that all that heat is building up below the surface layers of the ocean. Basically what the recent Foster & Rahmstorf paper found is that when you eliminate the natural variability, the man-made global warming signal emerges. We have some posts coming up that put this all into perspective.
  20. mace It is pointless to look at the temperatures in one tiny country for one season for evidence ablut global temperature changes. The UK is pretty much the worst place you could choose to look as U.K. temperatures are buffered by the atlantic ocean (as most of our weather comes from the west). If you look at the IPCCs projections for regional temperature change, you will find that the UK is a place where climate change is expected to be rather modest. 30 years is about enough time to blot out most of the natural variability in global temperatures. Longer will be needed for regional and subregional temperatures as the signal to noise ratio is smaller the smaller the region you consider (because the spatial averaging reduces variability just as temporal averaging does). You will always be able to cherry pick some data that seems to suggest a lack of warming, but it is just that, a cherry pick. If you really want to understand the climate of the British Isles, I suggest you read this book on the topic.
  21. In one breath, we have "why the global mean temperature increase appears to have stalled" - well Foster & Rahmstorf 2011 deal to that. Next breath we have a UK only data used to support the assertion? Classic cherry picking. This sounds like repeating a meme from a denialist site. Care to tell us which one?
  22. mace#143: "why the global mean temperature increase appears to have stalled." It hasn't stalled. See the Foster and Rahmstorf thread. "The resultant adjusted data show clearly, both visually and when subjected to statistical analysis, that the rate of global warming due to other factors (most likely these are exclusively anthropogenic) has been remarkably steady during the 32 years from 1979 through 2010. There is no indication of any slowdown or acceleration of global warming, beyond the variability induced by these known natural factors." It would be helpful if, as scaddenp suggests, you provided the source of these assertions: '___ says temperature increase appears to have stalled.'
  23. I know that the this website has ably answered my questions about the apparent pause in warming. However, I would like to know your response to the news that NASA and CRU have stated that there has been no significant warming in the last 15 years. http://www.dailymail.co.uk/sciencetech/article-2093264/Forget-global-warming--Cycle-25-need-worry-NASA-scientists-right-Thames-freezing-again.html I understand that CRU is NOT dismissing the past or future affects of CO2. The interesting statement is just that temps have remained level for the last 15 years. I have not been able to find the actual paper by CRU, so perhaps the newspaper is misrepresenting CRU's statements. Does anyone have the original paper?
  24. SirNubWub, you seem to be confusing 'The Daily Mail' newspaper with NASA and the CRU. Yes, The Daily Mail claims that NASA and the CRU said something... but they're (-snip-). Disagree? Then cite the spokesperson for NASA and/or CRU who said these things.
    Response:

    [DB] Please refrain from such verbiage without more of a definitive proof offered.

  25. correction: It was the Met office and CRU. It wasn't a NASA paper, but rather NASA researchers are used in other parts of the story.

Prev  1  2  3  4  5  6  7  8  9  10  11  12  13  14  15  16  17  Next

Post a Comment

Political, off-topic or ad hominem comments will be deleted. Comments Policy...
You need to be logged in to post a comment. Login via the left margin or if you're new, register here.

Link to this page


The Consensus Project Website

THE ESCALATOR

(free to republish)


© Copyright 2024 John Cook
Home | Translations | About Us | Privacy | Contact Us