


 Arguments


Recent Comments
Prev 3 4 5 6 7 8 9 10 11 12 13 14 15 16 17 18 Next
Comments 501 to 550:
-
John Mason at 18:16 PM on 4 December 2023At a glance - Evidence for global warming
@Paul #30:
Fair enough and I have encountered you at RC too, but it might be more appropriate to post about ENSO in a thread specifically about ENSO, for example:
https://skepticalscience.com/el-nino-southern-oscillation.htmThat page has not yet been updated like many of our rebuttals, but it will be in due course.
-
Paul Pukite at 15:46 PM on 4 December 2023At a glance - Evidence for global warming
"If that's your motivation it seems well and good, but why did you choose to interject on this thread?"
Had an account here for many years and thought I would test the waters for discussion on bleeding-edge research, which is what ENSO is all about. I do have my own blog so it's not like an alien thing for me to raise a discussion point,
-
One Planet Only Forever at 07:28 AM on 4 December 2023At a glance - Evidence for global warming
Paul Pukite,
I like John Mason’s question @26. But would extend it as follows: “...why did you choose to interject on this thread...” the way that you did @2?
Though you have not directly addressed the questions I raised @4 regarding your comment @2, your latest comments appear to indicate an awareness that it was incorrect to state that there was no similar warming in “the middle of the equatorial Pacific” [quote from you @2] (I agreed that it is worthy of being thrown away). But I still do not see indications of awareness that it was also wrong to try to justify that incorrect assertion by misrepresenting the paper you linked @2 with a ‘quote-clearly-out-of-context’.
Making incorrect statements with questionable or made-up justifications and then arguing against attempts at clarification and correction of the incorrect belief is similar to the behaviour of the regular denizens of sites like WUWT and Dr. Roy Spencer.
I wish you luck in your endeavours to ‘constantly learn more about ENSO – constantly changing your mind as you learn more’.
-
michael sweet at 00:13 AM on 4 December 2023At a glance - Evidence for global warming
I note that Arhennius predicted in 1896 that the tropics would heat up slower that the poles and the ocean would heat up slower than the ocean. Since the global average heating is about 1.2 C, we woud expect less than 1 C warming in the tropical ocean.
-
michael sweet at 00:07 AM on 4 December 2023At a glance - Evidence for global warming
Paul Pukite,
At post two you said "Not the middle of the equatorial Pacific." Referring to the comment "All these show a similar warming trend."
At post 7 you said "when one searches for equatorial Pacific ocean SST time-series, you only get NINO34, NINO4, etc data. These show no or very little trend,"
I entered the thread to show that your comments were false. My illustration at post 9 clearly demonstrates that you were incorrect. You posted a graph at post 13 claiming no trend, asserting that the graph had not been detrended. My post at 21 showed your graph was detrended and your claims of no trend in the tropical ocean are simply false.
Now at 23 you post a graph that is actually not detrended and use your eyecrometer to claim your graph is more informative than my illustration. Using my eyecroneter on my illustration I see clearly that the trend is closer to one degree. If you put a least squares line on your graph we would have data instead of idle speculation. All these trends can easily be Googled, you are simply not looking.
I have proved beyond doubt that your claim that the tropical oceans "show no or very little trend," is completely false. The fact that you produced a graph that was not detrended and showed a trend after claiming a detrended graph showed there was no trend indicates that you are not interested in a discussion of the science here.
If you want to speculate on ENSO causes go for it As I understand it, ENSO is essentially random on a yearly basis.
-
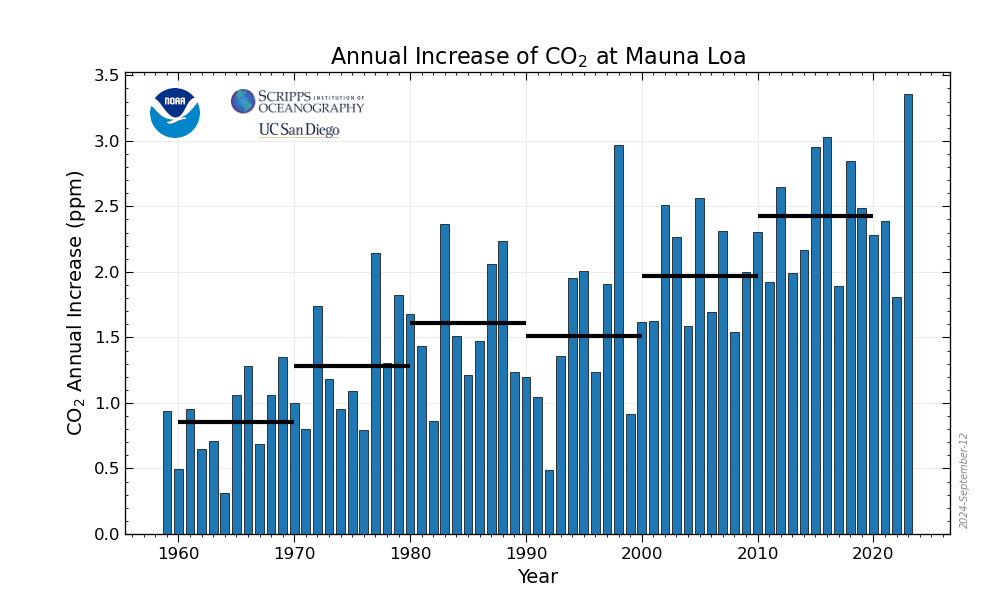
Evan at 21:49 PM on 3 December 20232023 SkS Weekly Climate Change & Global Warming News Roundup #48
Although I do not disagree with the conclusion of the lead article here that CO2 concentrations are rising at alarming rates, it is incorrect to compare levels from one year to the next, simply because natural variability causes up and down swings in individual readings.
A 10-year running average shows that the rate of increase of CO2 is continuing to increase. This alone is alarming and concerning, but focusing on changes during a single year is excessively alarming.
-
BaerbelW at 18:27 PM on 3 December 2023Breathing contributes to CO2 buildup
Please note: the basic version of this rebuttal has been updated on December 3, 2023 and now includes an "at a glance“ section at the top. To learn more about these updates and how you can help with evaluating their effectiveness, please check out the accompanying blog post @ https://sks.to/at-a-glance
-
John Mason at 17:37 PM on 3 December 2023At a glance - Evidence for global warming
@Paul#25:
If that's your motivation it seems well and good, but why did you choose to interject on this thread?
-
Paul Pukite at 16:27 PM on 3 December 2023At a glance - Evidence for global warming
I don't think you have any idea what my objective is. I frankly don't worry about modeling AGW as that's in good hands, IMHO. Instead, what I have been trying to do the last several years is model natural climate variations such as ENSO, AMO, PDO, etc. You may find it odd, but not observing a large contribution of an AGW signal in a time-series such as NINO34 actually makes it easier to do the modeling since the signal vs noise discrimination is more apparent. In other words, the underlying trend is so small relatively speaking that it doesn't matter if the time-series is detrended or not when fitting a model to the data.
So based on my actual research interests, I would much rather discuss ideas concerning forcing factors behind ENSO — including tidal & annual — than deconstructing my phrasing in a tossed-off comment. If you want to delve into modeling of the geophysical fluid dynamics and how neural nets and machine learning may be helping in revealing patterns instead of pedantic point-scoring, I am game. I will grant you a win on all the petty stuff as you seem so determined to play gotcha on a comment I made based on dealing with the data for years now.
-
One Planet Only Forever at 14:11 PM on 3 December 2023At a glance - Evidence for global warming
Paul Pukite @23,
I will continue to pursue the points I raised regarding your comment @2.
I am confident that nigelj’s comment about similar trends was regarding ‘a trend like the global average surface temperature data - warming rather than cooling with more significant warming occurring after 1950 than prior to 1950’.
Your comment @2, and later comments except for your latest @23 (sort of), appear to insist that it is not possible to have confidence regarding a warming trend in the NINO 3.4 region (the middle of the equatorial Pacific).
Your comment @2 starts with:
"All these show a similar warming trend." [nigelj’s point]
Not the middle of the equatorial Pacific. (your response)As my comments should indicate, I learned from and accepted nigelj’s finding of an explanation about the current models indicating a larger amount of warming in the equatorial Pacific (especially the east part) than the actual observations. However, as I commented, that does not alter the incorrectness of your comment @2. But you do appear to have finally accepted your incorrectness (sort of) by ‘seeing’ a warming trend in the NINO 3.4 SST data.
However, I am still confident that it is incorrect to declare that having confidence that ‘the NINO 3.4 SST historical data indicates warming similar to the global average surface temperature data’ requires an accurate explanation for the trend being lower than the current global climate models for that region and it requires that understood influence to be removed from the SST values.
The data is what it is regardless of the mechanisms producing it. Large variations of the temperature data simply requires a longer duration of the data set to have confidence that there is a warming trend. And a lower trend rate will also require a longer data set to establish confidence.
The NOAA presentation of the centered 30-year base periods (linked here) that I provided a link to in my comment @16 helpfully presents the trend of the SST NINO3.4 data set in spite of significant variations in the data values. Each 30-year period contains a substantial variety of the variation. Comparing the 5 year steps for the data starting in 1936 shows that there is indeed a recent trend (more significant after 1950 than before 1950 – consistent with the NINO3.4 chart you included in your comment @23). The 1966 to 1995 values, and all the more recent ones, are clearly warmer than the earlier ones. However, it also shows that the ENSO perturbations in the data are large enough to make the warming trend hard to be confident of, even appearing to potentially be a cooling trend in a shorter data set. The 1981 to 2010 results are not clearly warmer, and may even be cooler, than 1976 to 2005.
Global average surface temperature data evaluations using the SkS Temperature Trend Calculator (linked here) can also provide an example supporting my confidence that the ‘noise’ of ENSO variations do not need to be removed to be able to have confidence regarding a trend.
As I indicated in my comment @17, using the GISTEMPv4 dataset in the SkS Temperature Trend Calculator (linked here) the trend of the data after 1950 is 0.152+-0.018 C / decade (high confidence of a warming trend). I add the following set of shorter recent time periods and the resulting trend and level of confidence (2 sigma value compared to trend value):
Years Trend +- 2 sigma
2016 to 2023 = -0.148 +- 0.513
2015 to 2023 = -0.066 +- 0.428
2014 to 2023 = +0.074 +- 0.379
2013 to 2023 = +0.180 +- 0.331
2012 to 2023 = +0.244 +- 0.289
2011 to 2023 = +0.284 +- 0.249
2010 to 2023 = +0.262 +- 0.220
2005 to 2023 = +0.229 +- 0.129The longer the time period is the more confidence there is in the evaluated trend. Admittedly the global average surface temperature variation in the evaluations is only about 2 degrees C. So a longer time period would be expected to be required for the NINO SST values because they have larger variation of temperature and a smaller trend. But confidence regarding the trend can still be established without a detailed understanding of the mechanisms at play. And I am confident that the authors of 2012 report you (mis)quoted in your comment @2 had reason to be confident with their evaluation and reporting (repeating part of the quote I had included in my comment @4)
“...While centennial trends are not assessed here, we note that using a reduced period results in more consistent linear trends in SSTs over the 61-year record (Fig. 1), which are significantly positive throughout the tropical Pacific Ocean.”
What the authors of the paper observed and explained, was that the pre-1950 data was not as reliable as the post-1950 data. And since the main interest is ‘warming similar’ to the global average surface temperature which has more significant warming since 1950 than before 1950, the earlier SST values are not that important.
-
Paul Pukite at 06:57 AM on 3 December 2023At a glance - Evidence for global warming
It's interesting to compare NINO34 almost-raw (annual cycle is still removed) and de-trended
This is raw from KNMI explorer site

This is de-trended

So there appears to be a ~0.5 degree trend removed over the time span. All my original comments stated were that the trend was difficult to discern because of the dominating ENSO variations and those are not understood very well. That's all I said, go back and check.
In terms of optimal control theory, properly removing the signal (a warming trend) from the noise (ENSO variations) is only possible if a model for the noise is known. If the noise is statistically random with no trend, it's practical to create e.g. a Kalman filter to optimally remove the noise. However, if the noise of ENSO carries long-period multidecadal fluctuations, such as is observed with the AMO on the Atlantic side or the decadal PDO in the north Pacific, then it becomes much more challenging to discriminate the noise from the signal. That's because climate scientists still have no validated model for ENSO, being unable to predict it more than a few years in advance.
The ~1/2 degree warming in the NINO34 time-series above is in all likelihood a real AGW effect but my original remark was only in pointing out that the comment by Nigel J: "All these show a similar warming trend" could be challenged. He was OK with my remark as he found the case of the Pacific cold tongue research, which is described by NINO12 (and even more diffficult to extract the trend) and that the map by MS doesn't show this at the granularity needed. So are the rest of you speaking for him?
Moderator Response:[DB] Please limit image widths to 450. Thanks!
-
nigelj at 05:09 AM on 3 December 2023At a glance - Evidence for global warming
OPOF & M Sweet. You guys sound correct in your technical analysis and correct that the equatorial part of the pacific ocean is warming (and I also thought the graphs posted by PP showed a slight warming after 1970). But the warming in a narrow band along the equator is at a significantly slower rate than the pacific ocean as a whole (roughly 0.2 compared to 0.6 in the maps in link I posted). The map posted by MS is a bit too large scale to pick up this level of detail and difference.
This basic pattern is important, and the explanation seems quite good. I think that is the main point.
-
michael sweet at 23:24 PM on 2 December 2023At a glance - Evidence for global warming
Paul Pukte @10,
When you present a graph and say "my eyecrometer detects no trend" with no statistical analysis you are wasting our time. Likewise when you say "I am pretty certain this is not detrended" you are wasting our time. If you are not absolutely certain the data is not detrended go find out for sure.
When I go to your data source I find the graph you have presented has this label:
"cutting out region defined by mask ersstv5 nino3 mask.nc, operating on NOAA ERSSTv5 (in situ only), SSTA normalized to 1981-2010, Nino3 index minus 20S-20N average SST, normalised by a factor" my emphasis
It appears to me that your graph shows the anomaly in the Nino3 area minus the trend in the tropical oceans. Since the illustration that I posted in post at 9 shows that the tropical ocean has a clear waring trend. You have ignored since it contradicts your claims. It appears to me that your graph shows that the ENSO anomally has not changed compared to the rest of the ocean, not that the temperature has not risen in the Nino 3 area as you claim.
I note the the older data in your graph must have large error bars. I also note that small areas of the globe have much more noise so it is hard to detect the warming signal, especially by eyecrometer.
-
One Planet Only Forever at 17:13 PM on 2 December 2023At a glance - Evidence for global warming
Paul Pukite,
I included some points in my comment @18 that directly (interestingly) relate to your comment @19.
-
One Planet Only Forever at 17:09 PM on 2 December 2023At a glance - Evidence for global warming
Paul Pukite,
The SkS Temperature Trend Calculator does a statistical analysis of the temperature data that 'includes ENSO nuisance'. The same can be done for the SST data.
And you still have not addressed the points I have made regarding your inaccuate and incorrect beginning. WUWT?
I will agree that improving the ability to forecast ENSO events is important and helpful work. But the points you have tried to make-up on this string are not helpful.
-
Paul Pukite at 16:23 PM on 2 December 2023At a glance - Evidence for global warming
There could be a warming trend buried in the NINO3 time-series but it's difficult to extract because of the large El Nino and La Nina excursions — note that they exceed 4C on the positive side and almost that much on the negative side. Remember that this region is the source of energy (or sink of energy) which can heat up (or cool down) the world for months at a time so it may be understandable that the AGW trend gets buried.

It's difficult to do statistical trend analysis on such a time-series without a model of the underlying "nuisance" signal. Since I have been doing mainly ENSO research, having published and presented at several AGU/EGU meetings on the topic, I tend to think of the AGW as the nuisance — tho, since it's so small it's not much a nuisance. On the other hand if you're iterested in the AGW trend here, the ENSO signal is a huge nuisance.
-
One Planet Only Forever at 14:01 PM on 2 December 2023At a glance - Evidence for global warming
nigelj @14,
Paul Pukite’s set of comments here starting with his comment @2 are the matter of concern. Though there is a difference between current developed models and actual observations, that difference is not related to, and does not explain or excuse, Paul’s resistance to learning about the reality of a warming trend throughout the equatorial Pacific.
Note that a warming trend since 1950 appears to also be in the graph of Nino12a that Paul Pukite selected to present @15. Prior to 1950 can justifiably be excluded from the evaluation because of the reasons given by the authors of the 2012 paper Paul misrepresented and still has not indicated he has learned about.
Note that the NOAA information I most recently shared in my latest response to Paul also does not evaluate the SST before 1950 (except for using pre-1950 values to determine the earlier centered 30-year base period values).
Also note that the global average surface temperature had a significant increase of temperature after 1950 compared to the rate of increased prior to 1950. Using the SkS Temperature Trend Calculator and GISTEMPv4:
- trend: 1880 to 1950 is 0.038+-0.021 C / decade (little warming)
- trend: 1950 to today is 0.152+-0.018 C / decade (lots of warming).
Also note that it is well understood that the land temperatures and polar regions have been warming much more rapidly than the equatorial SST. So the equatorial SST warming since 1950 will be significantly less than the 1 degree C global average since 1950 (much harder to see in a chart with monthly data value swings of up to 8 degrees C like the NINO12 image presented by Paul @15 - statistical evaluation is the proper way : not "I think I see what I think I see").
-
One Planet Only Forever at 13:41 PM on 2 December 2023At a glance - Evidence for global warming
Paul Pukite @13,
Your latest comment does not address the questions I raised regarding your initial comment and the ways you have commented regarding this point.
@2 You said “...Not the middle of the equatorial Pacific. The temperature variation there is also not well understood because El Nino & La Nina cycles dominate and these are difficult to predict more than a year in advance.”I am open to learning (even though I still struggle with right vs left hand). Years ago I learned that the difficulty in ‘predicting the ENSO’ does not affect the ability to evaluate trends in the equatorial Pacific SST. Due to the trend of SST in the Niño 3.4 region (the middle of the equatorial Pacific) NOAA had revised their methodology for the Ocean Nino Index (ONI) values to be relative to a regularly updated baseline.
The following is from the NOAA webpage (linked here) that presents the ONI values identifying the “Cold & Warm Episodes by Season”.
“DESCRIPTION: Warm (red) and cold (blue) periods based on a threshold of +/- 0.5oC for the Oceanic Niño Index (ONI) [3 month running mean of ERSST.v5 SST anomalies in the Niño 3.4 region (5oN-5oS, 120o-170oW)], based on .”centered 30-year base periods updated every 5 years.”\
And the linked NOAA webpage for “centered 30-year base periods updated every 5 years” shows the annual temperature curves for each of the 30-year base periods. In that presentation there is an undeniable warming trend since 1950.
What you will notice is that the NOAA ONI and the related base periods start in 1950. This ties directly to the paper you made the unrepresentative quote from mistakenly believing that it supported your incorrect ‘declared belief’ about the middle of the equatorial Pacific.
In closing I will say that a statistical evaluation of the data points is the proper way to determine a trend in the data. However, when I look at the NINO3 graph you have chosen to share I see a warming trend for the portion from 1950 to 2010. That would be consistent with the more valid evaluation of the data done by the authors of the paper you misrepresented in your comment @2.
-
Paul Pukite at 08:13 AM on 2 December 2023At a glance - Evidence for global warming
Makes sense. The NINO3 time-series above is closer to Peru and the cold tongue than the equatorial Pacific NINO34 and NINO34 indices. Another even closer to Peru is the NINO12 time-series, which also doesn't show much of a trend.
-
nigelj at 05:44 AM on 2 December 2023At a glance - Evidence for global warming
I don't think PP is a denialist. Have seen his comments at RC. We sometimes just get on edge and jump to the conclusion that anyone who says "flat trend" is a denialist because its a common denialist talking point.
We know the oceans as a whole have warmed considerably since the 1980s. But then you do have a few areas with cooling like the cold blob in the nothern atlantic.
I'm eyeballing Paul Pukete's graphs of the equatorial pacific and at best I can only see a very slight warming trend from around 1970 - 2022. I mean it does look flat or near flat, so I looked for an explanation and this is interesting. I have highlighted the main pargraphs only:. It seems to be consistent with what PP is saying.
Part of the Pacific Ocean Is Not Warming as Expected. Why? BY KEVIN KRAJICK |JUNE 24, 2019
State-of-the-art climate models predict that as a result of human-induced climate change, the surface of the Pacific Ocean should be warming — some parts more, some less, but all warming nonetheless. Indeed, most regions are acting as expected, with one key exception: what scientists call the equatorial cold tongue. This is a strip of relatively cool water stretching along the equator from Peru into the western Pacific, across quarter of the earth’s circumference. It is produced by equatorial trade winds that blow from east to west, piling up warm surface water in the west Pacific, and also pushing surface water away from the equator itself. This makes way for colder waters to well up from the depths, creating the cold tongue.
Climate models of global warming — computerized simulations of what various parts of the earth are expected to do in reaction to rising greenhouse gases — say that the equatorial cold tongue, along with other regions, should have started warming decades ago, and should still be warming now. But the cold tongue has remained stubbornly cold.
Why are the state-of-the-art climate models out of line with what we are seeing?Well, they’ve been out of line for decades. This is not a new problem. In this paper, we think we’ve finally found out the reason why. Through multiple model generations, climate models have simulated cold tongues that are too cold and which extend too far west. There is also spuriously warm water immediately to the south of the model cold tongues, instead of cool waters that extend all the way to the cold coastal upwelling regions west of Peru and Chile. These over-developed cold tongues in the models lead to equatorial environments that have too high relative humidity and too low wind speeds. These make the sea surface temperature very sensitive to rising greenhouse gases. Hence the model cold tongues warm a lot over the past decades. In the real world, the sensitivity is lower and, in fact, some of heat added by rising greenhouse gases is offset by the upwelling of cool water from below. Thus the real-world cold tongue warms less than the waters over the tropical west Pacific or off the equator to the north and south. This pattern of sea-surface temperature change then causes the trade winds to strengthen, which lifts the cold subsurface water upward, further cooling the cold tongue.
news.climate.columbia.edu/2019/06/24/pacific-ocean-cold-tongue/
-
Paul Pukite at 04:52 AM on 2 December 2023At a glance - Evidence for global warming
One Planet Only Forever
Here is the NINO3 SST time-series, which is taken from the equatorial Pacific, and note that it is difficult to discern a warming trend. That's just the way it is in the ocean, which acts like a large heat sink, with the colder water below the therrmocline occasionally approaching the surface leading to colder La Nina episodes.
,

I am pretty certain this is not detrended as it the detrended version is also here an it appears similar
https://climexp.knmi.nl/selectindex.cgi?id=someone@somewhere
-
One Planet Only Forever at 01:33 AM on 2 December 2023At a glance - Evidence for global warming
Paul Pukite @10,
Hilarious. You appear to still be spinning ways to evade learning, just like members of the WUWT crowd.
Until you seriously address the counter-points I have presented (essentially pointing out the easy to obtain better understanding of the 2012 report you unjustifiably cherry-picked a quote from in your comment @2) the evidence here indicates you are 'one of them'.
-
Eclectic at 18:09 PM on 1 December 2023At a glance - Evidence for global warming
Paul Pukite @10 :
No, no, no . . . no such disrespect for you, Paul Pukite.
On the Denialist video mentioned @6 above, the "Paul" mentioned was a certain Paul Burgess, the author of that guff [his channel label being "Climate Realism with Paul Burgess"]. Most readers here will see large red flags, when terms like Climate Realism . . . CAGW . . . Galileo . . . quotations from Feynman etc,etc . . . are placed prominently.
It was just an amusing co-incidence of first names. Sorry for the alarm. I should have resisted the temptation to omit the Burgess !
Paul Pukite, I have seen your name often in the comments columns of sober & respectable online climate threads. It seemed very unlikely that Burgess would be your alter ego.
Paul Burgess is a name I do not recall seeing at WUWT. Nor do I recall seeing any videos by him (nor any alluded to) . . . and I did not bother to see more than a few seconds of his video ~ since life is too short to spend watching video explications by climate deniers / Flat Earth exponents / anti-vaxxers / perpetual-motion machine inventors / and suchlike.
But comments columns from the Usual Denialist Suspects . . . can be skimmed very quickly, while keepiing an eye out for gems !
-
Paul Pukite at 16:31 PM on 1 December 2023At a glance - Evidence for global warming
As mentioned by Eclectic @6 sites like WUWT are a swirl of laughable efforts to evade learning about things that contradict 'preferred beliefs'.
Eclectic mentioned something about a "Paul" at WUWT, apparently thinking that's me. Why would he think that? Does he have evidence? I have been blogging since 2004 and have yet to write anything "in strident denial of AGW, Hockey Stick, etc" and certainly haven't been featured in a YouTube video. I guess my crime is being involved in research on El Ninos.
Frankly, I don't find AGW that interesting as it seems fairly well understood. More difficult is to predict an El Nino a few years in advance.
-
michael sweet at 10:43 AM on 1 December 2023At a glance - Evidence for global warming
Paul Pukite:
This map shows warming trends for the entire world for the years 2015-2019. It uses a baseline of 1951-1980. I note that most of the oceans have a positive anomaly. You are just not looking. source

-
One Planet Only Forever at 03:40 AM on 1 December 2023At a glance - Evidence for global warming
Paul Pukite @7,
One has to try very hard to evade evidence and understanding that contradicts a preferred unjustified belief. You appear to have chosen to not address the evidence and understanding presented in my comment @4 that shows that your initial claim @2 is non-sense.
As mentioned by Eclectic @6 sites like WUWT are a swirl of laughable efforts to evade learning about things that contradict 'preferred beliefs'. Do an internet search of "belief vs understanding". There is an important difference. The pursuit of learning to better understand things requires being open to revision of beliefs.
Pursuing a resistance to learning can be popular. Sites like WUWT and Dr. Roy Spencer's are proof of that.
Thanks for giving us all a laugh here without having to venture into the Non-Sense-Land of WUWT and Dr. Spencer's. Admittedly they would be funnier if the type of people they attract did not have any significant influence on leadership actions. But, tragically, popular non-sense can significantly compromise the actions of leaders who are reliant on getting some support from people who are tempted to believe non-sense.
-
Paul Pukite at 01:16 AM on 1 December 2023At a glance - Evidence for global warming
one has to look fairly hard for maritime areas that do not show a "similar warming trend"
As far as I can tell, when one searches for equatorial Pacific ocean SST time-series, you only get NINO34, NINO4, etc data. These show no or very little trend, being dominated by ENSO variations. As far as I can tell, they have not been detrended, but do have the annual seasonal temperature cycle removed.
Proxy records to demonstrate the hockey stick contain many samples from coral ring measurements. Yet, these also show very little trend which is not surprising as most coral is found in tropical or equatorial waters, where the SST also shows little trend. That's why most hockey stick discussion is on tree ring data.
-
Eclectic at 12:26 PM on 30 November 2023At a glance - Evidence for global warming
To add a touch of humor to this thread :-
While scanning through the well-fertilized field of WUWT blogsite, I found myself being directed to a new Youtube video of a day or two ago, where the author [Paul] is in strident denial of AGW, Hockey Stick, etc.
Such videos are typically not worth viewing (unless you are "in traction" in a hospital bed for the next 3 months, while your shattered bones heal). But a quick scan through the video's comments column may turn up a gem or so. And the gem was a two-liner :-
[quote] "Thanks, Paul.
You and Tony Heller are beacons of sanity in this crackpot World"
!
-
One Planet Only Forever at 06:57 AM on 30 November 2023At a glance - Evidence for global warming
Paul Pukite,
My apologies for transposing letters in your name.
I try to be careful. I have a history of crossing up 'Left and Right-hand'. So I am aware that I am likely to make mistakes like that.
-
One Planet Only Forever at 05:04 AM on 30 November 2023At a glance - Evidence for global warming
Paul Pikute @2,
I went to read the paper you quoted and linked to learn more about the point you made.
The first thing I learned, almost immediately, is that the paper is from 2012. I immediately wondered if a newer paper with more recent data would conclude similar results.
However, reading the full Introduction of the paper was all I needed to do to learn a lot. A more recent paper would not be required to clarify the issue you raised.
The quote you shared is near the beginning of the Introduction. I repeat the quote ... but include the statement immediately following it.
“SST trends in the equatorial Pacific Ocean are especially controversial due to the discrepancy in the sign of the trend in the central and eastern Pacific among various SST datasets (Vecchi et al. 2008; Karnauskas et al. 2009; Deser et al. 2010a). However, the disparity in trend largely arises from the coverage and quality of in situ observations in the centennial record, particularly during the early decades of the twentieth century (Deser et al. 2010a; Giese et al. 2010).”
Why did you stop reading at the end of the quote you shared? If you did read the full Introduction why did you only quote the bit that you did?
If you had read the entire Introduction you would have also encountered the following:
“The purpose of this paper is to understand the linear trends in association with the leading patterns of tropical Pacific SST variability and in key SST regions of the tropical Pacific during 1950–2010. Because of prior work indicating a positive trend in the El Niño Modoki, the significance of this pattern and the zonal gradient of equatorial Pacific SSTs is closely examined. Because of limited data coverage prior to the Second World War, we elected to not use the full SST datasets that begin in the nineteenth century. While centennial trends are not assessed here, we note that using a reduced period results in more consistent linear trends in SSTs over the 61-year record (Fig. 1), which are significantly positive throughout the tropical Pacific Ocean.” (bolding by me)
-
michael sweet at 03:01 AM on 30 November 2023John F. Clauser: the latest climate science-denying physicist
AB19:
In support of John Mason at 64, here is the carbon dioxide graph:

The graph is from the Royal Society CO2 concentrations from ice cores go back about 800,000 years. As you can see, the last 200 years are completely exceptional. The antarctic temperature has not yet responded as much as global temperatures above.
-
michael sweet at 02:44 AM on 30 November 2023John F. Clauser: the latest climate science-denying physicist
AB19:
Both the midieval warming period and the Roman period you mention were local warming events and not global events. The current warming is global. The Globe cooled from about 8,000 years ago until about 200 years ago, when the industrial period of burning a lot of fossil fuels started.

source There is an arrow that indicates 2016, since then the temperature has risen about 0.3 C. The temperature is currently about 1.3 C above the zero point. There is no significant rise to support your claims.
When you have the basic facts incorrect your conclusions are also incorrect. You appear to be sadly misinformed. I recommend that you try reading more scientific web sites and less denier information. SkS is a good place to start.
-
John Mason at 22:34 PM on 29 November 2023John F. Clauser: the latest climate science-denying physicist
Re #63: " I believe it's also true that in the last ice age the level of atmospheric CO2 was at least 10 times current levels - which according to IPCC thinking ought to have produced a blisteringly hot climate - yet there was an ice age. "
You believe incorrectly unless by "last ice age" you are referring to something hundreds of millions of years ago.
During the last glacial maximum of the Quaternary, ca. 23,000 years ago, CO2 was around 180 ppm.
-
AB19 at 21:32 PM on 29 November 2023John F. Clauser: the latest climate science-denying physicist
I quote from the article introduction:
"It’s a familiar story – the physicist who draws attention for declaring that climate scientists have got climate science all wrong. He (it’s always a ‘he’) was born before color television was invented, usually retired, perhaps having won a Nobel Prize, but with zero climate science research or expertise. William Happer."
I don't know if the writer of the article is a scientist or not but it starts with some rather unscientific viewpoints, namely by suggesting that male, retired physicists are not qualified to comment on climate matters. What does it matter what sex they are or how old they are? In relation to physicists, I don't know about the others in the list given, but William Happer would, I would have thought, certainly qualify to comment on the global warming debate given that if you have watched any of his presentations on this topic, you'll know that his field of research was the absorption of infra-red radiation by CO2 molecular stretches and bends - very apt in the climate debate I would have thought, given that it is precisely CO2 that is being posited as the culprit in current global warming trends. He also openly admits that he was once a climate alarmist until his work led him to believe he was wrong.
I am not a climate scientist- my background is chemistry- but there are certain apparent facts that appear to be ignored in the current debate, namely that we know the earth warmed before about 1000 years ago in the medieval warming period and again about 2000 years ago in the Roman period. These warmings cannot have been due to human activity given that there were no combustion engines or factories around and world population was vastly lower than today. I believe it's also true that in the last ice age the level of atmospheric CO2 was at least 10 times current levels - which according to IPCC thinking ought to have produced a blisteringly hot climate - yet there was an ice age. Whilst not denying that CO2 is x greenhouse gas, these facts do tend to cast doubt on just how potent a greenhouse gas CO2 really is. I believe Dr Roy Spencer, who is a meteorologist not a physicist and also not retired ( though he is male) has similar views to the listed physicists.Moderator Response:[PS] If there is going to be further discussion of past warm periods, please use the search function to find more suitable places for discussion. Eg for mediaval warm period, see https://skepticalscience.com/medieval-warm-period-intermediate.htm
Happer and Spencer seem to have stuck priors, and credibility only with those who dont know climate science but like their conclusions. See https://skepticalscience.com/happer-spencer-global-warming-continues.html for instance. Search function will find other discussion of Happer's misinformed claims and errors.
-
John Mason at 18:10 PM on 29 November 2023At a glance - Evidence for global warming
@#2: in fairness to nigelj, one has to look fairly hard for maritime areas that do not show a "similar warming trend". Granted, they are interesting because the obvious question is, "why", However they are also a tiny minority.
-
abostrom at 11:55 AM on 29 November 2023Disinformation campaigns are undermining democracy. Here’s how we can fight back
It was Thanksgiving of 1993 when I caught a ride with my brother, to join him, his wife and two cats for the traditional meal. Widespread use of the internet was in its infancy and we whiled away hours of the trip excitedly chattering about all the potentials this new medium might unlock. Looking back, I think we were a bit naive about just how experimental and unpredictable this all was, and I don't mean technologically. There have been undeniable benefits (this site is proof), but given how 'social media' and the near global resurgence of authoritarianism seemingly have paralleled one another, one can't help but wonder whether what good, in the big picture, has come out of that phenomenom.
Perhaps I see social media too darkly. It has been pointed out, that very likely even the likes of Mark Zuckerberg did not fully grok the impacts of what they were doing as they cashed in. Too bad for democracy.
-
Paul Pukite at 09:13 AM on 29 November 2023At a glance - Evidence for global warming
"All these show a similar warming trend."
Not the middle of the equatorial Pacific. The temperature variation there is also not well understood because El Nino & La Nina cycles dominate and these are difficult to predict more than a year in advance.
"SST trends in the equatorial Pacific Ocean are especially controversial due to the discrepancy in the sign of the trend in the central and eastern Pacific among various SST datasets (Vecchi et al. 2008; Karnauskas et al. 2009; Deser et al. 2010a)"
https://link.springer.com/article/10.1007/s00382-012-1331-2#Sec5
-
nigelj at 06:17 AM on 29 November 2023At a glance - Evidence for global warming
We have many ways of measuring global warming. Urban areas, rural areas,oceans, the middle, and upper atmosphere. Sea level rise is also an indication of warming. All these show a similar warming trend. How much more do people want to be convinced? There really isn't any part of the planetary system left to measure.
If we were reliant purely on land surface data in cities for example, I would be scepetical. One data set might be flawed. But the chances of so many multiple data sets all being flawed and in the same direction is effectively zero.
Sarah Palin seems like a typical example of a lay person who thinks she knows better than the climate experts. Of course its good to discuss things and question if the experts are right, but remember the experts know things you dont know and small details are important in science.
Another expample of someone out of their depth is John Clauser, a physicist with a nobel prize in quantum physics and an outspoken anthropogenic climate change sceptic despite the fact he has never published any research related to climate change or formally specialised in something like atmospheric physics. It hasn't stopped him telling everyone that climate science is all wrong. He has made many indisputably false statements sometimes by using very out of date information. So even scientists outside their area of expertise can fool themselves. Good commentary here:
www.realclimate.org/index.php/archives/2023/11/clauser-ology-cloudy-with-a-chance-of-meatballs/
-
One Planet Only Forever at 04:49 AM on 29 November 2023Disinformation campaigns are undermining democracy. Here’s how we can fight back
The 'fight back' against disinformation and misinformation is important.
However, the following linked Harvest Public Media (related to NPR) report indicates that even in 'very conservative' parts of the US the majority of people want actually correctly learn about climate change. The problem is the very small percentage of 'Team Coonservative' who are willing to be 'encouraged by misinformation and disinformation' from Team Cosnservative actors to threaten or actually attack people who try to increase awareness and improve understanding.
Midwest weather experts want to talk about climate change, but they face pushback and threats
KCUR | By Elizabeth Rembert
Published November 27, 2023 at 9:43 AM CSTThe story includes the following quote:
While resistant voices can be loud, 90% of Americans are still open to learning about climate change, according to Ed Maibach with the Center for Climate Change Communication at George Mason University.
Maibach said surveys suggest people appreciate hearing about climate change from trusted sources like meteorologists and climatologists, even in conservative communities.
“The whole notion of ‘red and blue states’ actually creates a disservice when it comes to thinking about how to educate the public about climate change,” Maibach said. “It signals that this is difficult, if not impossible, to do in red states. But that's just not true.”
That reality explains the actions by Team Conservative to unjustifiably encourage fear and anger rather than help increase awareness and improve understanding. Increased awareness and improved understanding is significantly biased against current day 'Team Conservative' interests.
-
One Planet Only Forever at 04:21 AM on 29 November 2023Disinformation campaigns are undermining democracy. Here’s how we can fight back
nigelj @10,
It is undeniable that 'the current internet system' needs more effective ethical governing. More effective governing would help increase awareness and improve understanding regarding unjustified unsustainable beliefs and related harmful unjust actions (like delaying the ending of unnecessary harmful actions like the impacts of fossil fuel use, other anti-science actions and anti-diversity actions - the many fronts of improved understanding and required changes and corrections that the 'selfish status seekers and intolerant of diversity' fight on these days).
Faith in 'legacy media industry codes of practice on accuracy and integrity' is not generally justified. It may still apply to some degree in some Nations. But ethical governing of legacy information media has eroded significantly in many nations. And, in some nations, information media being governed to 'increase awareness and improve understanding of what is harmful and how people can be less harmful and more helpful to others' was more of an impression than a reality (as an example refer to the presentation of the Propaganda Model regarding the systemic manipulation of public opinion in the book by Edward S. Herman with Noam Chomsky: Manufacturing Consent, New York: Pantheon Books, 1988 updated 2002 - Movie of the same name made in 1992).
The current day global coordinated and collaborating group of political game players who are 'opposed to learning to be less harmful and more helpful' needs to be understood to be the problem with the internet, not 'the freedom of action on the internet'. And that group is the root of many, likely the vast majority, of the understandably harmful and unsustainable developments that are verified by evidence Today, especially the efforts to preserve unjustified perceptions of status (superiority relative to Others and dislike of Others) and the related 'inaccurate/incorrect history stories' that have developed. And that group of people can be understood to have been the reason that the past few decades have made the current over-development of harmful actions worse than it had to be.
It is important to understand the history of how things got to be as bad as they currently are. Without properly identifying and effectively correcting the real problem all that is likely to develop are unjustified perceptions that things will get better.
-
nigelj at 11:17 AM on 28 November 2023Disinformation campaigns are undermining democracy. Here’s how we can fight back
OPOF @8
Yes talk radio and television and political rallies have all spread misinformation at times. But at least they are mostly traditional media and are governed by industry codes of practice on accuracy and integrity (apart form a few rogue channels like Fox perhaps), but anyone can set up an 'alternative' news platform on the internet just so easily, and not subject to any codes of practice, and this is whats lead to such a toxic situation over about the last decade.
-
nigelj at 10:59 AM on 28 November 2023Disinformation campaigns are undermining democracy. Here’s how we can fight back
Regarding David Acct's comments where he says some of the authorities did exaggerate the effectiveness of the masks. I agree that was the wrong thing to do, but I'm prepared to be a bit forgiving as they were simply trying to encourage use of maks to save lives, and remember we were in a quickly evolving emergency situation with some uncertainty about how effective masks were. We are now looking back with the benefit of hindsight. I agree with Bob it was not misinformation.
David seem to be narrowly focused around whether face masks stop people catching covid. Obviously masks won't do much to stop you getting infected because they dont fit tightly enough and it only takes a very small number of cells to cause an infection. The studies seem to show that areas with high mask use had only slightly lower rates of infection. About what you would expect.
But masks do greatly reduce the viral load on the lungs and that initial viral load is closely related to severerity of symptoms. Its no accident that places with high mask use had a much lower mortality rate (25% in one study). So on balance it appears to me mask wearing does have value.
David does a rant about the virtues of free speech and the evils of censorship. I lean towards free speech, but I would boldly say that some censorship is required in some circumstances. It's common in times of war,and in New Zealand we have sensible laws against defamation, inciting violence and racist speech (which effectively incites violence) and as a result many websites will not publish public comments that infringe those laws. That is censorship, so lets call it what it is, but only a fool would suggest such laws and censorship is wrong.
But how much further should we go? Because every restriction on free speech does risk shutting down discussion and debate, which is a very unhealthy outcome. I believe restrictions and "censorship" should be small in number and only be if there is a risk of comments inciting criminal law breaking or leading to serious physical harm or in other exceptional circumstances.
For example during covid our media mostly allowed people to post comments on their websites with robust views or even crazy views on covid, but they generally wouldn't permit views undermining the use of vaccines, such as views making wild claims that vaccines dont work or that they kill people.
This seemed like a reasonable restriction because it was narrowly focused and related to potential loss of life. The country was actively trying to get vaccination rates as high as possible and we got to 95% double vaccinated. America land of free speech only got to about 65%. A lot of people died but they preserved their precious right to spread lies about vaccines. I find this approach rather bewildering and lacking in commonsense.
On the other hand, attempts to censor so called 'hateful' views and criticism of religion mostly seem to go too far and run into awful difficulties of defining what hate speech is.
Yes all of this means free speech is not a simple black and white thing and difficult judgement calls have to be made. I think we are just stuck with this and have to do the best we can.
-
One Planet Only Forever at 08:28 AM on 28 November 2023Disinformation campaigns are undermining democracy. Here’s how we can fight back
nigelj @1,
I agree with your observations and concerns. I would add that populist misleading political groups are not only being harmfully successful through ‘the internet’. Today’s misleading messengers are very active in:
- Talk Radio. Talk radio is a big influence on older and non-urban voters. Even Alberta’s current populist winner of leadership of the current governing Party was a talk radio misleading populist in Alberta for the past decade. And she still does regular radio talk programs (critically evaluate the results of an internet search like “right-wing biased talk radio”).
- Local TV. Sinclair Broadcast Group in the US is an example of a branch of populist misleading marketers. They buy local TV stations and try to dictate what the local news anchors cover and how they cover it (internet search “Sinclair media misleading news reports”).
- TV News channels. Fox News is an obvious villain.
- Political Rallies. An opportunity to spout unjustified claims to an eager audience who will not question what they hear ... because it comes from a person they consider to be ‘their type of authority figure’.
Ibram X. Kendi provides what is probably a better understanding of what is happening. (I mention it in my comment @7). The root problem is people who obtain power or status by getting away with harmful actions, including misleading marketing efforts. They will do whatever they can get away with to maintain and increase their power and perceptions of status relative to Others.
Note that the printing press initially increased awareness and improved understanding. In its early use the printing press corrected some serious undeserved perceptions of status. But eventually it was perverted by people who figured out ways to benefit from misinforming others through that mechanism.
-
One Planet Only Forever at 07:27 AM on 28 November 2023Disinformation campaigns are undermining democracy. Here’s how we can fight back
David-acct @4 (Note: I prepared this before seeing Bob Loblaw’s recent post)
I agree with BaerbelW @5. And I agree with you, sort of (see my ending PS).
Censorship, like ‘efforts to ban school books because they would increase awareness and improve understanding of how to be less harmful and more helpful to Others’, is indeed unacceptable. It is especially unacceptable to ‘censor education’ to only teach ‘reading-writing-math’ and ‘incorrect but preferred versions of history’.
However, a rational justification can be made for improving public education, a requirement for democracy to be sustainable, by limiting the success of authoritarian attempts to popularize inaccurate information. Those limiting actions are justified even if fans of the misunderstandings, people who idolize undeserving authority figures, claim that such corrective actions are ‘censorship’ or ‘evil re-education’.
An example in schools would be moving texts that incorrectly portray the history of what has occurred into a ‘special section’ where the inaccuracies are explained in detail for anyone interested in learning about that (regardless of the preferred beliefs of ‘winners of elections’).
In addition, being addicted to the pursuit and promotion of harmful misunderstanding is understandable, especially when the addiction is to unjustified perceptions of status relative to Others. However, an addiction to the pursuit of increased awareness and improved understanding of what is harmful and required corrections of unjustified developments and perceptions of success and status is also understandable.
Something like Addiction (or censorship) is not the problem. The problem is opposition to, rather than support for, ‘learning to be less harmful’. The same applies to political positions. Positions on the Left-Right spectrum are not ‘the problem’. The problem is ‘arguing and fighting against the pursuit of increased awareness and improved understanding of what is harmful and the diversity of justified corrective actions’. The corrective actions include actions that would limit the success of misinformation and disinformation efforts.
Misleading claims about ‘censorship’ are understandably expected from easily impressed victims or wilful perpetrators of misleading disinformation campaigns in the ‘War on increased awareness and improved understanding of undeserved perceptions of superiority and status’.
Ibram X. Kendi, in his many well researched books, provides a very robust understanding about the continued ‘progress of racist actions to defend unjustified perceptions of superiority relative to Others’. The reality that climate science also challenges unjustified perceptions of superiority makes it another front in the war efforts of people opposed to learning to be less harmful and more helpful to Others.
There are many valid justifications for restrictions on freedom. Helpful, justified, educational actions, including restrictions, are not censorship. Limiting the ability to spread harmful misunderstandings is not censorship. Arguing for the unrestricted sharing of misinformation would be like arguing for no efforts to limit the popularity of any of the many misleading harmful ‘social media popular challenges’ (share a video of biting a laundry-pod).
Limiting and correcting the popularity of harmful misunderstandings, especially with actions like educational inoculation, is not censorship. It would be more accurate to call such actions ‘Helpful Public Education’.
PS. Regarding the spread of a disease like COVID-19, I would agree that limiting-restricting contact between people is more effective than ‘mask wearing’ (and the type of mask also matters).
-
Bob Loblaw at 05:26 AM on 28 November 2023Disinformation campaigns are undermining democracy. Here’s how we can fight back
I see that David-acct has returned to inject another (likely one-off) comment on a thread, in an attempt to discredit the science. This time, he is yelling "censorship", in spite of the fact that the blog post does not advocate for the "suppression" he claims is a "far greater threat to democracy".
The blog post does refer to EU efforts "to make democracies more resilient against misinformation and disinformation", and about efforts "to boost the public’s resistance to misinformation". The paper on which the blog post is based gives more details: mentioning EU Codes of Practice and legislation attempting to "curtail misinformation and hate speech online". It also mentions the use of moderation policies "to remove online misinformation and hate speech under certain circumstances". In other words, "free speech" has limits.
In David-acct's world, it seems that helping people recognize and resist misinformation is "censorship". It would seem that David-acct's desired world is one where nobody is allowed to speak against misinformation. To me, there seems to be a pattern in many of these discussions - the "advocates' screaming about free speech and censorship seem to only approve of "free speech" by people they agree with. They appear to want "my free speech, unopposed". "Free speech" is not limited when people speak against you, and "free speech" does not mean that every online discussion group must provide you with a bull-horn. When someone violates a code of conduct on a commercially-run discussion group, and is barred from further participation, it is not "censorship". They are always free to set up their own web site and discussion network.
[Disclaimer: Skeptical Science has its own code of conduct for participants, known as the Comments Policy.]
David-acct then wanders into a Covid discussion, and finishes with an unsubstantiated claim that "the health authorities pushed as much or more covid disinformation than the denialists." He provides a link to a paper that he claims is "a good article on the effectiveness of masking". If we actually read the paper, what we find is an article that includes things like the following, where they discuss possible bias in their study:
The participants in the study were not randomly assigned to wear or not wear face masks, and they were not provided with or encouraged to use face masks. During the study period, official guidelines for face mask use changed, with mandatory use in certain situations. This may have affected the participants' use of face masks, with some choosing to wear them based on their own assessment of risk and effectiveness.
Additionally, there may be other factors that could confound the relationship between face mask use and study outcomes, such as participants in high-risk professions or with risk factors for severe COVID-19. Both groups may be more or less prone to wear face masks, while also observing different social distancing practices than the average population. We also cannot rule reverse causality, in which those testing positive for COVID-19 were more prone to wear masks afterwards in order to protect others. Finally, there could be an association between the inclination to test and the propensity to wear a face mask.
They conclude that section with the following statement:
However, it is important to interpret the results with caution and not infer that our estimates represent the true causal relationship between face mask use and infection risk.
So, the "good article" David-acct wants us to read is hardly the definitive source that David-acct is pretending it is. What David-acct has done is cherry-pick one study, and present it as far more conclusive than it is. If he had read even just the abstract, it finished with a general cautionary note (applicable to all studies):
We believe the observed increased incidence of infection associated with wearing a face mask is likely due to unobservable and hence nonadjustable differences between those wearing and not wearing a mask. Observational studies reporting on the relationship between face mask use and risk of respiratory infections should be interpreted cautiously, and more randomized trials are needed.
Also note that the paper David-acct refers to is a pre-print of an accepted paper, published online on November 13, 2023. Can anyone think of a possible reason why a study published in late 2023 was not used to guide policy decisions in early 2020? Does David-acct think that the 2020 policy decisions should have been "let's just wait, and do nothing, and see what happens, until we get moire data a few years from now"?
When Covid hit, there were a lot of unknowns about it. Policy decisions were needed, and may have been made in times of insufficient information. That is not the same thing as misinformation.
Sadly, this sort of comment has been typical of what David-acct tends to post here.
-
BaerbelW at 15:35 PM on 27 November 2023Disinformation campaigns are undermining democracy. Here’s how we can fight back
David-acct @4
Inoculation against mis- and disinformation doesn't involve censorship but making people aware of the techniques involved with spreading it. The only people who could have anything against that are the spreaders of disinformation, everybody else should be happy about those efforts in order to no longer fall for it.
-
David-acct at 11:44 AM on 27 November 2023Disinformation campaigns are undermining democracy. Here’s how we can fight back
he calls to suppress "disinformation" are effectively calls for censorship. In the long term, Censorship is far greater threat to democracy and the freedom of expression and scientific thought than the spreading of disinformation. Even if its called stopping disinformation, the reality is it a call for censorship.
I agree that there was a lot of disinformation regarding covid coming from the denialists such as vaccine safety, ivermectin, Hcx. Those claims persisted in spite of good research demonstrating that those claims were crap. However, the amount of disinformation coming from the political leaders and the CDC using low quality studies overhyping the effectiveness of the lockdowns, overhyping the effectiveness of masking and overhyping the effectiveness of the vaccines was extensive. As of the end of 2022, the CDC still had listed 45+ studies showing the "positive effectiveness" of masking, yet at least eight of those studies have serious shortcomings. For example, the Kansas mask mandated counties vs non mask mandated counties for example, the study period was intentionally cut short because the infection rate was higher in the mask mandated counties post the end of the study period.
here is a good article on the effectiveness of masking
in summary, the health authorities pushed as much or more covid disinformation than the denialists. While the push for stopping disinformation is reality is a push for censorship in which everyone loses
-
BaerbelW at 20:19 PM on 26 November 2023Greenhouse effect has been falsified
Please note: the basic version of this rebuttal has been updated on November 26, 2023 and now includes an "at a glance“ section at the top. To learn more about these updates and how you can help with evaluating their effectiveness, please check out the accompanying blog post @ https://sks.to/at-a-glance
-
BaerbelW at 17:47 PM on 26 November 2023Disinformation campaigns are undermining democracy. Here’s how we can fight back
nigelj @1
Yes, we are in catch-up mode, but there are examples which could be used as templates of how to include media literacy and crtical thinking in school curricula. Here is one from Finland:
Finland’s ‘visionary’ fight against disinformation teaches citizens to question what they see online
-
Nick Palmer at 12:23 PM on 26 November 2023Disinformation campaigns are undermining democracy. Here’s how we can fight back
What NigelJ said is very valid. My own perspective on such matters as percption of climate science is that probably most 'sides' - from doomist through alarmist to 'IPCC' accepting to 'sceptic' to denier - now currently distort the science and the varied consequences of assorted policies to suit their favoured take - often very strongly influenced by their personal politics. All sides use the very same techniques of cherry picking, quote mining, over-promoted 'experts', out-dated articles etc to make their cases. The actual peer reviewed science tends to get lost in the noise


