


 Arguments


Recent Comments
Prev 7 8 9 10 11 12 13 14 15 16 17 18 19 20 21 22 Next
Comments 701 to 750:
-
MA Rodger at 22:07 PM on 18 October 2023From the eMail Bag: Carbon Isotopes, Part 2: The Delta Notation
I'm reluctant to engage with a commenter that peppers a comment thread at a rate of one every couple of hours for almost two full days without establishing some form of understanding as to their purpose. But here goes...
Rabelt @46,
The OP does not claim to show that "emission from FF are responsible" for changing levels of atmospheric CO2. It is providing an explanation of "how measurements of changing isotopic ratios are described" and this in regard to the atmospheric 13C:12C ratio.
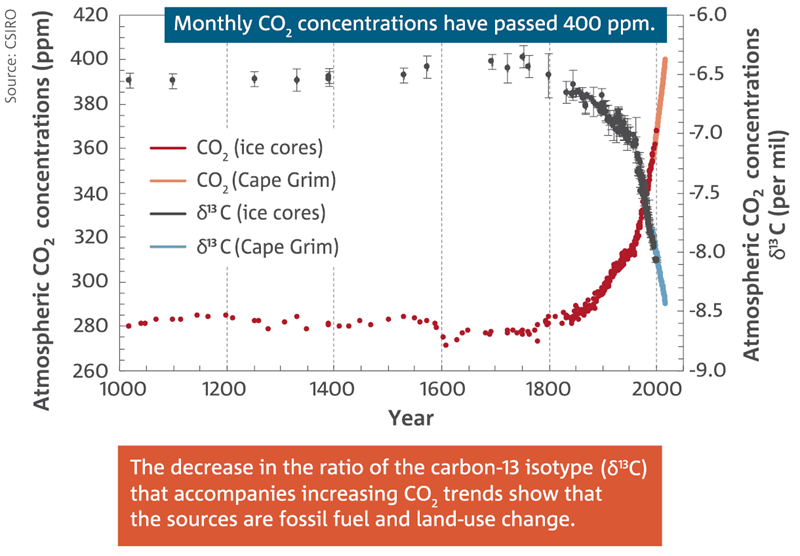
This ratio is shown in the OP fig3 waggling over a whole millennium in a very similar way to the level of atmospheric CO2. CO2 levels go up/down and the 13C:12C ratio goes down/up. Such a remarkable correlation tells us (although this is beyond the message of the OP) that the source (and sink) responsible for the changing CO2 levels has a 13C:12C ratio far lower than the atmosphere. Thus that the oceans cannot be the source/sink of that extra carbon waggling the atmospheric CO2 levels.
The source of this rogue CO2 messing up the atmosphere is thus plants, either by their direct destruction or indirectly via fossil fuels which retain the low 13C:12C ratio.
(The middle section of your comment @46 mentions "this change" but does not make entirely plain whether you refer to the "changes in discourse" or the "changes in Delta C13". So, if it is in any way relevant, it is not clear which you don't accept.)
Your comment make two final assertions which I find a little odd. You suggest annual and cumulative CO2 emissions 1750-1900 do not explain the changing atmospheric CO2 levels, the latter being "too small". Further you suggest a mismatch in the AtmosCO2:Delta C13 ratio "the 1950s-2010s periods."
The Global Carbon Project is always a good go-to source for annual carbon emissions. Although their historic LUC data only runs back to 1850, it is plain from their various source-sink numbers that the Atmospheric Fraction does not show emissions that are "too small" prior to 1850. You may have sight of other numbers which show it different and if so you do need to explain such 'other numbers' properly. (I note @34 you put the CO2 emissions for 1850 = 0.2Gt(CO2). This is presumably ignoring the LUC emissions which would increase the full 1850 emissions to 2.6Gt(CO2) using the Global Carbon Project numbers.)
It is also not clear what you are considering with this 1950s-2010s mismatch which you perceive between accelerating CO2 levels and steadily decreasing Delta C13 levels. If it is the OP's Fig 3 (& I don't see a problem there), perhaps a sight of the original may help as it shows the data points without the assumed solid δ13C trace.
-
Rabelt at 16:48 PM on 18 October 2023From the eMail Bag: Carbon Isotopes, Part 2: The Delta Notation
Rob Honeycutt,
This post claims emission from FF are responsible yet decides to use a completely different measurement, that changes the discourse from emissions to co2 concentrations, which as the other kid mentioned can not be the cause of changes in Delta C13; even accepting this change, which I dont, the problem still persist, 1750-1900 yearly and cumulative emissions are unable to explain the changes in co2 concentrations, they are too small, and the co2 concentrations show an acceleration during the 1950s-2010s periods that dont match with the steady decrease in Delta C13.
Moderator Response:[BL] This simply repeats previous assertions without evidence. This violates the portion of the Comments Policy that states:
Comments should avoid excessive repetition. Discussions which circle back on themselves and involve endless repetition of points already discussed do not help clarify relevant points. They are merely tiresome to participants and a barrier to readers. If moderators believe you are being excessively repetitive, they will advise you as such, and any further repetition will be treated as being off topic.
-
Rabelt at 16:42 PM on 18 October 2023From the eMail Bag: Carbon Isotopes, Part 2: The Delta Notation
Bob Loblaw,
I have no interest in losing time with people like you so I will imitate your infantile behaviour and just scream IPCC report, good luck with finding anything in those 2k pages reports
Moderator Response:[BL} Alas, you have forced me to disconnect from the discussion, and switch to moderator role.
You raised the issue of the IPCC and "the main narrative" in comment 22, and clearly it was nothing more than bluster.. You obviously have nothing constructive to say. Please read the Comments Policy. This post is a clear violation of t he following portion of that policy:
No profanity or inflammatory tone. Again, constructive discussion is difficult when overheated rhetoric or profanity is flying around.
Unless your behaviour changes to a more constructive discussion, expect to see portions of comments - or entire comments - deleted according to the Comments Policy.
-
Rob Honeycutt at 11:46 AM on 18 October 2023From the eMail Bag: Carbon Isotopes, Part 2: The Delta Notation
Rabelt... Assuming your "main narrative" is "[d]elta C13 starts decreasing around 1750 and continues to decrease ever since, the main narrative blames it on FF"... Your narrative is a basic misinterpretation of the science.
The C13 narrative (if you want to call it that) is merely the physics behind carbon isotopes for natural sources vs through burning hydrocarbons. That it. If you're saying this area of physics is wrong, you need to explain why.
The accepted understanding of this physics merely creates a prediction that can be tested. If the increasing concentrations of CO2 are primarily due to the buring of FF's, then we should see a corresponding relationship with C13. And that's all this is. It's just one piece of evidence that contributes to the scientific understanding that our uses of FF's is the source of increasing CO2 in the atmosphere.
-
Rob Honeycutt at 11:35 AM on 18 October 2023From the eMail Bag: Carbon Isotopes, Part 2: The Delta Notation
Rabelt @31... "I am talking about emissions not co2 concentrations."
Well, therein may lay your problem since the graph is concentrations.
-
Davz at 08:17 AM on 18 October 2023With whales in trouble, conservationists, fishers, and others team up to protect them
[Contents snipped]
This report is yet another example of climate alarmism and is nothing more than choosing to ignore the facts to fabricate yet another over blown story. The facts are that the algal blooms have affected all coastal U.S. states. They are most commonly caused by dinoflagellates or diatoms but can also be caused by cyanobacteria. Harmful blooms form where there are high levels of nutrients such as nitrogen and phosphmates, otherwise known as fertilisers used by farmers which run off the land into rivers, lakes and seas. The blooms are not just at surface level but also much deeper and will be harmful to ecosystems in the sea, hence the lack of krill for the whales, nothing to do with climate at all. It is yet another man made problem but not one that can be attributed to climate change.
Dont climate alarmists get that the more they make up stories where they ignore the real facts that more and more people are turning away from climate change and see it as a hoax. This is doing a great disservice as I want to see much more care being taken of our planet but these idiotic stories are back firing.
Moderator Response:[BL] Contents snipped.
I told you on this thread, under this comment, that you would not be allowed to post any more drive-by comments on new threads until you go back to that thread and respond. To repeat the instructions posted there:
If you wish to continue posting here, your habit of drive-by statements with little supporting evidence and no responses to criticism will not be allowed. Unless you return to this thread and do at least one of the following, any future posts will be subject to deletion with a pointer back to unfinished business here.
- Admit that your above statement is wrong.
- Provide supporting evidence of your statement, in the form of
- a clear definition of the area you refer to as "the UK",
- a clear indication of the period of time you consider to be "summer",
- a clear indication of the period of time your claim of a "record" covers,
- and a link to the source of data that you have used to draw your conclusion.
There are several responses to your comment on that previous thread. Please read them, and follow my instructions on how you are expected to respond.
-
Bob Loblaw at 07:21 AM on 18 October 2023From the eMail Bag: Carbon Isotopes, Part 2: The Delta Notation
Rabelt @ 40., 41.
All I see is your narrative. It does not resemble any scientific narrative. In comment 22, when you introduced "main narrative", you said:
...so I will continue using the main narrative (IPCC, NASA, CSIRO, etc) as the argument I am debating
Since you want to use the IPCC as a source, please show the sections of the IPCC reports that illustrate this "main narrative".
-
Rabelt at 06:39 AM on 18 October 2023From the eMail Bag: Carbon Isotopes, Part 2: The Delta Notation
Bob Loblaw,
Now show me where does the IPCC address those changes in the trends, or where in this great library of knowledge there is an explanation fo them.
-
Rabelt at 06:37 AM on 18 October 2023From the eMail Bag: Carbon Isotopes, Part 2: The Delta Notation
Bob Loblaw,
Already said what the main narrative had to say about C13, comment 34.
If you want the entire narrative, you have the reports of the IPCC.
-
Bob Loblaw at 06:32 AM on 18 October 2023From the eMail Bag: Carbon Isotopes, Part 2: The Delta Notation
Rabelt:
I'm waiting for your explanation of what you think "the main narrative" is...
-
Rabelt at 06:19 AM on 18 October 2023From the eMail Bag: Carbon Isotopes, Part 2: The Delta Notation
Bob Loblaw,
There has been not a single argument coming from you except the massively broad term "Carbon Cycle" and mentioning that you read followed as caused and supposedly it was my fault
-
Rabelt at 06:16 AM on 18 October 2023From the eMail Bag: Carbon Isotopes, Part 2: The Delta Notation
Bob Loblaw,
Start using arguments instead of relaying on big words you will reach futher, until then please behave like an adult
-
BaerbelW at 06:13 AM on 18 October 2023The Debunking Handbook 2020: Downloads and Translations
On October 16, the Polish translation of the Debunking Handbook was published, thanks to the efforts of the Nauka o climacie team, our partner website in Poland!
-
Bob Loblaw at 06:10 AM on 18 October 2023From the eMail Bag: Carbon Isotopes, Part 2: The Delta Notation
Rabelt @ 34:
Once again, you have nothing more than your eycrometer of patterns. You continue to ignore any sort of analysis that actually looks at the physics of the carbon cycle.
-
Bob Loblaw at 06:07 AM on 18 October 2023From the eMail Bag: Carbon Isotopes, Part 2: The Delta Notation
Rabelt:
Where is your explanation of exactly what "the main narrative" is?
Until you actually provide a coherent argument, there is no counter-argument to present.
-
Rabelt at 06:07 AM on 18 October 2023From the eMail Bag: Carbon Isotopes, Part 2: The Delta Notation
Bob Loblaw,
Let me explain your own field of expertise: Delta C13 starts decreasing around 1750 and continues to decrease ever since, the main narrative blames it on FF.
I see that the human emissions are too low for the mayority of this 270 years period, as we can see in the cumulative and yearly emissions.
I also see that even though the emissions multiply by tens and hundreds of times the speed of Delta C13 decreasing doesnt show any meaningful acceleration.
You use the wildcard "Carbon Cycle", as if that explains something; supposedly this wildcard is able to produce massive amount of co2 with a "deficit" in C13 to compensate the 1750-1850 yearly emissions, as the emission from this years are 0.048 GT of CO2 per year on average with a max of 0.2 GT in 1850, while also making the decline of Delta C13 steady from 1750-1950, even though the yearly emissions have multiplied from 0.01 GT of CO2 per year to 6 GT of CO2 per year.
This also happens during the 1960-2015 period in which the decrease of Delta C13 is quite steady even while the yearly emissions change from 9 GT of CO2 per year to 35 GT of CO2 per year.
-
Rabelt at 05:45 AM on 18 October 2023From the eMail Bag: Carbon Isotopes, Part 2: The Delta Notation
Bob Loblaw,
So you dont have an argument so you evade the topic, great.
Again no argument so you avoid responding to you putting words in my mouth and not responding to the strawmaning mentioning the "Carbon cycle" as if it was so kind of deity, I am sure you are of much help in the debate. If you are gonna accuse me of not understanding the effects of the Carbon Cycle in Delta C13 I would like to see a quote or a set of specific pages, not a extremely vague statement that mentions the entirety of the concept "Carbon Cycle".
So follow to you means caused, got it, it is my fault for expecting a minimum of comprehension; still I already said that there had to be a natural process that changed co2 concentrations and Delta C13, not sure why you continue to not read it.
Didnt adress any point just wanted to score another "debate bro" point using that joke called FLICC, debate the argument not your ego, please, and thank you. We even have a name for people like you, imagine how unoriginal your tactics of debate are.
"I am talking about emissions not co2 concentrations" It is not directed at you, but following (not causing) another line of debate with another person, but using your own fantasies now I am gonna start accusing the author of this post of believing that co2 concentrations causes changes in Delta C13, because mister Bob teached me how I am supposed to read others people words.
-
Bob Loblaw at 04:33 AM on 18 October 2023From the eMail Bag: Carbon Isotopes, Part 2: The Delta Notation
Rabelt @ 28: "quote which part I said anything dismissive about the carbon cycle."
The fact that you say virtually nothing coherent at all about it - when it is essential to understanding the graph/data you criticize - is all the evidence that is needed.
@ 29: "I love how the guy putting words in my mouth is acussing me of strawmaning his arguments,"
I am not accusing you of strawmanning my arguments - you have strawmanned "the main narrative" (in the context of what climate science - e.g., the IPCC - has said). If you want to provide a counter-argument, you need to give a thorough explanation of "the main narrative" (including the carbon cycle). Until you provide actual evidence that you have at least a basic level of understanding the carbon cycle (not just an assertion), then you're just blowing smoke.
Also @ 29: "Quote my comments and explain why they follow your supposed "logical consequences"
I did quote you, in my comment 19.
You finish with "I said Delta changes previous to human emissions following co2 concentration not FF emissions as there were none, and the ones that existed were accountable for insignificant amounts of co2." The way you have worded this suggests that you think that either CO2 concentration changes cause C13 changes ("delta changes ... following CO2 concentration"), or that C13 changes cause CO2 concentration changes ("delta ... accountable for ... CO2").
You have not responded directly to that, to provide any sort of clarification or indicate what you really meant. Yet you come back with "Again, never said co2 concentrations cause changes in Delta C13..." From this view, it looks as if you are just dodging the question.
And now you are stating "Differences in the carbon cycle are expected, yet only are accepted if they dont contradict the main narrative,"
Congratulations. You have now scored a third point on FLICC - the 5 techniques of science denial. - Conspiracy theories.
Since you clearly are unable to actual specify what "the main narrative" is, your speculation about what contradicts it is not worth the electrons used to transmit it.
And finally, @ 30 "I am talking about emissions not co2 concentrations"
Yet the graph that you began this whole flood of nonsense over is a graph that shows two things as a function of time: CO2 concentrations, and C13 isotope ratios. There is no coherence or consistency to what you say. Buy a clue please: CO2 concentrations, CO2 emissions, CO2 uptake - all are part of the carbon cycle that you keep dismissing. Oh,, sorry - not "dismissing" but just "ignoring".
-
wilddouglascounty at 00:59 AM on 18 October 2023With whales in trouble, conservationists, fishers, and others team up to protect them
Thank you for this example of cooperation and collective effort. More spotlights should be directed to these types of examples showing the power of working together: it's really what makes the world go around.
Too bad so much money making is based on riling people up into opposing camps! We've kinda blown the positive potential of the internet by building our algorithms on the fact that fight or flight is a more reliable attention getting device than examples of community building and cooperation.
-
Rabelt at 00:08 AM on 18 October 2023From the eMail Bag: Carbon Isotopes, Part 2: The Delta Notation
Rob Honeycutt,
I am talking about emissions not co2 concentrations.
-
Rob Honeycutt at 00:00 AM on 18 October 2023From the eMail Bag: Carbon Isotopes, Part 2: The Delta Notation
Rabelt... "...yet the annual and cumulative emissions are too small to create any perceptible change..."
By what method are you making this determination? When I look at the graph I see a clear and proportional correlation between the two.
-
Rabelt at 23:57 PM on 17 October 2023From the eMail Bag: Carbon Isotopes, Part 2: The Delta Notation
Bob Loblaw,
I love how the guy putting words in my mouth is acussing me of strawmaning his arguments, 10/10.
Quote my comments and explain why they follow your supposed "logical consequences", just saying it again, as you dont show the ability to read the comments I am posting.
"You see a correlation over the period 1750-1860, and then expect to see the exact same response at later times" During this entire period is a stable trend downwards, yet emissions during this period are incapable of generating such a trend. This is only one of the multiple periods I talked.
Again, never said co2 concentrations cause changes in Delta C13, I even said that there had to be other natural mechanism capable of producing this effect. What a great ability to read.
Differences in the carbon cycle are expected, yet only are accepted if they dont contradict the main narrative, unless you wanna say that the decrease during the beginning of the industrial revolution was natural, which I completely agree.
Again another fantasy about what I belive or think, saying I am trying to invalidate climate science, I only talked about 1 specific thing but the entire field will crumble to the ground for just this specific inconsistency, what a joke of an argument.
Sorry to say that your ability to read degrades quite quickly, I never said you didnt have knowledge on the carbon cycle, I said you didnt have any authority to say what the main narrative states, and I was right, as you are just another of the thousands of people that provide research and not a spokesman or director of the main organizations.
-
Rabelt at 23:25 PM on 17 October 2023From the eMail Bag: Carbon Isotopes, Part 2: The Delta Notation
Michael Sweet,
Again for the 50th time, I have never said that the carbon cycle is irrelevant, inexistent or not worth being mentioned, on the contrary, yet for some reason 3 of you have repeated the same dumb statements like it addresses anything I said; quote which part I said anything dismissive about the carbon cycle.
I worry about your ability to see, if you are saying the 1000-1800 period is flat, there is multiple trends that vary from increase to decrease, those trends fit Delta C13 with co2 concentrations, not emissions; for industrial periods (1750-2015) we can see 3 main trends, 1750-1900, 1900-1960 and 1960-2015, this 3 trends periods encompass multiple different trends in co2 emissions
-
Bob Loblaw at 23:20 PM on 17 October 2023From the eMail Bag: Carbon Isotopes, Part 2: The Delta Notation
Rabelt:
Again, you are saying "I never said..", and avoiding the logical consequences of what you are saying.
The conversation has all the hallmarks of the following sequence:
A person says:
- A = 3
- B = 8
- C = A+B
Someone else says "So, you are claiming that C = 11?
And the first person says "I never said that C = 11. Stop putting words in my mouth."
You keep referring to "the main narrative". Unfortunately, what you have written here tells me that your idea of "the main narrative" is pretty much a strawman. I don't think you have any clue how the carbon cycle works, how different carbon isotopes fit into that cycle and why they would change over time.
Your comment at 23 illustrates this very well. You see a correlation over the period 1750-1860, and then expect to see the exact same response at later times. You seem incapable of realizing the following:
- There is no direct cause-effect between C13 ratios and atmospheric CO2 levels. They are part of the same large carbon cycle, but one does not cause the other, regardless of any fantasies you have about "the main narrative". As long as you ignore all the indirect connections (known as "the carbon cycle"), you will continue get everything wrong.
- The different time periods have different conditions, different fluxes, and different relative important of atmospheric inputs and sinks of carbon as a result, they would be expected to show slight differences in the patterns.
- Your overly-simplsitic "I see with my little eye..." analysis is telling us nothing about the global carbon cycle. Where you see inconsistencies you think can't be explained (because you won't look) and invalidate climate science, climate science sees the carbon cycle working as expected (because they have looked).
You are hitting two of the five main components of FLICC - the 5 technicques of science denial:
- Logical fallacies [your misunderstanding of "the main narrative" is just one]
- Impossible expectations [your overly-simplistic view of what you think should be happening, and your belief that this disproves something]
FYI, yes I have some authority with respect to carbon cycles, having been involved in analysis of forest carbon cycles and storage, and having my name on several publications related to that. You can read more about my background on the SkS Team page.
-
michael sweet at 22:48 PM on 17 October 2023From the eMail Bag: Carbon Isotopes, Part 2: The Delta Notation
Rabelt,
If we decide to not consider most of what scientists know about the carbon cycle, for example by not considering fossil fuels, volcanoes, the ocean and terrestrial plants, than it is difficult to explain why the carbon 13 is changing. When we consider all that is already known, the explaination for the change in C-13 is that it comes from burning fossil fuels. There is no reason to only consider a fraction of scientific knowledge in our discussion.
Looking at the graph in the OP, I see that before 1800 the concentration of C-13 is flat. You are imagining that you see strong correlations between the carbon concentration and the delta C-13. After 1800 the C-13 dramatically changes. I do not underestand why you think this conplete change from the previous flat line is not significant. The change in C-13 content cannot be from volcanoes or outgassing from the ocean. The only option left is that the C-13 comes from fossil fuels.
Keep in mind that scientists have measured the C-13 content of the air going back much further in time, a couple of hundred thousand years. The only time in the past 400,000 years when there is a dramatic change in the C-13 content of the air in is the last 200 years.
The graph shows that the concentration of C-13 in the atmosphere changed dramatically around 1800. That is when widespread use of fossil fuels started. The C-13 change excludes a volcanic source of the CO2 and also excludes ocean outgassing.
-
Rabelt at 19:31 PM on 17 October 2023From the eMail Bag: Carbon Isotopes, Part 2: The Delta Notation
John Mason,
Can you guys stop fantasizing what I am saying and inventing what I believe? I am not saying that I have a theory on how the changes in Delta C13 are happening, I am criticizing that the main narrative is giving an absolute as if they have a perfect theory when it can not explain its own proxy.
NEVER SAID ANY REASON AS TO WHY IS HAPPENING, STOP PUTTING WORDS IN MY MOUTH, NO VOLCANOES, NO OCEAN, NO NOTHING, RESPOND TO MY COMMENTS EXCLUSIVELY.
-
John Mason at 19:16 PM on 17 October 2023From the eMail Bag: Carbon Isotopes, Part 2: The Delta Notation
Rabelt - The mantle typically has a δ13C of about −5‰, so volcanogenic CO2 emissions can be expected to carry a similar fingerprint. Biosphere carbon is much lighter e.g. in coals, Suto & Kawashima (2016) found −27.4‰ to −23.7‰ (from a sample population of 95 coals from 10 countries). So widespread burning of either vegetation or fossil fuel can be expected to cause a light carbon 'excursion' in the isotope record - and that's what we see. Fig. 3 explains.
Ref:
Suto, N., & Kawashima, H. (2016). Global mapping of carbon isotope ratios in coal. Journal of Geochemical Exploration, 167, 12-19.
-
Rabelt at 18:30 PM on 17 October 2023From the eMail Bag: Carbon Isotopes, Part 2: The Delta Notation
Rob Honeycutt,
During the period 1750-1850, more specifically 1750-1860, there is the start of the industrial revolution as the IPCC says (1750) to 1860, an arbitrary point of time that I am using because the cumulative co2 emissions reach the 7.8 GT of co2 necessary to increase the co2 concentrations 1 ppm, also because its 100 years roughly; during this period there is a downward trend, yet the annual and cumulative emissions are too small to create any perceptible change, so it seems strange that we can see that trend and we can see that following periods, such as 1850-1900 and 1900-1950, show a very similar trend yet the annual and cumulative emissions are tens to hundreds of times bigger; I would expect a faster trend the bigger the emissions, not a 1 to 1, but there is no big change that correlates them.
-
Rabelt at 18:14 PM on 17 October 2023From the eMail Bag: Carbon Isotopes, Part 2: The Delta Notation
Bob Loblaw,
You dont have any authority to say what the main narrative says, so I will continue using the main narrative (IPCC, NASA, CSIRO, etc) as the argument I am debating, not your fantasy.
Delta C13 is a measure that follows the emissions spectrum from human activities, there is no exact correlation indeed, that is what I am arguing, that it doesnt even follow a trend, it follows the co2 concentrations, If we look at the period 1000-1750 (pre-industrial), we can see variations in co2 concentrations are followed by Delta changes, when we look at the other periods, that you are incapable of addressing, we see the same behaviour, Delta follows co2 concentrations not emissions; the narrative from IPCC and similar say that Delta should follow the trends in co2 emissions.
You continue to mention sources that respond and address nothing I say, they dont explain the difference in trends from Delta and co2 emissions, they are explaining the same things as this post (part 1 and 2); Part 1 is irrelevant to the trends in Delta and co2 emissions as it is a physics class, nothing else, maybe read the post and then comment, it would help.
Your interpretation of my statements is irrelevant to what was written in them; I never said the period 1000-1800 is related to post 1800 periods, I exclusively talked about the relation in co2 concentrations and Delta trends in that 800 years period, that you cant read or comprehend is not my problem. Quote the specific part where I said what you accuse me of saying.
The Carbon cycle can affect co2 concentrations and Delta C13, yet your narrative dismiss this and exclusively accuses the change to FF, from 1750-1860 the cumulative CO2 emissions are 8 GT, or the equivalent to 1 ppm, while the change in co2 concentrations was 9 ppm, that presents a mechanism that is not human action that can, and does, change the values and trends from Delta C13 and co2 concentrations.
-
Rob Honeycutt at 12:07 PM on 17 October 2023From the eMail Bag: Carbon Isotopes, Part 2: The Delta Notation
Rabelt... Maybe think of it this way: If burning fossil fuels was primarily responsible for the observed changes in atmospheric CO2 concentrations, based on physics, the prediction would be that there should be an inverse relationship with C13 levels.
The period prior to 1800 is merely the background state prior to the industrial revolution.
-
Rob Honeycutt at 11:45 AM on 17 October 2023From the eMail Bag: Carbon Isotopes, Part 2: The Delta Notation
Rabelt... "If FF was the only/main reason for the changes in Delta, why is the period 1750-1850 visible?"
Why is it visible? Can you explain more clearly what you're thinking here?
-
Bob Loblaw at 10:41 AM on 17 October 2023From the eMail Bag: Carbon Isotopes, Part 2: The Delta Notation
Frankly, Rabelt, you are not making any sense. You are throwing out vague assertions, and you are not providing any logical argument for those assertions.
Carbon cycles are not interpreted solely on the basis of correlations, which is essentially all that you have referred to.
You state "..that Delta C13 is a precise indicator of FF usage...", which clearly shows that you do not understand what C13 ratios tell us. As I explained, it is one small piece of the puzzle, and it is combined with additional information to draw conclusions. You seem to expect a perfect correlation - but if you understood why C13 ratios change (different sources and sinks over time), then you would realize how the specific C isotope characteristics of different sources can help us identify which sources are active.
I have provided additional links to places that will explain it to you, and all you can say is that you think part 1 is irrelevant. I see no evidence that you have understood anything in part 1, or any indication that you have bothered to read any of the other links I provided.
You also state "I have never said that because there was change before any other change is normal/justified in nature", but that is essentially the logical consequence of what you say. Read Michael Sweet's comment at 10. You are assuming that behaviour patterns of C13 ratios and CO2 concentrations prior to 1800 must follow the same variations that occur once fossil fuel sources are added to the mix. Any argument that you make includes the logical consequences of what you state, whether you state it explicitly or not.
You finish with "I said Delta changes previous to human emissions following co2 concentration not FF emissions as there were none, and the ones that existed were accountable for insignificant amounts of co2." The way you have worded this suggests that you think that either CO2 concentration changes cause C13 changes ("delta changes ... following CO2 concentration"), or that C13 changes cause CO2 concentration changes ("delta ... accountable for ... CO2"). This is not even wrong. Both CO2 changes and C13 ratios are the result of other factors in the global carbon cycle. As long as you persist in ignoring the carbon cycle overall, you will be doomed to drawing erroneous conclusions.
-
Rabelt at 09:00 AM on 17 October 2023From the eMail Bag: Carbon Isotopes, Part 2: The Delta Notation
"or that FF dont have an effect on Delta C13" Sorry, I meant: "or that FF does have an effect on Delta C13"
-
Rabelt at 08:54 AM on 17 October 2023From the eMail Bag: Carbon Isotopes, Part 2: The Delta Notation
Bob Loblaw,
Delta C13 is the fingerprint left by FF, if the fingerprint doesnt match then one of the assumptions is wrong: that Delta C13 is a precise indicator of FF usage or that FF dont have an effect on Delta C13, we know the latter true, so it has to be the former. The proof to this is that even using the cumulative co2 gives you a too small amount to affect Delta C13 in any meaningful way, the period specifically is 1750-1850, physically impossible in fact.
I have never said that because there was change before any other change is normal/justified in nature, I said Delta changes previous to human emissions following co2 concentration not FF emissions as there were none, and the ones that existed were accountable for insignificant amounts of co2.
-
Rabelt at 08:27 AM on 17 October 2023From the eMail Bag: Carbon Isotopes, Part 2: The Delta Notation
Bob Loblaw,
I would appreciate if people started to read the comments they are responding to, because I already answered your "response", plus I treated more than 1 period (1000-1800). In fact I used the 1000-1800, 1750-1850, 1850-1900 and the 1960s-2010s periods.
There is not a single thing from part 1 that is relevant to this part 2, and all the relevant points are adressed again in this part.
Please next time refer to my comments not to a fantasy you decided to dismantle, thank you.
-
Bob Loblaw at 07:40 AM on 17 October 2023From the eMail Bag: Carbon Isotopes, Part 2: The Delta Notation
Rabelt @ 9, 11, 13, and 14:
You are really missing the big picture on carbon isotope ratios. The C13 levels alone are not "proof" that the fossil fuels are causing the atmospheric rise in CO2 - they are one line of evidence that rules out other sources. You are over-interpreting what you are reading here (or elsewhere).
This post is titled "Part 2". I suggest that you also read Part 1. It gives essential background about how isotope ratios differ across C12, C13, and C14, depending on the source.
You should also read Climate Change Cluedo. Steps 4 and 5 note the significance of changing C14 and C13 levels. To quote,
- Declining C14 ratio indicates the source is very old, hence fossil fuel or volcanic (ie, not oceanic outgassing or a recent biological source);
- Declining C13 ratio indicates a biological source, hence not volcanic;
Isotope ratios are also discussed on How we know human CO2 emissions have disrupted the carbon cycle, and on What is causing the increase in atmospheric CO2.
The caption on figure 3, which states that declining C13 ratios tell us it is fossil fuel combustion should really be interpreted as "the declining C13 ratio tells us that it is not volcanic. Since volcanoes are the only other possible source of C14-depleted carbon, the only remaining explanation is fossil fuels".
And none of those explanations require that C13 ratios be solely dependent on fossil fuel combustion. Figure 3 shows that for 800 years, C13 ratios were only slightly variable, and have now changed significantly once fossil fuel combustion began.
Your argument that "it changed before, so it can't be fossil fuels now" is just a peculiar flavour of the general "climate's changed before" myth that is number one on the hit parade listed on the upper left of every SkS page.
Just because you don't know of or understand an explanation does not mean that there isn't one.
-
Rabelt at 07:08 AM on 17 October 2023From the eMail Bag: Carbon Isotopes, Part 2: The Delta Notation
Rob Honeycutt,
If FF was the only/main reason for the changes in Delta, why is the period 1750-1850 visible? If the cumulative co2 was just 5Gt, thats not even a full point increase in the co2 ppm, the reduction in Delta should be insignificant; for reference the drop from 1850-1900 is smaller but the cumulative co2 is 45Gt, 9 times greater
-
Rabelt at 06:22 AM on 17 October 2023From the eMail Bag: Carbon Isotopes, Part 2: The Delta Notation
Rob Honeycutt,
I am no saying that FF had/has no effect, just saying that our ability to give a good estimate in the human part of this effect is laking at best, when we cant explain with any consistency the behaviour of the data.
-
Rob Honeycutt at 05:54 AM on 17 October 2023From the eMail Bag: Carbon Isotopes, Part 2: The Delta Notation
Rabelt... I don't think it's the correlation alone that makes the basis of this piece of evidence. It's the basic physics in conjunction with the correlation. Say, the cause of warming was something other than burning FF's. In that case you'd expect to not see such a correlation.
-
Rabelt at 04:55 AM on 17 October 2023From the eMail Bag: Carbon Isotopes, Part 2: The Delta Notation
michael sweet,
You don't see how delta c13 changes with the co2 concentrations, from 1000-1800? During this 800 years there is no emissions or they are negligible, in terms of yearly emissions and cumulative.
Ignoring that problem with the theory of changes in delta = emissions, we have the problem of a steady decrease, in delta, from the 1960s to the 2010s, which do not match the increase in emissions, nor the accelerating growth of co2 concentrations.
-
michael sweet at 03:42 AM on 17 October 2023From the eMail Bag: Carbon Isotopes, Part 2: The Delta Notation
Rabelt,
I don't see your point. The graph of delta CO2 clearly shows that around 1800, the start of increasing fossil fuel use, the amount of C13 in the atmosphere changes dramatically. Before 1800 there are small shifts in the ratio. These shifts seem to correlate with small changes in total CO2. After 1800 the delta C13 goes way down; much, much more than anything before 1800. Are you comparing the small changes before 1800 to the very large changes after 1800 and saying that the small changes indicate the very large changes are natural? The changes are so different in magnitude that you need to provide an explaination why they are so different. The scientific explaination is they are different because of fossil fuel use.
-
Rabelt at 22:21 PM on 16 October 2023From the eMail Bag: Carbon Isotopes, Part 2: The Delta Notation
In this post there is a graphic of co2 concentrations and delta carbon 13 that "proves" human emissions cause co2 increases, it seems disingenuous taking into account that prior to 1800 human emissions were null or insignificant yet the value in delta carbon 13 changes, following co2 concentrations not emissions.
-
PollutionMonster at 21:20 PM on 16 October 2023CO2 limits will harm the economy
One Planet Only Forever @118
Thank you for the thoughtful post, I am looking into buying/borrowing the book you mentioned. :)
-
Doug Bostrom at 12:36 PM on 16 October 2023Skeptical Science New Research for Week #41 2023
There is no "the answer." The concept is found as both an accidental and intentional cognitive short circuit, depending on circumstances.
Among the range of "it's not a simple question" there are answers that are ephemeral (fossil fuels, not useful for completing another 5,000 years of attempting to be civilized) and more decently reliable (the fortuitous nearby fusion reactor).
Meanwhile, let's not forget: "Climate change evangelists" = "people who accept physics as a means of predicting certain possible features of the future."
Personally, I'll enthusiastically evangelize that people not accidentally or intentionally hit themselves in the face with a hammer, or change the impedance of the atmosphere's impedance of certain wavelengths of electromagnetic radiation in a broadly harmful way. Both involve physics as a means of improving outcomes. With regard to the latter, what used to be an accident is now to some degree intentional, something that seems increasingly stupid the more people insist on persisting with that choice.
-
Bob Loblaw at 11:27 AM on 16 October 20232023 SkS Weekly Climate Change & Global Warming News Roundup #41
Berkeley Earth also has temperature updates on a monthly basis. The graphics for each month include maps showing where the monthly temperatures are in the 5 hottest or 5 coldest values in the record.
I wonder if Davz can tell us where on these maps we'll find the UK?


-
Rob Honeycutt at 04:55 AM on 16 October 20232023 SkS Weekly Climate Change & Global Warming News Roundup #41
And just to pre-bunk Davz' claim...
-
Rob Honeycutt at 04:39 AM on 16 October 20232023 SkS Weekly Climate Change & Global Warming News Roundup #41
Davz... I'm not sure there's a point to explaining it to you since you never stick around long enough to listen or discuss any issue. You merely make drive-by comments and disappear.
-
Davz at 03:08 AM on 16 October 20232023 SkS Weekly Climate Change & Global Warming News Roundup #41
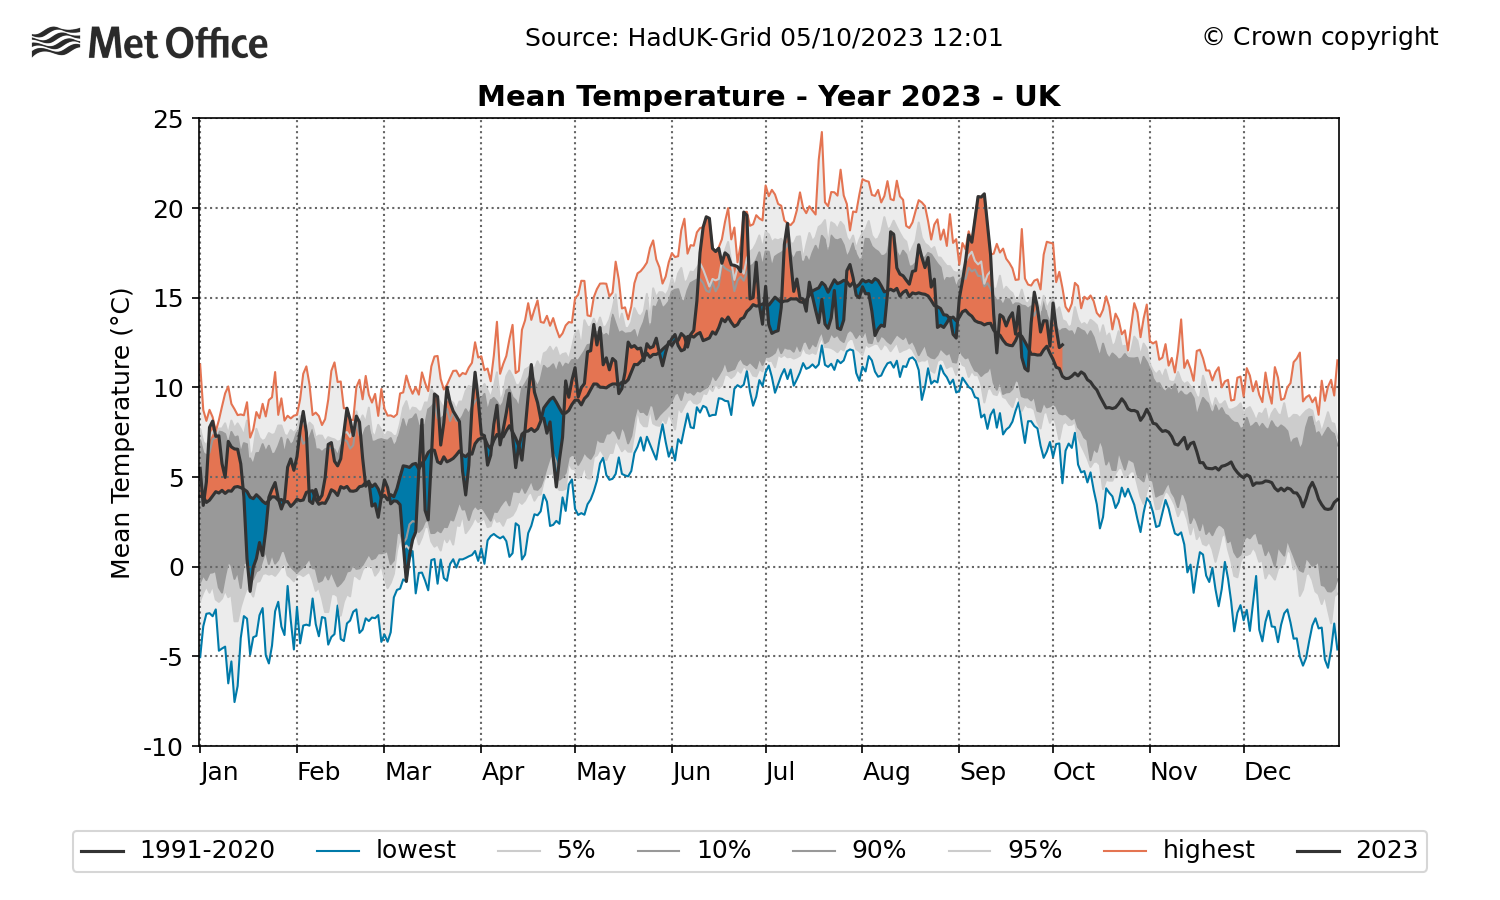
Can you explain why it's been the coldest summer on record in the UK?
Moderator Response:[BL] Such blatant, unsupported, erroneous claims are not welcome here. There is no need for anyone to "explain" something that has not happened.
In comment #3, Rob Honeycutt has posted data that shows that your claim is not true. In addition, a simple web search provides reports that contradict your claim, such as:
Record-breaking June temperatures means that the UK has had one of its ten warmest summers on record, despite an unsettled July and August, according to provisional Met Office figures. Meteorological summer 2023 was the eighth warmest on record by mean temperature, thanks largely to June’s record breaking temperatures, in a series which dates back to 1884.
Warning:
Please note that posting comments here at SkS is a privilege, not a right. This privilege can be rescinded if the posting individual treats adherence to the Comments Policy as optional, rather than the mandatory condition of participating in this online forum.
Please take the time to review the policy and ensure future comments are in full compliance with it. Thanks for your understanding and compliance in this matter.
If you wish to continue posting here, your habit of drive-by statements with little supporting evidence and no responses to criticism will not be allowed. Unless you return to this thread and do at least one of the following, any future posts will be subject to deletion with a pointer back to unfinished business here.
- Admit that your above statement is wrong.
- Provide supporting evidence of your statement, in the form of
- a clear definition of the area you refer to as "the UK",
- a clear indication of the period of time you consider to be "summer",
- a clear indication of the period of time your claim of a "record" covers,
- and a link to the source of data that you have used to draw your conclusion.
-
BaerbelW at 21:06 PM on 15 October 2023Clouds provide negative feedback
Please note: the basic version of this rebuttal has been updated on October 15, 2023 and now includes an "at a glance“ section at the top. To learn more about these updates and how you can help with evaluating their effectiveness, please check out the accompanying blog post @ https://sks.to/at-a-glance
-
Rob Honeycutt at 10:48 AM on 14 October 2023Skeptical Science New Research for Week #41 2023
Davz... Is this another drive-by posting or are you willing to discuss this issue in a substantive manner?


