


 Arguments


Recent Comments
Prev 16 17 18 19 20 21 22 23 24 25 26 27 28 29 30 31 Next
Comments 1151 to 1200:
-
Eclectic at 04:43 AM on 11 August 2023Just how fast will clean energy grow in the U.S.?
Davz @3 , you are quite right that it is only the actual production of electricity that should be stated. Like you, I am irritated by public announcements of XYZ generation capacity newly installed . . . when it would be more honest to quote the actual effective generation (which is in the 15-30% range, for various wind & solar).
Since you have used UK figures (rather than the OP's North American bias) ~ there we see wind turbines supplying around 20-25% of electricity needs. Planned turbine growth will exceed expected growth of UK electricity needs.
The UK usage of lubricating oil is an interesting topic. Davz, on your figures the oil usage by wind turbines is close to 10% of the lubricating oil used by the UK's 40 million vehicles. More turbines = more oil, and yet more more electric vehicles = less lubricating oil. A nett advantage for EV's (and that also ignores the fuel oil used by ICE vehicles).
Davz, please check the figures for lubricating oil used by nuclear plants ~ on the little that I have seen, it is reported that "nuclear" uses a much higher oil amount per MegaWatthour than does coal / gas / wind turbine. And then there is the problem of nuclear's huge costs & very slow build times (but I presume you know that).
Costs of batteries is red-herring. When wind turbines are over-producing electricity, the turbines are feathered or stopped down. Future battery costs . . . who knows? . . . but the technology is leading to much lower prices. Eventually, a small household battery may get to the price of a household refrigerator.
# By the way Davz, please return to your comment on another thread, where you suggested that climate warming had no way of contributing to increased wilfires. It would be ethical of you to discuss your point further ~ or acknowledge that you were wrong.
-
Nick Palmer at 04:30 AM on 11 August 2023A Frank Discussion About the Propagation of Measurement Uncertainty
Did anyone ever see what the reviewers (including Carl Wunsch and
Davide Zanchettin) said about Frank's similar 2019 paper in Frontiers in Science? -
MA Rodger at 02:40 AM on 11 August 2023A Frank Discussion About the Propagation of Measurement Uncertainty
I'm not sure Frank is responsible for 'propagation' or the spreading of nonsense. He is the creator of nonsense that others happily spread. But strangely the remarkable level of stupidity achieved by Frank and other denialists is not an issue for those who spread such denialist messages, or those who happily receive them.
As for debunking Frank's crazyman attack on climatology, this debunking can be achieved in many ways. There is plenty of opportunity as the man is evidently heavily in denial over AGW and stupid enought to feel he is able to prove that his denial-position is correct while the whole of science is flat wrong.
I'm not of the view that climbing down the rabbit hole to chase his nonsense round down in the wonderland world of Pat Frank is the best way to debunk Fank's lunacy. (I talk of 'chasing his nonsense' because his latest published serving of nonsense is an embellishment of work now a decade-plus old while a whole lot different from his nonsense from four years back featured in the video linked @4.) Yet this SkS OP is attempting such a chase.Frank's obvious stupidity does lend itself to debunking although his embellishments with lengthy coverage of associated stuff in this 2023 paper provides him a means of obfuscation. In such a situation, I'd go straight for the conclusions, or in Frank's latest paper 'final' conclusions.
So Frank agrees that there has been warming since the 19th century (as shown by phenology which certainly does indicate "unprecedented climate warming over the last 200 years, or over any other timespan" has occurred in recent decades). But generally Frank's paper would suggest the instrument temperature record cannot show any warming. Indeed having told us of the phenological "direct evidence of a warming climate" he then tells us "The 20th century surface air-temperature anomaly, 0.74 ± 1.94 °C (2σ), does not convey any knowledge of rate or magnitude of change in the thermal state of the troposphere." That 0.74 ± 1.94 °C (2σ) surely suggests a 23% chance that measurement of actual temperature represents a cooling not a warming, with a 5% chance of a cooling of -1.2 °C or more.
And really, if anybody were attempting to question the accuracy of the global temperature instrument record, it would be sensible to start with the work already done to establish such accuracy, eg Lenssen et al (2019). But Frank seemingly doesn't do 'sensible'. -
Davz at 01:12 AM on 11 August 2023Just how fast will clean energy grow in the U.S.?
All sounds great until a realistic analysis of the energy creation in countries that have invested billions into clean energy and it's not all it's cracked up to be. Here in the UK we have over 12000 wind generators, mostly off shore. The amount of energy they create looks on paper to be a reasonable return on the investment until you start looking at the numbers. The issue is that generating the electricity carries on through the night and these figures are used by the govt to mislead the tax payer as the energy from the night isnt required, the vast majority of the population are asleep in bed. It would be great if the energy could be stored but the cost of batteries is at the moment twice the gdp of the uk! In 2020 wind generation of uk output was 25%, remember though that includes night time generation that went to waste. In 2021 generation was 7% as the wind didn't do its job. So to compensate for years the wind doesn't blow the Uk would have to invest in at least 100k wind generators and batteries for storage, that would cost many times more than gdp.....completely unaffordable. Then we have the problem that each wind generator Requires 80 imperial gallons of oil every year for lubrication, if the whole world invests in wind farms oil will still be needed. The only realistic solution is nuclear.
-
David-acct at 21:00 PM on 10 August 2023Just how fast will clean energy grow in the U.S.?
This article describes the massive increases in new electric generation from solar installations by noting the huge increases in solar "capacity" including the following quotes:
"....project that the U.S. will install about 63 gigawatts of new solar capacity by the end of 2024"
" the record 24 gigawatts of solar capacity added in 2021 will likely be broken in 2023 "
Gross increases in solar capacity should be read in full context. If one is going to discuss increases in electric generation from solar, one should be using realistic numbers. As noted by Jacobson in his study of 100% renewables, the US actual solar generation is approx 20.8% of capacity . See his table S11 in his recent 2022 study. Canada actual generation from solar is slightly less at 18% of capacity and Europe is only 17.6% of capacity. Also note that the winter months, the northern US and Canada the electric generation from solar is in the range of 10% or less of capacity.
Below is a link to the German electric generation by source. Note that during the summer months, solar generates 12k GW's -15k GW's daily, while in the winter months, the electricity generated from solar ranges from 1k GW/s -4k Gw's and often falls below 1k GW's.
Moderator Response:[RH] Shortened link
-
sailrick at 13:26 PM on 10 August 2023Just how fast will clean energy grow in the U.S.?
If only we could expand wind and solar as fast as China has.
In 2020 they installed 72 GW of wind and 48 GW of PV solar.
In 2022, they installed another 37.6 GW of wind and 87.4 GW of solar.
In just the first two months of 2023 they installed over 20 GW of solar.
But then, I think they have invested a lot in HVDC long distance transmission lines. -
Eclectic at 09:12 AM on 10 August 2023A Frank Discussion About the Propagation of Measurement Uncertainty
Correction : should be Nigelj @ post 6. Almost certainly!
-
Eclectic at 09:08 AM on 10 August 2023A Frank Discussion About the Propagation of Measurement Uncertainty
Nigelj @8 , you are correct about some of the characters that you yourself encounter at RealClimate blog. Psychiatrically though, the WUWT blog presents a "target-rich environment" for a wider range of pathologies. And Dr Pat Frank is still to be seen making brief comments in the WUWT threads . . . but mostly his comments match the run-of-the-mill WUWT craziness stuff, rather than relating to the Uncertainty Monster.
Anecdote ~ long ago, I knew a guy who had spent a decade or more tinkering in his garden shed, inventing an electrical Perpetual-Motion machine. Continual updates & modifications, but somehow never quite hitting the bullseye. He had a pleasant-enough personality, not a narcissist. But definitely had a bee in his bonnet or a crack in his pot [=pate]. R.I.P.
And the Uncertainty Monster still lives in the darker corners of public discussion. Living sometimes as a mathematical nonsense, but much more commonly in the form of: "Well, that AGW stuff is not absolutely certain to six decimal places, so we ought to ignore it all." Or existing in the practical sphere as: "It is not certain that we could eventually power all our economy with renewables & other non-fossil-fuel systems . . . so we should not even make a partial effort."
-
nigelj at 07:04 AM on 10 August 2023A Frank Discussion About the Propagation of Measurement Uncertainty
Pat Frank sounds like a classic case of a person promoting crank science. Scientific crank for short.
I'm no expert in scientific cranks, or crank science, but I have a little bit of background in psychology having done a few papers at university, (although I have a design degree). I have observed that cranks have certain attributes.
1)They are usually moderately intelligent, sometimes highly intelligent. This helps them come up with inventive nonsense.
2)They are very stubborn and dont admit they are wrong, either to themselves or anyone else.
3) They also frequently tend to be egocentric, arrogant, very confident and somewhat narcissistic. Some people have a disorder called NPD (narcissistic personality disorder) or lean that way:
"Narcissistic personality disorder is a mental health condition in which people have an unreasonably high sense of their own importance. They need and seek too much attention and want people to admire them. People with this disorder may lack the ability to understand or care about the feelings of others. But behind this mask of extreme confidence, they are not sure of their self-worth and are easily upset by the slightest criticism." (mayo clinic)
Narcissists are usually overconfident and very arrogant and they can sometimes be very dishonest.
We all have some egoism or self love, but narcissists are at the extreme end of the spectrum. Maybe its a bell curve distribution thing.
I've noticed that narcissists are unable to ever admit to themselves or others that they are wrong about something and perhaps its because its exceptionally painful for this personality type. So they just go on repeating the same nonsense forever.
While nobody loves admitting they are wrong, or have been fooled or sucked in, either to themselves or others most people eventually do and move on.
Unfortuntately this means the cranks hang around influencing those who want reasons to deny the climate issue.
And of course some of the scientific cranks prove to be correct at least about some things. Which confuses things further. But it looks to me like most cranks aren't correct, especially the arm chair cranks who may not have science degrees.
The Realclimate.org website attracts some of these cranks, including both climate science denialists and also warmists usually with dubious mitigation solutions. You guys probably know who I mean.
-
Bob Loblaw at 22:18 PM on 9 August 2023A Frank Discussion About the Propagation of Measurement Uncertainty
Yes, Eclectic. That video - and the comments from Pat Frank - are rather mind-boggling. That video is one of the key links given in the AndThenTheresPhysics blog post on Propagation of Uncertainty that I linked to above.
There were many other red flags in the recent paper by Frank. On page 18, in the last paragraph, he makes the claim that "...the ship bucket and engine-intake measurement errors displayed non-normal distributions, inconsistent with random error." There are many other distributions in physics - uniform, Poisson, etc. - that can occur with random data. Non-normality is not a test for randomness.
In this blog post, I focused on the most basic mistakes he makes with respect to simple statistics - standard error of the mean, etc.
Frankly, it is Pat Frank that does not know what he is talking about.
-
Eclectic at 10:44 AM on 9 August 2023A Frank Discussion About the Propagation of Measurement Uncertainty
There is a 2017 YouTube presentation by by Dr Patrick T. Brown (climatologist) which is highly critical of Dr Patrick Frank's ideas. The video title is:- "Do 'propagation of error' calculations invalidate climate model projections of global warming?" [length ~38 minutes]
This video currently shows 7235 views and 98 comments ~ many of which are rather prickly comments by Patrick Frank . . . who at one point says "see my post on the foremost climate blog Watts Up With That" [a post in 2015?] # Frank also states: "There's no doubt that the climate models cannot predict future air temperatures. There is also no doubt that the IPCC does not know what it's talking about."
Frank has also made many prickly comments on WUWT at various other times. And he has an acolyte or two on WUWT who will always denounce any critics as not understanding that uncertainty and error are not the same. [And yet the acolytes also fail to address the underlying physical events in global climate.]
In a nutshell : Dr Patrick Frank's workings have a modicum of internal validity mathematically, but ultimately are unphysical.
-
John Mason at 10:08 AM on 9 August 2023At a glance - The tricks employed by the flawed OISM Petition Project to cast doubt on the scientific consensus on climate change
Nigel J #5: Thanks for this feedback. If plenty of people "only read the headline or first paragraph, or half of articles", then there's the huuuuge problem with humanity/for our community straight away! That aside, I take your point here: it is a valid criticism. Noted for actioning at some nearby date (this is a big project so has to be time-managed appropriately)....
-
nigelj at 08:05 AM on 9 August 2023At a glance - The tricks employed by the flawed OISM Petition Project to cast doubt on the scientific consensus on climate change
"How the OISM Petition Project casts doubt on the scientific consensus on climate change......Do you think that a lot of scientists reject the idea that human-caused carbon emissions are responsible for climate change - and is that because you once read about a petition signed by them to that effect? If the answer is yes, then this is for you."
It is well known that plenty of people only read the headline or first paragraph, or half of articles, and here you are stating in the headline that a petition casts doubt on the consensus on climate change, and the very first paragraph states that lots of scientists reject that human emissions cause climate change. With not even a mention of how flawed the oregon petiton was in the first paragraph.
Is this the impression you wanted to leave those readers with? It looks self defeating to me.
-
Bob Loblaw at 03:06 AM on 9 August 2023At a glance - The tricks employed by the flawed OISM Petition Project to cast doubt on the scientific consensus on climate change
Whenever these kinds of petitions come up. I always like to mention the National Center for Science Education's Project Steve. Although targeted at similar petitions related to evolution/creation science, it is equally applicable here. From their preamble:
NCSE's "Project Steve" is a tongue-in-cheek parody of a long-standing creationist tradition of amassing lists of "scientists who doubt evolution" or "scientists who dissent from Darwinism."
Creationists draw up these lists to try to convince the public that evolution is somehow being rejected by scientists, that it is a "theory in crisis." Not everyone realizes that this claim is unfounded. NCSE has been asked numerous times to compile a list of thousands of scientists affirming the validity of the theory of evolution. Although we easily could have done so, we have resisted. We did not wish to mislead the public into thinking that scientific issues are decided by who has the longer list of scientists!
Project Steve pokes fun at this practice and, because "Steves" are only about 1% of scientists, it also makes the point that tens of thousands of scientists support evolution. And it honors the late Stephen Jay Gould, evolutionary biologist, NCSE supporter, and friend.
We'd like to think that after Project Steve, we'll have seen the last of bogus "scientists doubting evolution" lists, but it's probably too much to ask. We hope that when such lists are proposed, reporters and other citizens will ask, "How many Steves are on your list!?"
Even more tongue-in-cheek was when a federal political party in Canada was proposing a process where a referendum could be forced if a group could get 3% of the electorate to sign a petition. The leader's name was Stockwell Day, and a comedy show gathered names on a petition asking Stockwell Day to change his name to Doris Day. (Yes, they got enough signatures. No, he did not change his name.)
-
John Mason at 02:02 AM on 9 August 2023At a glance - The tricks employed by the flawed OISM Petition Project to cast doubt on the scientific consensus on climate change
Re #1 - a very good geologist colleague of mine totally fell for the petition, mainly because I guess he was politically very conservative and the very notion of global warming did not fit with his worldview. I soon realised good scientists can let politics get in the way of trusting other scientific disciplines to have the same rigour as one's own. In a sense, I learned an important lesson right there.
-
Bob Loblaw at 01:18 AM on 9 August 2023A Frank Discussion About the Propagation of Measurement Uncertainty
Gil @ 1:
Who is "he"? Patrick Frank? Can you specify in which part of his article he makes this reference?
-
John Hartz at 01:14 AM on 9 August 2023At a glance - The tricks employed by the flawed OISM Petition Project to cast doubt on the scientific consensus on climate change
I suspect that many of the OISM signers have passed away over the past 25 years. The petition is now an irrelevant historical artifact.
-
DavidS at 00:38 AM on 9 August 2023A Frank Discussion About the Propagation of Measurement Uncertainty
You cannot validate science with marketing, nor marketing with scientific processes. In this article there is a lot of taking something hot in one hand as proof the other hand is not cold. A lot of selling going on here.
Moderator Response:[BL] - Contents snipped. This is a return of a previously-banned user, using a new name, which is strictly prohibited by the Comments Policy.
-
Gil O at 23:46 PM on 8 August 2023A Frank Discussion About the Propagation of Measurement Uncertainty
He lost me when he called nominal thermometer precision with accuracy. Maybe it was a typo, but such an elementary mistake really takes a toll on any presumed ethos the author may have wanted to project.
-
ubrew12 at 17:33 PM on 8 August 2023At a glance - The tricks employed by the flawed OISM Petition Project to cast doubt on the scientific consensus on climate change
My Dad signed that petition. He was a Crop Scientist. I'm sure he meant well, but 'damage done'. How hard is it to sign your name? I took two terms of Atmospheric Physics. For a few months I was working to get a PhD in climatology, but I later left to get a Masters in Mechanical Engineering. Did I sign any petitions? Have I signed any since? Because I was lightyears more qualified to do so than my Father, who knew a lot about Plant Genetics, and a little about anything other than Plant Genetics. But, regarding the Scientific opposition to AGW, that has rarely been a disqualifier. As long as you 'wrote the book' on Plant Genetics, then you must certainly know everything there is to know about the subset of GeoPhysics called Atmospheric Science...
-
BaerbelW at 02:27 AM on 7 August 2023Extreme weather isn't caused by global warming
Please note: the basic version of this rebuttal has been updated on August 6, 2023 and now includes an "at a glance“ section at the top. To learn more about these updates and how you can help with evaluating their effectiveness, please check out the accompanying blog post @ https://sks.to/at-a-glance
-
John Mason at 21:15 PM on 6 August 2023The difference between land surface temperature and surface air temperature
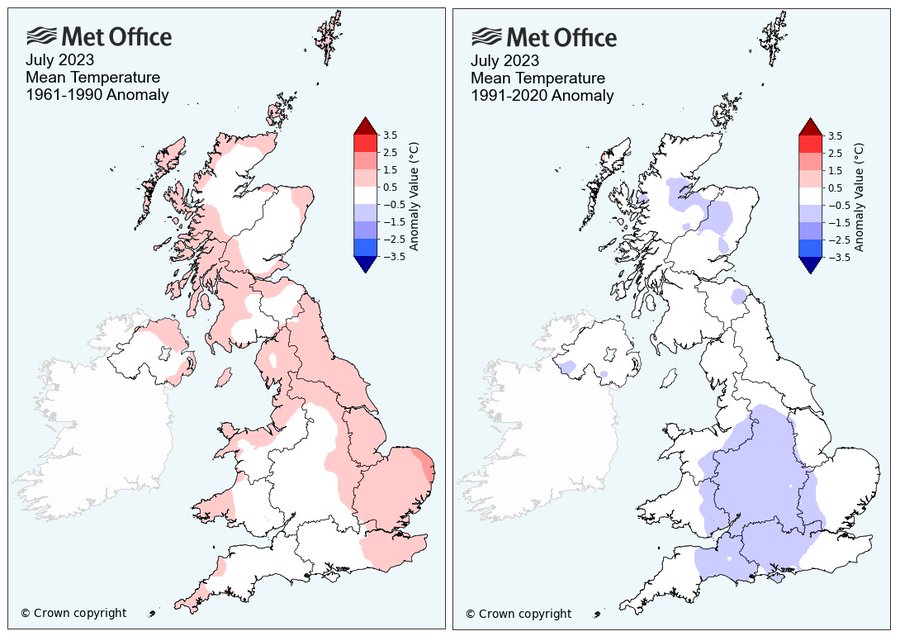
Here's a telling chart: July 2023 would have been warmer than average against 1961-1990 climatology, but against 1991-2020 it was a bit cool:
-
John Mason at 16:46 PM on 6 August 2023The difference between land surface temperature and surface air temperature
And according to Trevor Harley, July 1922 was the coldest on record with an average temperature of 13.7C.
-
John Mason at 16:29 PM on 6 August 2023The difference between land surface temperature and surface air temperature
also re - #2, I just checked and in the UK, July 2023 had a mean temperature across the month of 14.9C, 0.3C below the average for the period 1991-2020. Ironically, June was the warmest UK June on record with a mean temperature of 15.8C, this being 2.5C higher than average. Note the mich wider margin by which the heat record was broken; July was only a bit sub-par (no record there).
-
John Mason at 16:15 PM on 6 August 2023The difference between land surface temperature and surface air temperature
re #2: As Eclectic points out, wildfires have occurred in the geologic record ever since land plants colonised the landmasses. Charcoal horizons in terrestrial sedimentary rocks provide the evidence. Dry lightning is a very obvious cause and is a key causal factor in many parts of the world today.
Vegetation does not spontaneously combust but can become well-primed by prolonged hot rain-free conditions to become an inferno should a fire start from any cause.The UK has certainly had a below-average July but that's because it was stuck on the cold side of the jetstream for much of the month.
Looking back through reanalysis charts, 'Cerberus' was a flabby anticyclone but nevertheless it caused northwards warm air advection from northern Africa, just as UK heatwaves involve warm air advection from southern Europe as a rule, hence the meteorological term, 'Spanish Plume'. In a warming world, the chances of such events causing even hotter conditions are obviously increased.
-
PollutionMonster at 15:03 PM on 6 August 2023It's not urgent
Eclectic@40
Thank you I found the quote, would have taken me a very long time to find on my own. I could only find a much lower number before. Going to argue with some deniers now. :)
-
citizenschallenge at 13:38 PM on 6 August 2023The Cranky Uncle game can now also be played in Finnish!
Congratulations.
Keep up the good work.
-
prove we are smart at 10:35 AM on 6 August 2023Skeptical Science New Research for Week #31 2023
MA Rodger @2,
Thanks for that reply, I agree entirely with your comments and the link you shared was especially informative, cheers Col.
-
Eclectic at 10:02 AM on 6 August 2023The difference between land surface temperature and surface air temperature
Davz @2 ,
You have many questions ~ but I would be grateful if you would clarify your second question.
Your second question does not seem to make sense. I assume that you are correct in that the ignition temperature of scrubland materials would be high (for instance, the wood-based material known as paper has an auto-ignition temperature above 200 degreesC ). And climate range does not extend anywhere near 200 degreesC, or even 100 degreesC.
And yet wildfires have occurred throughout pre-history, before humans & hominids, and even well before 1 million years BC. So your "question" presents a paradox ~ wildfires cannot occur naturally . . . and yet wildfires have occurred naturally.
Perhaps the paradox can be resolved by you expressing yourself more logically. Were you perhaps meaning to say that climate favoring hotter drier days would make wildfires worse in extent & intensity . . . which would make sense ~ but that makes nonsense of your second question.
-
Davz at 08:04 AM on 6 August 2023The difference between land surface temperature and surface air temperature
could the author kindly explain the role of the anti-cyclone known as Cerberus on the heat wave in southern Europe? Could you also explain how wild fires were started by climate change as spontaneous combustion of scrubland normally takes place at a much higher temperature, temperatures beyond that of the climate, so how can wildfires be attributed to the climate? Can you explain why the temperatures in Europe are now normal and have not been maintained and lastly why has the UK experienced the coldest July on record. Events like these need explanation If they are going to be attributed to global warming.
-
Jim Hunt at 08:01 AM on 6 August 2023The difference between land surface temperature and surface air temperature
"People who create and/or circulate such myths are denying plain reality."
There's a lot of it about at the moment John! My own recent article on the creation and circulation of similar myths takes a look at some theory whilst also debunking some specific "skeptical" memes:https://GreatWhiteCon.info/2023/08/the-information-war-with-the-fossil-fuel-industry/
By way of just one example, if you can spot the difference between these two graphs of Arctic sea ice extent you may well wonder why a certain "Steve Goddard" has been continuously blasting the former data at his flock of faithful followers rather than the latter?
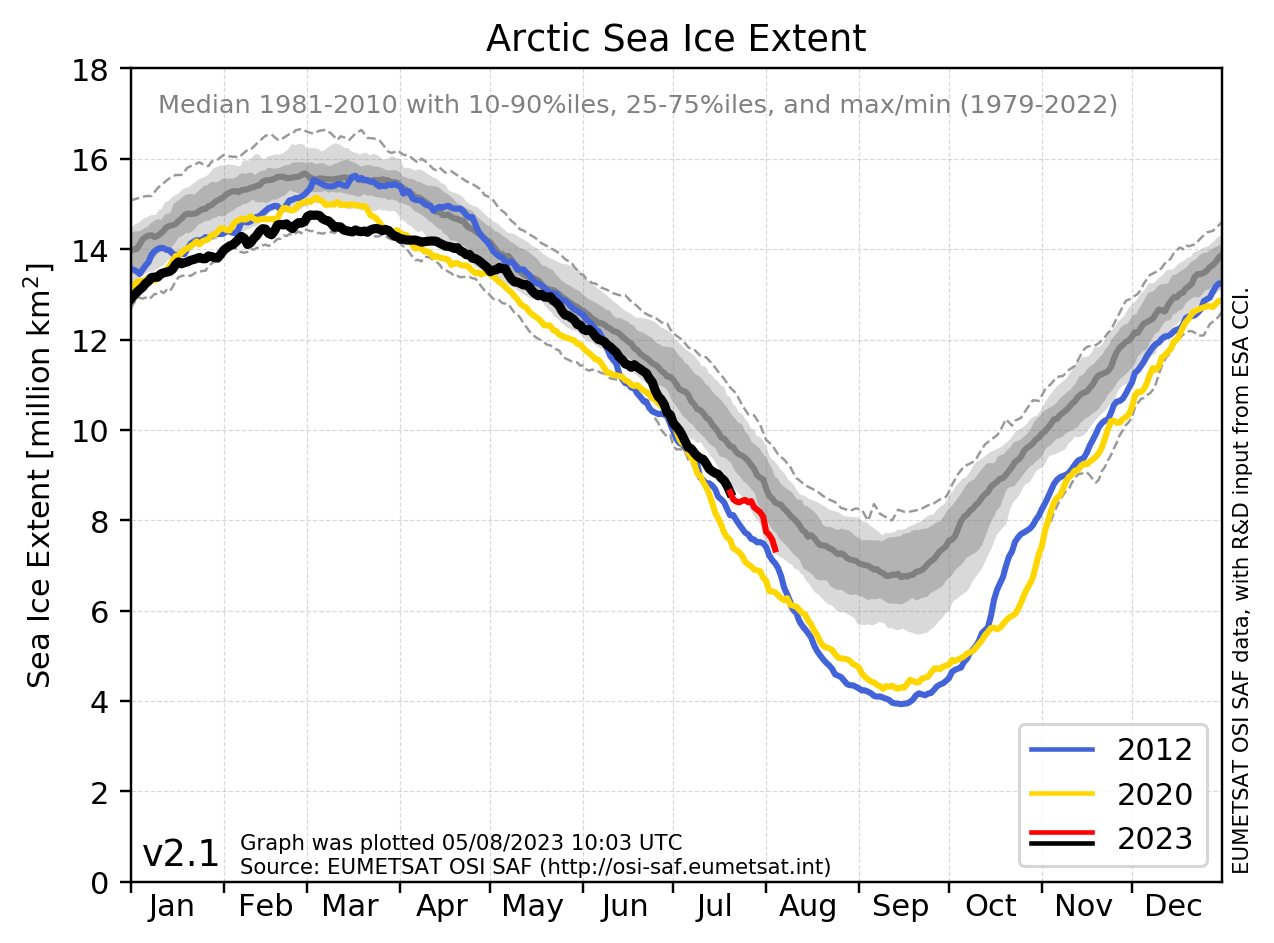
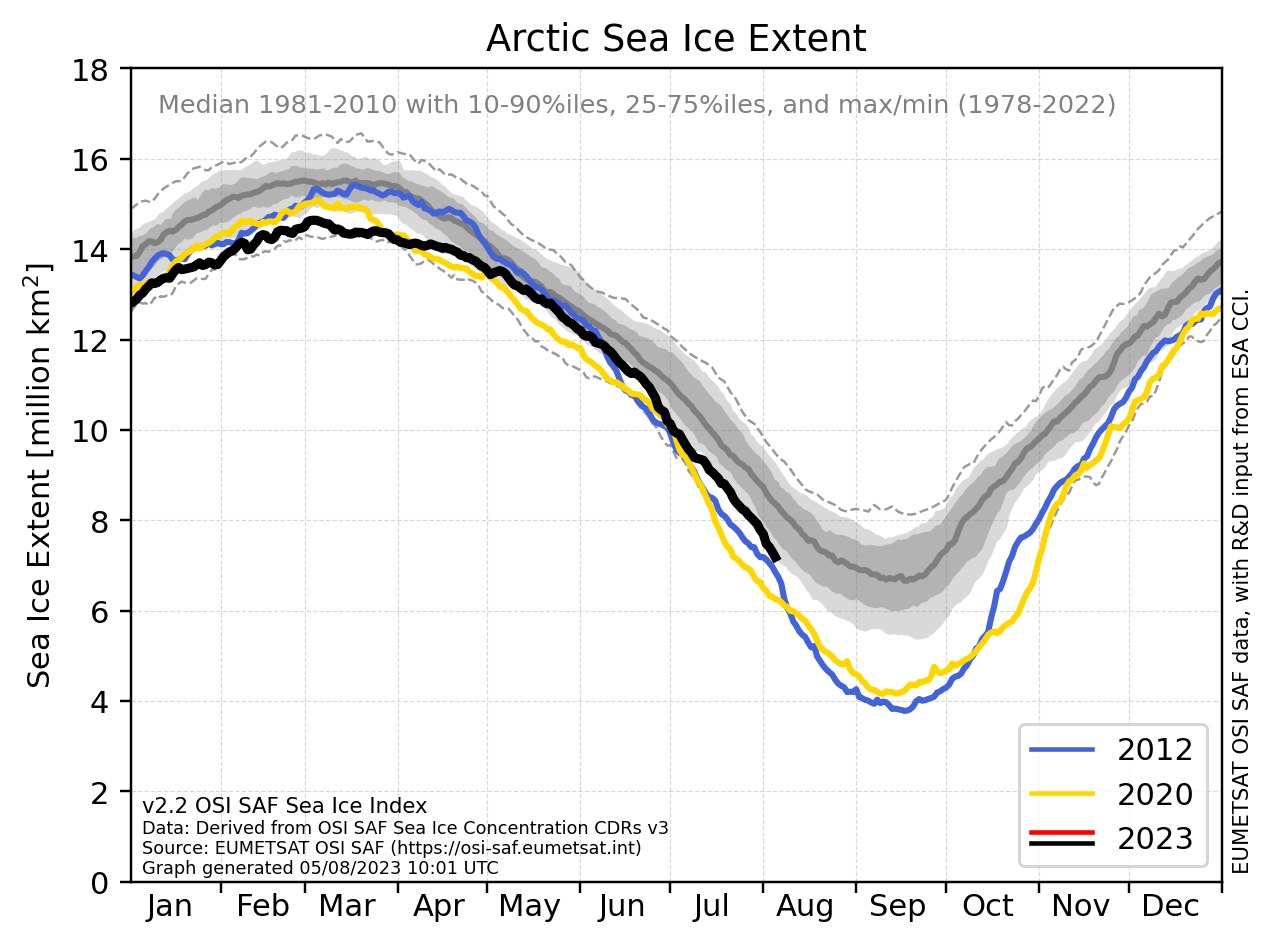
Events, dear Tony, events!
-
MA Rodger at 04:03 AM on 6 August 2023Skeptical Science New Research for Week #31 2023
prove we are smart @1,
You ask "Is all if this video true?" The answer is 'No'.
It is true that the sulphur emissions from shipping causes cloud formation. But the assertion that the absence of such emissions is the cause of the high 2023 Atlantic SSTs is a difficult one to accept.
The annual June anomaly for such SSTs is plotted here in this Copernicus item on the heat waves, as is the daily year-on-year plot (as seen in the video @0.25). Note that we are not seeing a rise in SST through recent years as we would expect to see resulting from a lowering of sulphur pollution. This is, as the Copernicus item describes, primarily a weather-driven event. The contributions from GHG forcing and pollution are not the the immediate cause of the specacular temperature anomalies.
And the assertion that we could through geoengineering cool the planet and reverse AGW is exceedingly naive. Significant cooling of the planet through geoengineering would come with unintended and very likely unwelcome climatic impacts. A better plan is to put all our efforts into reducing CO2 emissions and after that intentionally removing past emissions.
-
prove we are smart at 20:15 PM on 5 August 2023Skeptical Science New Research for Week #31 2023
Just a few questions for the scientists here:
Is all of this video true?
Do ocean vessils create "sea tracks" making clouds that shade out the ocean more than the dust blowing off-shore from the Sahara Desert often does?
Can it be simply done to seed the ocean air with air-blast sea-water droplets when atmospheric conditions are suitable and make clouds bigger to create shade and should it be done? Just wondering..
-
Eclectic at 17:55 PM on 4 August 2023It's not urgent
PM @39 ,
Nordhaus's comments are found in the online Washington Post, in an interview with Steven Mufson on 14th June 2021.
About halfway down the rather short interview. To me, Nordhaus seems very reasonable ~ apart from his obliviousness to the vast misery consequent on a 3 or 4 degree warmer world. He also opines that "Carbon Price" would sound much better than "Carbon Tax" . . . so yes, I think he is very aware of the delicate sensibilities of many of his American audience!
-
PollutionMonster at 15:49 PM on 4 August 2023It's not urgent
Eclectic @38
You've made some interesting points. One week I really dug in and was arguing for 8 hours + a day with deniers, did not make me happy. Do you have a source for the $100 per ton tax on carbon emissions from Nordhaus? I've searched and searched but could not find. Thank you. -
David-acct at 08:31 AM on 4 August 20232023 SkS Weekly Climate Change & Global Warming News Roundup #30
Nigelj - 44.304% number was the same as yours (though I was rounding ) ..
Thats what I like about cross checking the data in a dispassionate manner against actual source data so the I can honestly evaluate the factual evidence without being swayed by activists talking points.
for example Michael makes mention of Hydro to cover the shortages, though there is no Hydro in the ercot grid, nor is the geography or water storage needs compatable with utilizing hydro.
Michael also makes mention of the battery storage such as being used in the De Cordova plant near grandbury with 260mw battery storage, though that battery storage is only good for 1 hour at full usage. The 260mw is comparable to the plant hourly capacity, so it the plant shuts down, the backup power is only good for 1 hour ( longer if shut down occurs in non peak season) The backup power is used to reduce the peaking power requirement , thus is nearly fully discharged daily during the summer.
-
David-acct at 08:15 AM on 4 August 20232023 SkS Weekly Climate Change & Global Warming News Roundup #30
Michael - Nigrelj partially answered your question on how to drill into the EIA data
using the link - right side column "chart options"
Chose frequency - daily or hourly
Date range type - choose custom
Number of days - less than 30 days will provide the hourly - longer than 30 will only display daily
Select balancing authority - click on any grid - ERCOT/ MISO / PJM / SWPP or any other grid.
Hope that helps you learning how to navigate the real time source data.
A baseball player can look at the box score printed in the sports section of the newspaper (on line these days) and tell you what happened every inning. Same thing with the EIA electric generation by source report. Once you learn how to read the source data, you will have a greatly improved grasp of what is actually happening, and far less easily fooled by the activists representations. Hope that helps.
Moderator Response:[DB] Inflammatory snipped. Do better.
-
nigelj at 06:55 AM on 4 August 20232023 SkS Weekly Climate Change & Global Warming News Roundup #30
Regarding the ERCOT grid controversy being discussed. I had a look at the EIA page with the interractive graph. I plugged in the Texas ERCOT grid for 28 June - 29 June 2023. (you do this under the select balancing authority / region and then the date selection panel). I discovered you can then hover the arrow over the point on the graph you want and the data appears.
The best case for renewables plus nuclear power was on 28 June (although both days were very similar). I got the following numbers: wind + solar + nuclear 35,562 mwhr and for Gas + coal 43,472 mwhr. This is 44.304 % for wind + solar+ nuclear (using an online percentage calculator that would only let me enter simple numbers 35 and 43 but this is useful enough) so this does seem to roughly confirm David Accts result.
However I'm wary of such things. Im just reading things off a web page. Im not an electrical engineer, and its not clear how the people in the article arrived at their numbers. Although all the raw data seems to be on the EIA page there is the perrenial problem of potentially comparing apples and oranges.
And 44.304% is still a very credible result. And obviously it should be noted that wind and solar are still only a smaller component of the grid relative to fossil fuels.
-
michael sweet at 03:52 AM on 4 August 20232023 SkS Weekly Climate Change & Global Warming News Roundup #30
I looked at your EIA link (sorry I missed it before). I could not figure out how to get data for ERCOT from it. I noticed that the lowest times for wind were allways durig the day when the production of solar was high. At night demand is much lower. WIth more wind and solar buildout that should continue to be benificial.
Hydro can be used to generate power at times when wind and solar are low. In the cases you mention, hydro could probably cover most or all of the shortages at night. Since they are also installing battery storage in ERCOT, as well as a lot more solar, they should be covered.
Scientists who study power systems have all come to the conclusion that renewable energy will be able to handle all power all the time with higher reliability than current fossil systems. You are simply making up your own claims without any analysis to support your incorrect conclusions. I have already provided you links to support this claim but you apparently have not read them.
-
Philippe Chantreau at 03:00 AM on 4 August 2023Wildfires are not caused by global warming
Bob makes a interesting point above by bringing the difference between grasslands fires and forest fires, and how they play in the decrease of global area burned.
As Bob pointed above, said decrease is pretty much entirely due to the lower area of savannah and grasslands burned. These environments have a long relationship to fire and are very well adapted to it, with grass species in fact relying on it for their life cycle. The carbon cycling from grassland fires is a short term one that has always been present in the background of the natural global carbon cycle. The amount of CO2 released per unit of surface burned is limited, since grasslands store the vast majority of their carbon underground, and quickly regenerate the above ground part that is lost in fires.
Forest fires, especially the ones affecting old growth forest are an entirely different beast. The amount of CO2 generated by unit of surface is much higher for forested lands. Zheng et al (2021) show that the CO2 released by forest fires essentially compensates for the decrease in total area burned provided by the decline in grassland fires. The result is a "quasi stable" amount of CO2 generated by wildfires. It would not be surprising if this changed with more years like this one has been in Canada and Siberia.
-
michael sweet at 02:12 AM on 4 August 20232023 SkS Weekly Climate Change & Global Warming News Roundup #30
David-acct:
Can you provide a link to where you say you found data that contradicts the CNN article? A claim without a link is not worth much. I note that even if renewables provided "only " 45% of total electricity that renewable energy was what kept the lights on in Texas the last two months.
SInce renewables have only been the cheapest electricity for about 5 years I would say they are doing great!!
-
Eclectic at 14:37 PM on 3 August 2023It's not urgent
PollutionMonster @37 , yes the economist William Nordhaus is an interesting case.
Climate science deniers love him since he seems unconcerned about a 3 or 4 degree rise in global temperature . . . because, in his estimation, the vastly higher temperature will have no adverse effect on "output" (aka Gross Domestic Product ~ GDP being the heart & soul of economists' thinking). And undoubtably Nordhaus is correct in his projections, for we all know that the "dismal science" of economics has an impeccable track record of long-term accuracy . . . and it is also the Be-all & End-all of measurement of human happiness (and of all other aspects of the natural world).
But putting that minor point aside, the Denialists are slightly less happy that Nordhaus has suggested a $100-per-ton tax on carbon emissions ( I am unsure, but presume he means tax on tonnage of CO2 rather than tonnage of elemental carbon emitted ).
As per usual, Denialists feel entitled to cherry-pick from the sayings of any prominent scientist or public figure, in order to support themselves.
For arguing online ~ no, it is not a waste of your time, since your comments will be seen by "undecided" fence-sitters. No, your arguments won't & can't change the minds of the hard-core intransigent Denialists (who are usually political extremists that are basically uninterested in the actual science or the actual happiness of other people). But your activity will encourage decent sensible people.
Only keep arguing so long as you find it fun/entertaining. Refresh yourself with lots of walking & greenery & open skies . . . plus good company and other interests in life. But I am sure you already know that is how Life should be lived.
-
PollutionMonster at 12:08 PM on 3 August 2023It's not urgent
I agree that it can be fun entertainment for awhile. Yet, after awhile it just becomes exhausting trying to keep up with a denier constantly changing topics only to repeat as in your example with the anti-vaxx.
MA Rodger said in #27 that it was still nesscary to argue with deniers, do you agree? Or am I wasting my time arguing online?
What about William Nordhaus? Deniers like to reference him. Saying that we should aim for 3.5C change and that 1.5-2C is infeasible if not impossible by 2100. Thank you in advance.
-
David-acct at 12:05 PM on 3 August 20232023 SkS Weekly Climate Change & Global Warming News Roundup #30
Below is an except of the statement in the CNN article linked to by michael sweet.
"And as the state struggled through an early heatwave in June, non-fossil fuel power including renewables and nuclear made up 55% of total generation on June 28 and 29 and close to 50% of the power needed during the evening peak, according to statistics from the federal Energy Information Administration."
I Went to the EIA electric generation by source, dialed into the ERCOT grid and compared the actual data against the claimed data in the article ( basic due diligence). At best , Wind solar and Nuclear only got to 45% of total electric generation and they article included Nuclear which is generally not considered a renewable.
As I have previously stated multiple times, cross check the claims against the actual source data to prevent being fooled.
-
Eclectic at 08:32 AM on 3 August 2023CO2 effect is saturated
[ If the Moderator will allow a brief off-topic musing, I promise a sort of return in my concluding paragraph. ]
As a complete tyro in the world of probabilistic AI language generative models, I picture ChatGPT as the analogy of a Zillion monkeys tapping away at a Zillion typewriters . . . and eventually (which is actually a millisecond) out comes something speciously good. The product is sometimes Booker Prize standard; sometimes merely quite presentable; sometimes a diamond but deeply flawed when examined closely; and sometimes there is an Einsteinian Pearl of inventiveness (if the reader has the wit to pick it up and run with it). But always, the winning monkey has no real knowledge of what he has produced. Play-It-Again-Sam . . . and a millisecond later, the new winning monkey gives you a somewhat different product. ~In a decade's time, will the current language AI become so refined as to filter out its own fabrications & nonsenses? Probably yes...
On-topic ~ another analogy is the brain of the climate-science-denier, whose Motivated Reasoning (produced by a Zillion monkey neurons) keeps coming out with flawed presentations, in various repetitions. Monkeys, or Dragons?
-
Rob Honeycutt at 04:49 AM on 3 August 2023CO2 effect is saturated
I've played around with ChatGPT and found that it has a tendency to make sh*t up. When you push further it will acknowledge that it is merely a natural language generator. It doesn't have the capacity to review and verify the accuracy of its output. It's just very good at sounding authoritative. But, to its credit, it will tell you not to rely on its statements and to engage experts in the field to verify any facts.
-
MA Rodger at 22:12 PM on 2 August 2023CO2 effect is saturated
Eclectic @705,
If the jibberish presented @704 is an output from ChatGPT, or some similar machine learning engine, then the technology is being greatly over-hyped.
I don't see that the CO2 absorption/emission spectrum "approaches a blackbody" spectrum at high concentration or density. (Concentration and density seem to be confused in the #704 account.) N2 & O2 are transparent to IR so they have no spectra (although this is indeed "constant over the IR range"). There are more bands of the spectrum absorbed by atmospheric CO2, not just at 15 micron. And up-welling IR is not restricted to "altitudes of only a few hundred meters" as CO2 emits as well as absorbs.
-
Eclectic at 19:41 PM on 2 August 2023CO2 effect is saturated
Welcome back, DragonsHeads / DragonHeads / DragonSeed / DragonTeeth... It appears you have enlisted the aid of ChatGPT or Bard or other Artificial Intelligence "large language models", to construct your post #704.
ChatGPT etcetera typically produce a lot of words, with an initial semblance of meaning . . . but on closer examination, the words can often fail to show a true connection with reality ~ and that is the case here. DragonChat, you are spouting nonsense. Come back in 2030, in your seventh iteration ! [ Meanwhile, you might enjoy exercising yourself at the website WattsUpWithThat ;-) ]
Moderator ~ you are too quick on the draw !
-
DragonsHead at 19:03 PM on 2 August 2023CO2 effect is saturated
Eclectic and Moderators
If you would quit being so arrogant and ban-happy, you might just learn a little something on subject you are talking about. From your comments, analogies, and "rebuttals" on the CO2 greenhouse effect saturation issue, I would place your knowledge of spectroscopy somewhere between lacking and non-existent! Since all GHGs, including CO2, are trace gases, their spectra are much closer to that of single molecules than blackbodies. As the concentration of such a gas increases, however, the individual spectral lines are broadened into bands. If the density is further increased, those bands eventually overlap each other and are merged into a more or less continuous spectrum. Finally, in the extremely high density limit, the spectrum approaches a blackbody and it actually makes sense to talk about a temperature and pressure of the gas.
Now, the spectra of the main atmospheric gases N2 and O2 can be approximated with blackbody curves since they are of sufficiently high concentration. Also, the absorption coefficients can be regarded as roughly constant over the IR range. This is not the case, however, for CO2 nor any of the GHGs since these are trace gases. For the GHGs, we must determine an absorption coefficient for each spectral band. In the case of CO2, the important band for the GHE is the 2 micron band at a 15 micron wavelength. All other bands are either too weak or too far away from the peak of the upwelling IR spectrum. Therefore, CO2 can affect temperature only by absorbing radiation within this particular band. This is a strong absorption, however, so radiation within this band of the upwelling thermal energy is depleted at altitudes of only a few hundred meters. Above that, CO2 can absorb no more upwelling energy regardless of its concentration. Now, there is still upward-bound thermal energy, but not within the 15 micron band. That energy would most likely be absorbed by H2O vapor or escape to outer space.
Unfortunately, however, every purported rebuttal to CO2 GHE saturation in this Climate Myth page has, one way or another, involved the assumption of a single absorption coefficient for CO2 which applies for the entire IR spectrum. Simply put, this is incorrect and results in gross over-estimations of the amount of heat energy absorbed by CO2.
In summary, your case against CO2 GHE saturation wouldn't stand up under the scrutiny of a good student.
Moderator Response:[PS] You can lead a horse to water...
-
Rob Honeycutt at 08:20 AM on 2 August 2023CO2 emissions do not correlate with CO2 concentration
Dave... "If either of you gentlemen (or anyone else) find another error, or any misleading information, on my site, I will be grateful if you bring them to my attention."
I think you don't grasp that there is no reason for anyone to spend any time on your site at all. It is a multi-year Gish gallop. And here, in your posting efforts on SkS, you've demonstrated a stark unwillingness to update or alter your position on many errors pointed out by others.


