


 Arguments


Earth is warming 50x faster than when it comes out of an ice age
Posted on 24 February 2016 by dana1981
Recently, The Guardian reported on a significant new study published in Nature Climate Change, finding that even if we meet our carbon reduction targets and stay below the 2°C global warming threshold, sea level rise will eventually inundate many major coastal cities around the world.
20% of the world’s population will eventually have to migrate away from coasts swamped by rising oceans. Cities including New York, London, Rio de Janeiro, Cairo, Calcutta, Jakarta and Shanghai would all be submerged.
The authors looked at past climate change events and model simulations of the future. They found a clear, strong relationship between the total amount of carbon pollution humans emit, and how far global sea levels will rise. The issue is that ice sheets melt quite slowly, but because carbon dioxide stays in the atmosphere for a long time, the eventual melting and associated sea level rise are effectively locked in.
As a result, the study authors found that due to the carbon pollution humans have emitted so far, we’ve committed the planet to an eventual sea level rise of 1.7 meters (5.5 feet). If we manage to stay within the 1 trillion ton carbon budget, which we hope will keep the planet below 2°C warming above pre-industrial levels, sea levels will nevertheless rise a total of about 9 meters (30 feet). If we continue on a fossil fuel-heavy path, we could trigger a staggering eventual 50 meters (165 feet) of sea level rise.
Predicting how quickly sea levels will rise is a challenge. However, two other studies just published in the Proceedings of the National Academy of Sciences found that the Antarctic ice sheet could melt more quickly than previously thought, and thus contribute to relatively rapid sea level rise. Over the past century, global sea level has risen faster than at any time in the past two millennia, and most of the recent sea level rise is due to human-caused global warming. Several feet of sea level rise this century is likely, with a possibility of 5 feet or more.
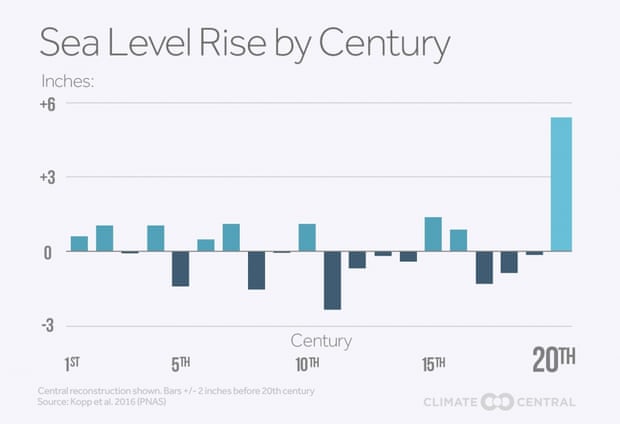
Sea level change during each of the twenty centuries of the Common Era. Illustration: Climate Central, based on Kopp et al. (2016), published in the Proceedings of the National Academy of Sciences.
The Nature Climate Change study didn’t just look at sea level rise; it also looked at global temperature changes. Earth’s sharpest climate changes over the past half million years have occurred when the planet transitions from a ‘glacial’ to ‘interglacial’ period, and vice-versa.
Right now we’re in a warm interglacial period, having come out of the last ice age (when New York City and Chicago were under an ice sheet) about 12,000 years ago. During that transition, the Earth’s average surface temperature warmed about 4°C, but that temperature rise occurred over a period of about 10,000 years.
In contrast, humans have caused nearly 1°C warming over the past 150 years, and we could trigger anywhere from another 1 to 4°C warming over the next 85 years, depending on how much more carbon we pump into the atmosphere.
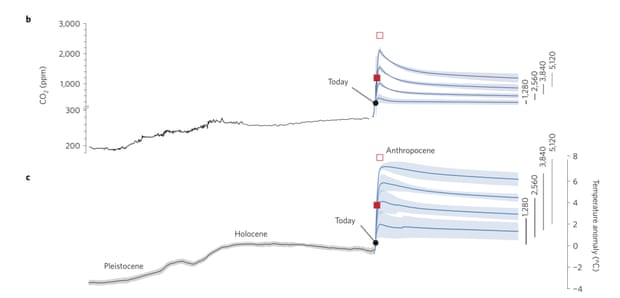
Atmospheric carbon dioxide levels (top) and average global surface temperature (bottom) from the past 20,000 years to the next 10,000 years in various emissions scenarios. Illustration: Clark et al. (2016), Nature Climate Change.
What humans are in the process of doing to the climate makes the transition out of the last ice age look like a casual stroll through the park. We’re already warming the Earth about 20 times faster than during the ice age transition, and over the next century that rate could increase to 50 times faster or more. We’re in the process of destabilizing the global climate far more quickly than happens even in some of the most severe natural climate change events.
That rapid climate destabilization is what has climate scientists worried.


So, with:
1) the meltwater pulse that happened about 8000 ybp raising sea levels 1-2 meters per century, people.rses.anu.edu.au/lambeck_k/pdf/262.pdf
2) and the Meltwater Pulse 1A at the end of the last ice age 13,800 years ago, raising sea levels over 5 meters per century,
3) and with current warming happening 50 times faster than during those events...
What rates of sea level rise should we be expecting, exactly. And how soon?
While warming is faster, there is a lot less ice to melt. It is certainly an interesting question. You might like to look at new paper on it here. Some discussion about it over at Realclimate.
Thanks, scaddenp. I had seen the RC piece, but not the other one you linked to.
What do you think of Hansen and Sato's claims that we could see a doubling rate of ten years over this century with a resultant ~5 meter rise by 2095?
www.columbia.edu/~jeh1/mailings/2011/20110118_MilankovicPaper.pdf
pages 15 -16
wili - In that Hansen and Sato 2011 they point out that we shouldn't ignore outlier estimates, noting that "...a 10-year doubling time was plausible, pointing out that such a doubling time from a 1mm per year ice sheet contribution to sea level in the decade 2005-2015 would lead to a cumulative 5 meter rise by 2095."
Note that they don't claim that is likely, but that it is plausible, and in the next paragraph note that "...more plausible but still accelerated conditions could lead to sea level rise of 80 cm by 2100." Note "more plausible" in that sentence. They then go on to discuss strong negative feedbacks as well.
The point they were making in that paper was that we can't at this time exclude extremely high sea level rise, and that more study is needed. They weren't claiming 5m by 2100 was the likely outcome, just that it wasn't impossible - despite multiple out of context claims by climate denialists, which seem IMO to be poor attempts to discredit Hansen.
The title says "Earth is warming 50x faster than when it comes out of an ice age," but the article says "We’re already warming the Earth about 20 times faster than during the ice age transition, and over the next century that rate could increase to 50 times faster or more."
Thanks for the clarification, KR. IRRC, Hansen somewhere also said we couldn't competely rule out a doubling time of 5 years. But I don't have the source at my fingertips, so maybe that's my memory playing tricks on me.
I still wonder why one shouldn't just multiply 50 (or 20, or whatever) to the rates given in #s 1 and 2 in my first post to get an approximation of the rates we should expect going forward. I know that there was a lot more ice then in the northern hemisphere, but as I understand it, the Antarctic ice sheet wasn't really in play then. And in any case, wouldn't a lower starting point just be another element to put into the same equation?
wili
You might find this talk by Richard Alley interesting. Particularly later in the talk where he discusses the Thwaites Glacier.
Thanks for that link, Glenn.
As I understand it, he's saying that Thwaites could destabilize at any time, and whenever it does, it is most likely to go in a matter of decades, leading to a rather abrupt sea level rise of about a 4 meters in the northern hemisphere. That is pretty shocking. Is that your understanding of the message?
The artic ice caps are increasing. Water levels will stabilize or even get lower over the next 50 years.
What can offset this trend of cooling is volcanic or methane gas leading to greenhouse affects.
I'm particularly concerned with methane gas pockets under the oceans. Slight temperature variations or earthquakes can lead to these "bubbles" releasing into the atmosphere.
Alan_Motorman - What do you mean, the arctic ice caps are increasing? Antarctic land ice is decreasing at ~134 billion tons per year:
[Source]
(see GRACE data up through this year here, only one paper in disagreement, Zwally et al, and there are potential issues with that methodology), Greenland ice decreasing at 287 billion tons per year, Arctic ice is on a steep downward trend (albeit with yearly variations that do not reach statistical significance):
[Source]
There is no way anyone can seriously assert that the ice caps are increasing.
KR @10, you forgot the Antarctic Sea Ice area, which is currently below the 1979-2008 mean:
And global sea ice area which is currently setting a record minimum area in absolute terms, and one of the lowest anomalies on record:
Why leave out the Arctic Sea ice which is also setting a new record every day for lowest sea ice ? Alan Motorman is using last year's denier meme, there is a reason the deniers are not using it this year.
wili
Roughly yes. He did think there was still some uncertainty about whether Thwaites is committed to going, and he also thought that it was possibly a century or 2 before is really ramps up, but then it is a multi-decadal rather than multicentury process for the WAIS.
The description of including the fracture mechanics of high ice-cliffs and how that can drive retreat was fascinating/horrifying. And that including that into the ice models 'solved' the Plioscene was telling.
Like the best discoveries, once the original realisation that a mechanism needs to be included has been made, in hindsight it can seem like 'well, of course'. But in reality those are important advances in understanding.
It is probably one of those things a layman doesn't question when they see that land terminating glaciers taper down to their end while sea terminating glaciers end in ice cliffs. But when you think it through and realise the implications a lightbulb moment happens.
"... a doubling time from a 1mm per year ice sheet contribution to sea level in the decade 2005-2015 would lead to a cumulative 5 meter rise by 2095.""
SLR doubled in 2015 from 4.1mm/year in 2014 to 10mm in 2015. Just sayin'.
sidd
Sounds like this is new findings from including the fracture mechanics of ice cliffs.
Assentially it seems to be saying that an ice edge more than 1000 meters high, so 100 above the water, 900 below, in water 900 meters deep or more is unstable. So a sheet 200, 500, 800 meters thick at it's edge is stable, whether it is floating or not.
The ice in the WAIS is largely over 1000 meters thick then tapers to less than that at places like the Thwaites. So the edge of the Thwaites doesn't suffer from this instability. But if it retreats back into deeper water, where the ice is thicker, it can become unstable.
Gingerb, could you share your source on those figures?
Wili,
Here is a link to the Colorado data.
[PS] Please try again. You cant insert a PDF as an image.
He might be refering to this graph from AVISO Data. If you look only at the data from Jason-2 you get a SLR rate of 4.31 mm/yr. Of course this is a very short time span, so I do not thin it has any significance as of yet.
Thanks, ms and noa. Looking at earlier years, one might assume that this most recent divergence from the linear trend is just that--a temporary blip. But of course, it could be the beginning of a new, steeper linear, or the beginning of an exponential trend. If the latter, the question is what the doubling time will be.
As with many things, we won't know for sure till it's in the rearview mirror.
We are likely to be in a La Nina by year end and even if not, another La Nina will come and with it, a redistribution of water onto land. Just as surely will be deniers cries that "sealevel is falling". It makes no sense to be concerned about short term trends. With his "just saying", I am pretty sure Gingerbaker is aware of that too.