Climate Science Glossary

Term Lookup

Enter a term in the search box to find its definition.

Settings

Use the controls in the far right panel to increase or decrease the number of terms automatically displayed (or to completely turn that feature off).

Term Lookup

Settings


All IPCC definitions taken from Climate Change 2007: The Physical Science Basis. Working Group I Contribution to the Fourth Assessment Report of the Intergovernmental Panel on Climate Change, Annex I, Glossary, pp. 941-954. Cambridge University Press.

Home Arguments Software Resources Comments The Consensus Project Translations About Support

Bluesky Facebook LinkedIn Mastodon MeWe

Twitter YouTube RSS Posts RSS Comments Email Subscribe


Climate's changed before
It's the sun
It's not bad
There is no consensus
It's cooling
Models are unreliable
Temp record is unreliable
Animals and plants can adapt
It hasn't warmed since 1998
Antarctica is gaining ice
View All Arguments...


Username
Password
New? Register here
Forgot your password?

Latest Posts

Archives

Skeptical Science now an iPhone app

Posted on 10 February 2010 by John Cook

Skeptical Science available on Itunes Iphone App Store With Tim Lambert debating Christopher Monckton this Friday, there's been no shortage of debating suggestions. One interesting idea was for audience members to have skepticalscience.com on their mobiles. Coincidentally, Skeptical Science has just become available today as an iPhone or iPod app. The app lets you use an iPhone or iPod to view the entire list of skeptic arguments as well as (more importantly) what the science says on each argument. To download the app, go to http://itunes.com/apps/skepticalscience

How it happened was a few months ago, I was contacted by Shine Technologies, a software development company from Melbourne, Australia. The owners of the company are passionate about climate change and were interested in getting the science from Skeptical Science onto mobile phones. This is a good idea for two reasons. Firstly, because now more than ever it's imperative that the climate debate focuses on science so the more readily available the science, the better. Secondly, well, an iPhone app is pretty cool.

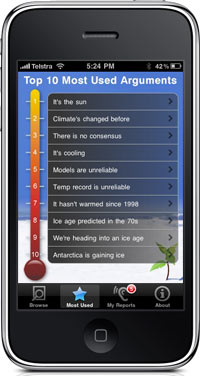
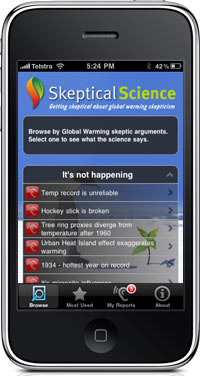
So for the last few months, the boffins at Shine have been developing the app with Apple approving it today. How does it work? You browse arguments via the Top 10 most used arguments as well as 3 main categories ("It's not happening", "It's not us", "It's not bad"):


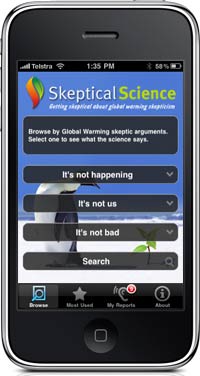
When you select one of the 3 main categories, a list of sub-categories pop up. You can then select any category to see the skeptic argument, a summary of what the science says and the full answer including graphs plus links to papers or other sources.


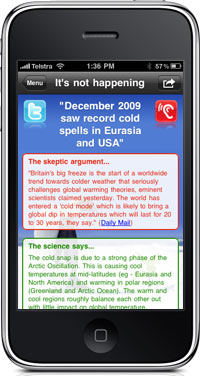
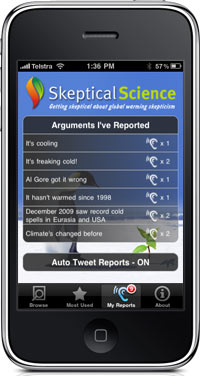
A novel inclusion is a feature that lets you report when you encounter a skeptic argument. By clicking on the red ear icon (above left, shown to the left of the skeptic arguments or above right, next to the headline), the iPhone adds another hit to that particular skeptic argument. At the moment, which arguments you report are only available in a My Reports page, shown below. Shine Tech are hoping to play around with the Reports meta-data in future versions of the app - the phrase "heat-map" gets mentioned often.

So if you have an iPhone or iPod, be sure to download the app and post any feedback or suggestions here. If you have friends with iPhones, be sure to let them know of the app. The more people use the app, hopefully the more versions will be developed in the future with snazzy extra features. If anyone encounters any technical problems with the app, please let me know.

UPDATE 11 Feb 2010: Thanks for the feedback so far (I've passed it onto Shine Tech who I'm sure will be reading this thread also). One other thing I forgot to ask - for those who are able to use the app, please be sure to post a review on iTunes :-)

About Shine Technologies
Shine Technologies is the developer responsible for the Skeptical Science iPhone application. They are a boutique IT consultancy based in Melbourne, Australia with a passion for excellence. They have donated their time to build and maintain the Skeptical Science iPhone application as they believe the science is the key to understanding global warming; and that more people need to have easy access to that science.

0 0

Printable Version  |  Link to this page

Comments

Prev  1  2  3  Next

Comments 51 to 100 out of 133:

  1. Berényi Péter at 16:55 PM on 16 January, 2010 We've got decades of data, each decade brings more signals, more congruence. I'm not sure we disagree about anything, I'm pretty sure if we don't that I will not be able to change your perception. Cheers!
    0 0
  2. What surprises me is how a distinguished scientist like Pielke Sr. can make such trivial statements. Anyone doubts that "global average is not of much use in describing weather that all of us experience"? For sure, the weather people experience in, say, south California is a lot different than the weather in Maine; no need to be a scientist to tell. But then what? Should people act on the basis of the local weather, like more CO2 emission in Maine to warm it a little bit and less in California to cool it down? Switching people attention to local weather means make the world schizoid and unable to take any action.
    0 0
  3. doug_bostrom at 17:23 PM on 16 January, 2010: Post-diction is not the same as pre-diction. No amount of past data can make up the difference. A real world series can be reproduced by simple curve-fitting using only a few parameters if the dataset is given. It is not a matter of perception, it\'s cold fact. However, past data can and should be used to _falsify_ theory if possible. It happens to be the case that the job is already done. Theor Appl Climatol DOI 10.1007/s00704-009-0117-x Trends in middle- and upper-level tropospheric humidity from NCEP reanalysis data Garth Paltridge & Albert Arking & Michael Pook Received: 21 July 2008 / Accepted: 4 February 2009 http://www.theclimatescam.se/wp-content/uploads/2009/03/paltridgearkingpook.pdf 35 years of upper troposphere radiosonde water vapor measurements show a definitive downward trend. It is on a pressure level where the amount of greenhouse gases in the atmosphere really matters for IR radiation can escape from there diretly to space as opposed to sea level from where only a narrow IR window is available to this end, the air being opaque otherwise. In other words this is the very photosphere of Earth. All models based on the assumption of roughly constant relative humidity in the upper troposphere are disqualified. Period. It is as simple as that. We are left with two hard facts. 1. Atmospheric carbon dioxide is increasing 2. Upper troposphere specific humidity is decreasing Unfortunately there is no theoretical explanation as yet. It suggests however, that viable models should show no net long term energy gain at TOA (Top of Atmosphere), ASR (Absorbed Shortwave Radiation) and OLR (Outgoing Longwave Radiation) being in balance due to roughly constant net greenhouse gas contents of photosphere. Satellite ASR measurements are not reliable enough to be able to falsify this hypothesis. Even OLR measurements may have a large systematic error. Balloon radiosonde measurements, as they are routinely used in daily weather forecast practice, are verified. Orders of magnitude more honest work went into data quality control on that area then into the entire field of climete research. The weatherguys\' performance is evaluated on a daily basis. Not only by the general public, but by the Navy, Airforce, civil air traffic control and the like as well. You can see that there is considerable regional variation in upper troposphere specific humidity trends. Recently we have also learned that carbon dioxide is not as well mixed in upper troposphere as previously thought. Pielke is right. Global averages are not too important, their long term trend may even be zero. It does not mean however, that the ocean/atmosphere system (biosphere included) is not trying to adapt to increased CO2 levels. And in doing so it may do funny things.
    0 0
  4. Berényi Péter, you run too fast and you are not allowed to draw "definitive" conclusion from that paper. Indeed, the authors themselves are much more prudent and you will not find your claim in the conclusions. Already from the abstract, the authors warn that "It is accepted that radiosonde-derived humidity data must be treated with great caution" and that "it is important to establish what (if any) aspects of the observed trends survive detailed examination". So, the conclusion is left open, expecially since other data point in the opposite direction. You cannot force the data further and i'd suggest you also leave the conclusions open. At least. _If_ you are interested in climate _science_, i'd also suggest to leave the last paragraph you wrote out of any discussion.
    0 0
  5. "Post-diction is not the same as pre-diction. No amount of past data can make up the difference. A real world series can be reproduced by simple curve-fitting using only a few parameters if the dataset is given." Not what I was talking about, as you well know. I understand it's vital that you avoid talking about actual data and observations, though. "Pielke is right. Global averages are not too important, their long term trend may even be zero." Ah, the meme du jour, repeated everywhere just now. What does it have to do with what you were discussing? As to water vapor in the upper atmosphere, just like you I'm no expert but it sounds like an opportunity to improve models. It also sounds as though something's causing the upper atmosphere to change, if the conclusion of the paper is correct. As to the reason for that change, if you're a doubter be careful what you wish for, it may prove to be more confirmation of something you don't like. "Recently we have also learned that carbon dioxide is not as well mixed in upper troposphere as previously thought." Got a cite on that? As I said, your preconception is no amenable to change.
    0 0
  6. By the way, I should add that Berényi Péter is following what has become a well-worn path among doubters, namely to put all data in doubt. Satellite observations are inconvenient if you're a doubter, so any chance to undermine our confidence in them will be seized, even if only a single publication is available to do that. Same deal as surface temperature records. Data is an inconvenient truth.
    0 0
  7. Berényi Péter To add to Riccardo comments: The radiosonde reanalysis data is very problematic as has been known for long time [*]. Partridge et al are very careful to acknowledge that; they begin their rather equivocal conclusion with the statement (bottom of page 358):
    "It is of course possible that the observed humidity trends from the NCEP data are simply the result of problems with the instrumentation and operation of the global radiosonde network from which the data are derived."
    So your "hard fact" is neither "hard" nor a "fact". It is a hard fact there there is quite a wealth of data from satellites that indicates an increase in upper troposphere water content pretty mucg as expected from enhanced greenhouse induced trospheric warming. See for example: Dessler, A. E., Z. Zhang, and P. Yang (2008), Water-vapor climate feedback inferred from climate fluctuations, 2003–2008 Geophys. Res. Lett., 35, L20704 (Riccardo linked to this paper in his post just above) Gettelman A and Fu, Q. (2008) Observed and simulated upper-tropospheric water vapor feedback J. Climate 21, 3282-3289 http://www.atmos.washington.edu/~qfu/Publications/jc.gettelman.2008.pdf Buehler SA (2008) An upper tropospheric humidity data set from operational satellite microwave data J. Geophys. Res. 113, art #D14110 http://www.agu.org/pubs/crossref/2008/2007JD009314.shtml Brogniez H and Pierrehumbert RT (2007) Intercomparison of tropical tropospheric humidity in GCMs with AMSU-B water vapor data. Geophys. Res. Lett. 34, art #L17912 http://www.agu.org/pubs/crossref/2007/2006GL029118.shtml Santer BD et al. (2007) Identification of human-induced changes in atmospheric moisture content. Proc. Natl. Acad. Sci. USA 104, 15248-15253 http://www.cccma.ec.gc.ca/papers/ngillett/PDFS/15248.pdf [*] Soden BJ, et al (2005) The radiative signature of upper tropospheric moistening Science 310, 841-844. http://www.gfy.ku.dk/~kaas/forc&feedb2008/Articles/Soden.pdf who state:
    “Although an international network of weather balloons has carried water vapor sensors for more than half a century, changes in instrumentation and poor calibration make such sensors unsuitable for detecting trends in upper tropospheric water vapor (27). Similarly, global reanalysis products also suffer from spurious variability and trends related to changes in data quality and data coverage (24)."
    etc. etc.
    0 0
  8. Riccardo, the data ARE definitive. Paltridge at al. may use a cautious language (otherwise they would risk rejection due to politically motivated peer review). But the long term decrease of specific humidity at higher levels is pronounced and can't possibly explained away. Their claim "increases in total column water vapor in response to global warming do not necessarily indicate positive water vapor feedback, since very small decreases of water vapor in the mid-to-upper troposphere can negate the effect of large increases in the boundary layer" is based on sound physical principles. Except it is far from being sure that decrease in upper troposphere moisture is caused by "global warming" as such. It may be a more direct effect of increasing carbon dioxide levels. Satellite measurements of the same trend are unreliable. It is easy to see why. They are trying to detect minuscule changes against an increasing lower troposphere background humidity signal from far away. In cases like this, one would prefere in situ measurements. The Dessler at al. paper you cite speaks about short term feedback. That's a completely different beast. Paltridge at al. also discusses this question. Finally I don't think the norm in climate science should be any different from those of other sciences. It's truth, plain old truth. doug_bostrom: "I understand it's vital that you avoid talking about actual data and observations" I do understand that you don't understand I'm talking about actual data and observations right now. "be careful what you wish for, it may prove to be more confirmation of something you don't like" I wish for truth, not memes. If it's something I would not like, that's it. Wishes, fears, politics should be left to the general public. There is no other way to do science. "Got a cite on that?" Tons ARIS CO2 maps at the NASA site. NASA ARIS Mid-Tropospheric (8 km) Carbon Dioxide July 2003 http://photojournal.jpl.nasa.gov/jpegMod/PIA09269_modest.jpg "your preconception is no amenable to change" My preconception is that philosophia naturalis should proceed by validating theory agains measurement. This preconception is not amenable indeed. Theoretically motivated dismissal of huge bodies of actual data is not the way to go. "Satellite observations are inconvenient if you're a doubter, so any chance to undermine our confidence in them will be seized" You get it wrong. I was talking about specific satellite measurements and I was not trying to "undermine your confidence in them". I have nothing agains satellites per se. But when the systematic error and/or the error bars are larger than the values to be measured, the measurement is useless, even if it cost a lot of money. You don't have to have any "confidence" in data. You should just understand the exact measurement process and confide in your own understanding. If you do that, it can't be "undermined". Data is an inconvenient(?) truth, agreed.
    0 0
  9. chris at 07:28 AM on 17 January, 2010: Let's have a closer look at the logic of e.g. Soden at al 2005. "Here we use climate model simulations and satellite measurements to demonstrate the presence of a distinct radiative signature of upper troposphere moistening on interannual to decadal time scales" They use both climate model simulations and satellite measurements. So far so good. If satellite measurements do show increased upper troposphere specific humidity and the model predicts the same, then it survived, it is not falsified by this particular measurement. "The observed moistening is consistent with model simulations and correspond approximately to a constant relative humidity increase in upper tropospheric moisture" This is already slightly off the mark. There is NO observed moistening so far. How could it be consistent with anything? "We further demonstrate that without such an increase, the model would be unable to reproduce the satellite-observed radiance record" That's it. There must be an increase, for without it, the model would be unable to reproduce observation. Observation of what? Radiance. Mark me. Not upper troposphere specific humidity, but satellite observed radiance record. Suppose for a moment, just for the sake of argument, that the model is crap. In this case if it is unable to do something it does not demonstrate anything aside from the fact it was crap in the first place. If it has no relation to the real world, it is not surprising that it could not reproduce real world measurements. On the other hand, if we go with model prediction and allow it to increase upper troposhere moisture as it was programmed to do anyway and by this it mimics the satellite observed radiance record, it only means that we have found a rather complicated and expensive way to fit curves. Let's put it another way. If radiance is measured and there is no other way to derive specific humidity values form these measurements than through the model to be verified, then the specific humidity trend produced this way can not be used to verify the model. The two things are not independent. Suppose someone constructed a model with no upper troposphere specific humidity increase which could reproduce the same radiation signature. Would it prove anything about specific humidity trends in the upper troposphere? No. It would only demonstrate that Soden's logic is flawed, what we know anyway. Circular logic is wrong, because it is circular.
    0 0
  10. Not really Berenyi Peter! a. One can hardly assert that the Partridge results are "definitive", when the authors themselves state that they are not:
    "It is of course possible that the observed humidity trends from the NCEP data are simply the result of problems with the instrumentation and operation of the global radiosonde network from which the data are derived."
    b. Your appraisal of Soden et al (2005) isn't correct. Soden et al use the High Resolution Radiometer Sounder (HIRS) to measure upper tropospheric radiance in the 6.3 micrometre water vapour band. So they are measuring water vapour, if indirectly, just like any spectroscopic measurement. They use two methods to determine their "signature" of upper tropospheric moistening. (i) Their detector (T12) is sensitive to changes in relative humidity. Since they don't detect a change over the period (1979-2004) they conclude that the relative humidity hasn't changed. Since the upper troposphere has unequivocably warmed during this period, the absolute humidity must have risen. (ii) Soden et al also obtained a signature of upper tropospheric moistening by comparison of the MSU T2 and the HIRS T12 radiances. The emission level for T12 increases with increased water vapour; that of MSU T2 is sensitive to changes in oxygen (which doesn't change significantly in a warming, moistening atmosphere). Thus in a moistening atmosphere the brightness difference (T2-T12) should increase with time. That's observed. These qualititive signatures of upper tropospheric moistening were quantitated by comparison with models. But the signatures of upper tropospheric moistening were spectroscopic measures atmospheric water vapour (in the manner that one generally uses spectroscopy to measure molecular composition/concentrations etc.). And these "early" observations have been reinforced by the subsequent work describing increased tropospheric humidity in a warming world I cited (and Riccardo linked to). c. Atmospheric CO2 mixing. Not sure what significance you ascribe to that. On annually-averaged timescales atmospheric CO2 is well mixed to the extent that it makes no real difference to radiative forcing. For example one could compare the ARIS picture you linked to, to the Mauna Loa data (or ocean surface averaged CO2 data) here: http://www.esrl.noaa.gov/gmd/ccgg/trends/ ...and find that at Mauna Loa the July 2003 CO2 concentration was 376 ppm (pretty much as in the picture you linked to); the sea surface averaged CO2 level was around 374-5 ppm and so on. We all know that the production of CO2 from plants and humankind has regional origins and this is bound to be represented as small variations in distribution in temporal "snapshots". So we don't expect to see instantaneously mixed CO2. But yearly averaged CO2 concentrations are pretty similar wherever these are sampled around the globe...
    0 0
  11. Berényi Péter at 09:26 AM on 17 January, 2010 Thanks for your point-by-point response. The CO2 mixing problem you refer to indicates a inhomogeneity of C02 that is trivial compared to the gross amount of anthropogenic addition. I'm sure you realize that. In fact, given your lack of confidence in satellite observations, I'm surprised you do not dismiss it. However, you fail to address the central challenge for doubters, also my original point, which is that you need to replicate (for instance) your examination and critique of satellite data versus radiosonde data for a plethora of observations in other fields in order to dismiss what appears to be a coherent composite signal providing a good fit with anticipated changes driven by AGW. This is going to be a major challenge. Again, using your present example, you've found a single paper that you believe invalidates satellite measurements of atmospheric constituents. Many other findings are in contradiction to this paper. A compelling argument against so many other results is going to require a much more robust body of evidence. If that should be the outcome in this case, you're going to need to do the same thing in a number of other arenas. For example, what about Antarctic ice loss as measured by the GRACE instrumentation? You'll need to develop a coherent explanation for how that might be in error. You could work that from a PGR angle, somebody ought to better resolve that issue, but as it stands now GRACE measurements of Antarctic mass are another result that at present appears to validate predictions arising from models of AGW. Again, multiple investigators have found the same general result from GRACE data. There are numerous other examples, I'm sure you realize that.
    0 0
  12. Berényi Péter, "the data ARE definitive. Paltridge at al. may use a cautious language (otherwise they would risk rejection due to politically motivated peer review)." Don't talk about truth when there's such a clear and explicit political bias. This presupposition undermines what you say next. Why should i take your words and not those of the authors themselves? You do not give any reason at all to go beyond the warnig given in the abstract. Satellite data have issues, radiosonde too; research is going on. Scientists try to overcome the difficulties with more data and more analysis and this is science. Paltridge et al. did science, you did not, not a single tiny reason why one should not be cautious with radiosonde data. And that's why you are left with a declaration of belief like "the data ARE definitive".
    0 0
  13. I've seen at least one paper which suggests that the correlation between solar activity & the global temperature anomaly has been low (approx. 35%) since 1950, with a further drop in correlation (approx. 22%) for the period of 1980-2000). Yet for the period of 1900-1950, the correlation between solar activity & the global temperature anomaly was a whopping 75%! For a correlation to drop so much, in such a relatively short space of time, would require some kind of very rapid change in some other component of global climate-any guesses which one (btw, the correlation between CO2 & the global temperature anomaly, for the period after 1950, is around 78%. In the absence of direct measurements, pre-1950, it's hard to do a good correlation for the period of 1900-1950. However, given the almost static CO2 levels in the ice cores which cover that period, I'd suggest the correlation would have been close to *zero*. Again, such a massive change in correlation in such a short space of time!)
    0 0
  14. guys, it is indeed possible that sixty years of radiosonde data are crap. Even the air can go into one corner of the room any time leaving me in vacuum. It is possible, even if unlikely. I could compute its probability. Considering the immediate usefulness of moisture data, it is also unlikely that radiosondes measured naught. It almost falls into the "if I had three legs it would not pass unnoticed" category. It is even more unlikely that the undetected systematic error has a consistent downward trend over such a long timespan. However, all is not lost. If in doubt one can go back, build a replica of each moisture sensor used (goldbeater's skin, rolled hair, carbon hygristor or capacitive sensors), go to the lab and test their relative humidity response, temperature dependent time lag and all the other relevant features. The old instruments can even be tested in situ for any unkonw source of bias like UV radiation, aerosols or whatever. It is a calibration job that does not even require a climate scientist. In fact there are better educated folks to do such a job. I understand that some of the recalibration is already done in the NCEP dataset (i.e. correction for decreasing response time), but the downward trend still remains. Believe me, the old folks were neither fools nor lazy bastards. If they used an instrument, it did measure what it was supposed to. They checked it and re-checked it. There might be some caveats, but it is all documented, meticulously. A serious re-evaluation of upper troposphere radiosonde humidity measurements should be the highest priority job right now, just as Paltridge et al suggest. This dataset does not depend on any atmospheric model, the corrections, if any, should come from entirely different souces. The same can not be said about satellite measurements of upper troposphere moisture. The incoming radiation is a complex function of vieving angle and pressure, temperature and relative humidity values along an entire (possibly oblique) column of air. The inverse transformation is impossible without some model of the supposed vertical and horizontal distribution of these parameters. Moreover, clouds make it next to impossible to do the calculations. At the same time most of the weather is about clouds (Is it sunny? rainy?). I do not think the downward trend can be calibrated away as apparently Paltrige does not believe it either. He just dares not make this statement directly. Otherwise he would be accused of a "clear and explicit political bias". I can tolerate it for I'm not running for grant money, his case might be different.
    0 0
  15. I do also love how those that are so quick to denigrate surface-based temperature measurements (because they don't say what they'd like them to say) are so quick to elevate radiosonde to almost exalted status-even though the same "issues" might apply. The difference is that, whilst ground-based & satellite based temperature readings are in close agreement, the radiosonde & satellite based measurements of humidity are *not* in agreement-at least as far as I can tell. Berényi Péter willingness to accept a single paper, based on what could be dubious data, says a great deal about his own political bias, IMHO.
    0 0
  16. It's interesting to note a peak in the solar cycle graph (a solar cycle minimum length) about a decade before the peak in temperatures around 1940. Is there any connection? The 1940 temperature peak (which from reading this site I seem to remember is not well explained by known forcings or the models) is sometimes ascribed to an artefact of changes in the method of temperature measurement in the 40's. The minimum solar cycle length in the 30's doesn't show up in the TSI reconstruction as a peak. Is the slightly delayed correlation just coincidence?
    0 0
  17. Donald Exactly. This article brought to mind the same question. That is, whether climate scientists include hysteresis in their models.
    0 0
  18. Actually, they do, but only for effects of CO2.
    0 0
  19. The models presumably include the solar forcing in W/m^2 from the TSI reconstruction- solar cycle length is just a proxy. Average TSI peaks in about 1960. Although there is yearly variation, there is not the same delayed correlation with the 1940's temperature peak, so the question of lag in the models doesn't seem to be relevant. http://www.skepticalscience.com/solar-activity-sunspots-global-warming.htm
    0 0
  20. Berényi Péter, "Anyone, who cares for climate models should welcome an opportunity to verify them against independent data sources." This time i fully agree with you. I'm not the only one, many scientists around the world are still working on this issue; they try to improve new measurements and to correct and homogenize old data. You will easily find a lot of papers on the dry bias and possible recalibration of radiosonde data. No one will throw those data away for sure. I'm not going to call a reality check surfacestation.org for two main reasons. First, the very idea of that site is that scientists are not aware of the urban heat island effect and the site change/alteration issues. It's not true; indeed, as people behind surfacestation well knows, there are a lot of ongoing adjustments of the raw data (which, though, they don't like). Second, in a unusual consideration of non-scientific issues, the NOAA analysed the data of just the "good" stations and found almost no difference. The whole story turned out to be a strong and surely independent confirmation of the quality of their dataset and analysis. I'm just sorry for the hundreds of people sent around the US taking pictures following a false hope.
    0 0
  21. greenman3610 has a new video on the recent cold weather and its difference from climate.
    0 0
    Response: I've added this to the skeptic argument "December 2009 saw record cold spells in Eurasia and USA".
  22. RealClimate has a new post titled 2009 temperatures by Jim Hansen, subtitled "If It's That Warm, How Come It's So Damned Cold?"
    0 0
  23. Is there any connection between Solar Cycle LENGHT and Total Solar IRRADIANCE? If yes, what is the link between them?
    0 0
    Response: When the sun is showing a long term warming trend, the solar cycle tends to get faster. Conversely, when the sun is cooling, the solar cycle slows. This is why the solar cycle 24 is taking so long to get started at the moment - because the sun is cooling at the moment. Why this is so, I leave as an exercise for the reader :-)
  24. This exercise has not been solved for many decades. I don't think is going to be solved any time soon even by solar physicists, let alone we readers :)
    0 0
  25. John Cook: In the comment to the previous post, I said: "The Early XX Century Warming(+0,5ºC) peaked at about the same time than WWII(around 1940), then a slight cooling of about -0,1ºC followed until about 10 years when temperatures stayed nearly constant between 1955 and 1975. The Sun Activity instead continued to incrase until mid-1950s, when it began a slow decline. Remarcable is that temperatures peaked BEFORE Solar Activity (a whole solar 11-year cycle indeed!). This seem inconsistent with the hypothesis that the Sun is the main responsible of the Early 20th Century warming." Then I talked about the Aerosol Forcing hypothesis(sulfates,black carbon...), and concluded with the question: "Has anyone compared the Sulfate vs. Black Carbon emissions making timeseries-graphs like the one presented here? (I referred to the TSI vs. GISS Temperatures in the previous post) That will do a good to determine which forcing (Solar or Aerosols) had the greatest impact." John Cook, I am still waiting for your response.
    0 0
    Response: The estimated radiative forcing from sulfates and black carbon are available for download from the NASA GISS website. Please feel free to make a time series graph (and if you do, let us know what you find).

    Line plot of showing separate radiative forcings, 1880-2003
  26. John Cook: Thank you (and Hansen, obviously) for the graph! To you and to readers: What forcing do you think(personally) could explain better the Early 20th Century (1910s-1040s) Warming? a)The Sun b)Aerosols (Black Carbon + Sulfate)
    0 0
  27. Well, this is my previous comment, in graphical mode: First the Various Forcings from NASA GISS, showed the solar forcing: Then the TOTAL FORCINGS: So 0,3 W/m^2 were NOT from the Sun. They were from Aerosol + GHG. (note:all numbers approximated from reading the graph)
    0 0
  28. Oopps. The graphs were not pasted. How can I post graphs, or any kind of figure? In the graphs, my numbers were: Total Forcing (1950s): 0,5 W/m^2 Solar Forcing (1950s): 0,2 W/m^2 Residual (1950s): 0,3 W/m^2 This is aerosol + Greenhouse gases + Land use change. The analysis forcing-by-forcing for tomorrow. Stay tuned.(please help with the graphics)
    0 0
  29. Riccardo at 22:56 PM on 17 January, 2010: "You will easily find a lot of papers on the dry bias and possible recalibration of radiosonde data" No, not easily. I have fond something though. INSTRUMENTS AND OBSERVING METHODS REPORT No. 85 WMO RADIOSONDE HUMIDITY SENSOR INTERCOMPARISON PHASE I: Laboratory Test Central Aerological Observatory Dolgoprudny, Russian Federation June 1995 - June 1997 A. Balagurov, A. Kats, N. Krestyannikova (Russian Federation) PHASE II: Field Test NASA Wallops Flight Facility Virginia, United States 8 - 26 September 1995 F. Schmidlin (United States) WMO/TD-No. 1305 2006 http://www.wmo.int/pages/prog/www/IMOP/publications/IOM-85_RSO-RH-Phase_I-II/IOM-85_RsoHumiditySensors_Phase-I-II.pdf The analysis is thorough. And it was performed in 1995-97. More than ten years ago. I don't quite understand why was it published only in 2006. It should be enough to do the instrument recalibration job up to the 300 hPa level, verifying the long term humidity trend up there this way. I can see the NCEP/NCAR Reanalysis is going on. http://www.cgd.ucar.edu/cas/guide/Data/ncep-ncar_reanalysis.html However, I was not able to find reference to the WMO Radiosonde Humidity Sensor Intercomparision, which would be an absolute must. It may be my fault, a briefing would be welcome. So the NCEP reanalysis dataset is either uncorrected for known instrumental biases or Paltridge, Arking & Pook have revealed a gaping hole in current theory which is based on constant RH above 850 hPa. In the first case your statement "many scientists around the world are still working on this issue" lacks credibility. A job like this taking more than ten years to be done properly is flagrancy itself. Otherwise the average climate model is falsified. Water vapor feedback in terrestrial photosphere is negative. It is as simple as that. As for surfacestations.org. You know full well the quality of individual stations (or the lack of it) is not documented nearly as well in reanalysis studies as by those volunteers. One would wish for such a check on a global scale. http://www.ncdc.noaa.gov/crn/ "The vision of the USCRN program is to maintain a sustainable high-quality climate observation network that 50 years from now can with the highest degree of confidence answer the question: How has the climate of the nation changed over the past 50 years?" "Fifty years from now". Rather forty three in 2010, as the US Climate Reference Network (with some long term quality control) was started in 2003. Need say more? Surfacestations is checking USHCN (United States Historical Climatology Network), which is an entirely different beast. http://www.ncdc.noaa.gov/oa/climate/research/ushcn/ushcn.html NCDC guys are cross-checking neighboring station data, read (incomplete) station history files and do all kinds of statistical tricks, but no one goes there to have a look for the sake of good old reality check.
    0 0
  30. Berényi Péter, the WMO intercomparison pubblication you quote is a lab test of different sensors, not field data. It assess the difficulties of the humidity readings even in controlled conditions and still you get large variabilities especially at low temperatures. When you actually fly a baloon there's much more than that. I don't want to mean that we have to discard radiosonde data, they are a piece of the puzzle. But given the large uncertainties, the small trend (a few percent) and the disagreement with satellite data, I (with Paltridge et al.) would not draw any strong conclusion, let alone claims like "Water vapor feedback in terrestrial photosphere is negative. It is as simple as that."
    0 0
  31. Listen. If instrument quality is in doubt, the first thing a sane person does is to check the instruments themselves (as opposed to the arcane statistical properties of datasets collected by these instruments). The WMO intercomparision did exactly that. First in the lab, then there was also an extensive field test involving balloons. The important lesson learned is NOT "you get large variabilities". It is the exact nature of the variability that counts. They have found that below the 300 hPa level (for sure below 400 hPa) the humidity response of each instrument was consistently monotonic with a low enough random noise. Not necessarily linear, but monotonic. The large (up to 10%) variability was observed between different instrument types, not in the performance of a single instrument. The other issue was the different and temperaure dependent relaxation times of various types of instruments. But it was measured, documented and it is also deterministic. Now, if you have the description of instrument behaviour for each type along with time stamps, pressure and temperature data (even better to have the values for both ascent and descent), these errors are easy to eliminate. One does not even have to be a climate scientist to do that. I myself could perform the correction. I just do not know if the job was done or not. If it was done, there still remains some uncertainity. You have reffered to it as "when you actually fly a baloon there's much more than that". Actually not much more. There may be solar radiation acting on the case, water or ice can get inside due to precipitation and/or condensation, finally some random noise which is always present in any measurement. However, all these combined have much less effect than the difference between instrument classes, certainly less than the magnitude of the three decade trend. Moreover, these effects can not possibly have a definite trend over a multi decadal time scale. When I have drawn my conclusion, I assumed the trivial recalibration job I have described above is already done. If it is not, now, that's travesty.
    0 0
  32. Riccardo at 06:21 AM on 17 January, 2010: "the authors themselves are much more prudent" The Paltridge paper was submitted to the Journal of Climate in March 2008. Prudent or not, it was rejected on plainly _political_ grounds. It got published almost a year later in February 2009 by Theoretical and Applied Climatology.
    0 0
  33. Berényi Péter, i would leave political comments out and think of the scientific weakness of Paltridge paper instead. In 2005, well before Paltridge et al. paper, a much more extensive analysis of water vapour datasets had been published; Trenberth at. al 2005 compared four different reanalisys (two versions of NCEP, NVAP and ERA-40) and SSM/1 satellite data. Although they considered the total integrated water vapour column, the problems with both NCEP and NVAP were clearly noticed. Paltridge et al. didn't even refer to Trenberth et al. work; honestly, i'm not that surprised that it has been rejected on J. Clim. This does not mean that those datasets should be thrown away, but the caution in using them is required, for _scientific_ reasons.
    0 0
  34. re #70/71; Peter your arguments are not very pertinent to the matter at hand. There are a couple of "bottom line" conclusions that we can make. (i) There's no question that it is accepted that radiosonde data on high altitude temperature and humidity are not sufficiently accurate as they stand to make strong conclusions about the validity of expected/simulated parameters in the upper troposphere. (ii) That's simply a fact of life. The radiosondes were not designed for high precision measurements of the sort that are required to address long term trends in upper tropospheric parameters; they were designed to supply networks for numerical prediction of weather. (iii) The very paper that you've brought to our attention here incorporates this essential proviso that the data may well be a result of "problems with the instrumentation and operation of the global radiosonde network". It's not obvious why you choose to pretend that this proviso is not an important part of Paltridge's paper. (iv) None of this is a reflection on the excellent work that those involved in the radiosonde network for atmospheric analysis and weather prediction have put in over the years. Unfortunately, the requirement for rather more detailed analysis of upper tropospheric parameters is not met by the radiosonde network, particularly as it existed in the earlier decades required for establishing longer term trends. (v) In the meantime the requirement for detailed analysis of the upper tropsophere is being met through the use of satellites carrying instrumentation designed for determining (amongst other things) upper tropospheric humidity and temperature. In general these data are rather consistent with expectations from enhanced greenhouse warming in terms of upper tropospheric temperatures and humidty. (vi) We certainly don't know the whole story yet. However it would be foolish to attempt to reconcile expectations/predictions from theoretical understanding/simulations with radiosonde data on upper tropospheric humidity, when there is a significant question about the accuracy of the radiosonde measurements. (vii) In the meantime a recent very detailed analysis of radiosonde data indicates that tropospheric humidity has increased much as expected from models [*]. That’s not the whole story either. However I’m inclined to consider the large number of studies on tropospheric water vapour trends from radiosonde reanalysis and satellite measures that show tropospheric water vapour increasing much as expected from theoretical understanding of the response to atmospheric warming, over a single weak paper which restates what everyone already knows, and that carries the repeated proviso that the results presented may be a result of "problems with the instrumentation and operation of the global radiosonde network". At the very least the null hypothesis that tropospheric water vapour concentrations are increasing as expected from our understanding of the response to tropospheric warming, isn’t disproven by the single weak analysis you brought to our attention. [*] M. P. McCarthy et al. (2009) An Analysis of Tropospheric Humidity Trends from Radiosondes Journal of Climate 22, 5820-5838 http://ams.allenpress.com/perlserv/?request=get-abstract&doi=10.1175%2F2009JCLI2879.1
    0 0
  35. chris, the McCarthy at al. paper is outrageous. One simply does not use such a convoluted series of ad hoc data "enhancement" techniques. Never. It is horrible, worse than guesswork. http://findarticles.com/p/articles/mi_7598/is_20091115/ai_n42654412/?tag=content;col1 The first thing to do, as I have already mentioned, is to identify the instrument type used for each measurement, then correct for deterministic errors using experimentally established instrument profiles. It is a plain engineering job, it has nothing to do with climate science. All else comes later. However, McCarthy et al. are trying to do it the other way around. With a flawed method like this one cannot even reject the underlying null hypothesis that planetary constellations determine human fate. "(v) In the meantime the requirement for detailed analysis of the upper tropsophere is being met through the use of satellites carrying instrumentation designed for determining (amongst other things) upper tropospheric humidity and temperature." No, they were not designed to do that. Satellites detect IR radiation in certain narrow frequency bands. One can apply an inverse transformation to get upper troposphere RH and temperature values from these measurements, but only relative to a fairly detailed atmospheric model. The values themselves depend both on model and the radiation measured. The particular radiation transfer model used is also crucial. Even with these caveats the vertical resolution is rather poor and error bars are huge due to the much larger lower troposphere specific humidity background. It fails completely if clouds are present. Riccardo, Trenberth at. al 2005 consider the total integrated water vapor column indeed, which has no relation to the radiation balance at TOA. It is upper troposphere moisture we are talking about, a tiny portion of total integrated water vapor column, but this is the level where thermal radiation emitted by vapor has a chance to escape to space. Of course they discuss radiosonde relative humidity measurement problems, but only vaguely. They refer to problems with satellites as well. I would also rather leave political comments out and concentrate on the scientific contents if it were possible. It is not. An anonymous referee of the Journal of Climate on the Paltridge paper: "the only object I can see for this paper is for the authors to get something in the peer-reviewed literature which the ignorant can cite as supporting lower climate sensitivity than the standard IPCC range". It is unbelievable. I know of no other branch of science where peer review is allowed to venture this far. Alas, this particular guy was not disqualified by the editor.
    0 0
  36. Berényi Péter, the intercomparison between the various reanalisys in Trenberth et al. shows which is more reliable; Paltridge et al. failed to notice it. But the point is not even this. It is that due the unreliability of radiosonde data no strong conclusions can be draw, as you (not Paltridge) are trying to do. You surely read what Paltridge wrote on Climate Audit; there was no political bias to force him to state that radiosonde data are not reliable, but he confirmed. This leaves no room to your (arbitrary) hypothesis that he was forced to write so to pass a biased peer review. Your idea on how reanalysis work is really trivial. You are assuming that we now know for all the stations, all the flights, all the instruments and all the sensors the influences of an uncontrolled ambient on the measurements, which is clearly not true. It should not be so hard to see given that we have several different and contrasting reanalysis and people working on it for decades. Were it so simple as you say anyone could have done it.
    0 0
  37. Given the good correlation upto 1975 do we conclude that solar was the dominant factor controlling change in global temp for the first 3/4 of the century?
    0 0
  38. Yet the radiative forcing graph in your response to post #8 would suggest that GISS think solar has remained almost unchanged in it effect for the whole of the century. All the quote from the paapers you mention, including Lassen 1999, suggest solar can only be ruled out for the most recent warming period.
    0 0
  39. Riccardo, working on a problem for decades is not the same as getting the easy (and most important) part of the job done ASAP. I am not even talking about a full scale reanalysis as it is undersood in "climate science" circles (the one involving extensive statistical data kneading), but straightforward correction for known and deterministic instrumental biases. I am not implying it would be a low budget operation. But it is easy indeed as a scientific endeavor. One does not have to bother with hypothetic climate/atmospheric models and the like, just simple instruments and raw data. Proper collection of metadata, reconstruction of devices and testing their response to varying pressure, temperature, moisture and radiation histories costs money, but does not require much ingenuity. Just plain old honest work. I am surprised beyond imagination that this issue is not pushed much more forcefully. In fact it seems no one has got grant money to do it. Of course there is a danger the results could turn out "supporting lower climate sensitivity than the standard IPCC range". Come to think of it, could be rather difficult to get a grant for this purpose with opinionated referees around. Considering it is THE experimentum crucis for the present climate modelling paradigm, everyone involved should welcome such an opportunity, not suppress it. Just imagine Albert Einstein trying to prevent Sir Arthur Stanley Eddington to get to Príncipe in time to capture full eclipse by "saying people are working on eclipses for millenia, so why the rush". No one doubts the lower troposphere is getting wetter nor older instruments tending to have a longer relaxation time at low temperatures. But I would not bet on correcting for relaxation time bias could charm away the decreasing specific humidity trend measured by radiosondes up there, for this trend is also observable at the 700 hPa level, where all instruments behave reasonably well, even the ancient ones. Also, the ongoing loss of high altitude glacier mass is more consistent with decreasing relative humidity at that level than with a constant one.
    0 0
  40. "Response: When the sun is showing a long term warming trend, the solar cycle tends to get faster. Conversely, when the sun is cooling, the solar cycle slows. This is why the solar cycle 24 is taking so long to get started at the moment - because the sun is cooling at the moment. Why this is so, I leave as an exercise for the reader :-)" Isn't wrong to describe the sun as cooling or warming? We are surely dealing with surface immittance and not total energy content by unit.
    0 0
  41. re #12,13 Yes, the solar scientists that analyze solar output in detail have determined that solar contributions to 20th century warming are rather small overall. Several recent analyses indicate a solar contribution to total 20th century warming of the order of 10%, with none of this in the period of late 20th century and contemporary warming [*]. So solar contributions made a small contribution to early-mid 20th century warming. A significant proportion of the warming in the period to the mid 20th century warming was likely the recovery from very high volcanic activity in the late 19th, early 20th century [*;** ; ***]. There was obviously a contribution from anthropogenic greenhouse gases [*; **; ***; ****], and perhaps a small contribution from ocean circulation effects [****]. Obviously the attribution of 20th century warming requires an assessment and incorporation of all of these contributions as is done in the papers below marked [*] and [***]. [*] C. M. Ammann et al. (2007) Solar influence on climate during the past millennium: Results from transient simulations with the NCAR Climate System Model Proc. Natl. Acad. Sci. USA 104, 3713-3718 http://www.pnas.org/content/104/10/3713.abstract Lean, J. L., and D. H. Rind (2008), How natural and anthropogenic influences alter global and regional surface temperatures: 1889 to 2006 Geophys. Res. Lett., 35, L18701 http://www.atmosp.physics.utoronto.ca/~jclub/journalclub_files/LeanGRL2008.pdf R.E. Benestad and G. A. Schmidt (2009) Solar trends and global warming J. Geophys. Res. 114, D14101 http://europa.agu.org:8005/?view=article&uri=/journals/jd/jd0914/2008JD011639/2008JD011639.xml&t=2009,Benestad [**] Mann M.E. (2007) Climate over the past two millennia Annu. Rev. Earth Planet. Sci. 35, 111-136 http://arjournals.annualreviews.org/doi/abs/10.1146/annurev.earth.35.031306.140042 [***] Hansen, J. et al. (2005) Earth’s Energy Imbalance: Confirmation and Implications Science 308, 1431-1435 http://pubs.giss.nasa.gov/docs/2005/2005_Hansen_etal_1.pdf [****] Swanson K.L. et. al. (2009) Long-term natural variability and 20th century climate change Proc. Natl. Acad. Sci. USA 106, 16120-16123 http://www.pnas.org/content/106/38/16120.abstract?sid=a5bc499d-5e20-48cc-97ae-8e54afbebb8e
    0 0
  42. Just to add more to your list Chris. From the diagram posted by John in response to post #8, GISS seem to give solar almost 0 net change in radiative forcing over the whole of the century. Suggesting solar has had almost no net effect on global warming for the whole of the 20th century. John's Damon 1999 paper suggest 25% in 1980 and 15% in 1997. These are surely mutually exclusive.
    0 0
  43. Are they so different, HR? The Hansen et al analysis (see pdf in my post #15; it's the same data that John uses in his response in post #8) gives a solar contribution that is around 8% of the greenhouse forcing. Damon's 1999 analysis yields 15% (contribution of solar cycle length to total warming) through the 20th century (up to 1997). These values are not that different, and a number of analyses using up to date estimation of the change of solar irradiance, puts the solar contribution around 10%...these all seem to be reasonably self-consistent. One has to be careful with Damon's analysis. He wasn't particularly determining the solar contribution to warming. He was really addressing an analysis of Friis-Christensen and Lassen which purported to show that apparent correlations between solar cycle length and climate indicated that the solar contribution was 100%. Damon was pointing out that the F-C/L analysis wasn't done correctly and if it were, the solar cycle contribution would be 15% through 1997. However there isn't much evidence I think that the solar cycle length is a very good proxy for solar output, and there isn't a good theoretical basis for this relationship; far better to use a well-characterized analysis of solar irradiance, either by direct measurement, or by analysis of the solar cycle/sunspot measure for periods before direct monitoring of irradiance.
    0 0
  44. A slight of hand appears to occur in the Hansen paper. Total net forcing 1880-2003 = 1.85Wm-1 delta T 1880-2003 = 0.6oC but 1Wm-1 should give delta T of 0.6oC so where is the delta T from the remain 0.85wm-1 of net radiative forcing? Oh yeah it's "in the pipeline". Three words can dismiss the fact that close to half the delta T is so far unaccounted for. I guess there is a suggestion of a lag here but no attempt to justify it. In fact when you look at the cooling caused by volcano's and the subsequent recovery after aerosols are removed there appears to be no lag in delta T to radiative forcing.
    0 0
    Response: Actually, volcanic eruptions are a good example of climate lag and how "warming in the pipeline" works. Note the comparison between radiative forcing and global temperature over the 20th Century:


    The big downward spikes in net forcing are due to volcanic eruptions. Why doesn't temperature fall the same amount? Because of the great thermal inertia of the oceans. What happens is a volcano erupts, throwing up sulfate aerosols into the atmosphere. This immediately creates an energy imbalance - suddenly less sunlight is getting in. So the planet starts to cool.

    Note - the atmosphere responds relatively quickly. But it takes time for the oceans to cool - this is what you would call "cooling in the pipeline". However, and fortunately for us, the aerosols wash out of the atmosphere within a few years and the energy imbalance bounces back to what it was before. But if for some reason, the aerosols stayed in the atmosphere, what we would observe is the planet cooling over a few decades until the climate reached equilbrium.
  45. But the fall and rise after volcanos is concomitant with the fall and rise in radiative forcing even though the delta T spike is smaller. A lag would suggest at the very least a slower recovery in delta T. Another example is the period 1910-1940. A relatively modest increase in radiative forcing (compared with present times) yet no apparent lag. In fact the rise of ~0.5oC in delta T occurs alongside the smooth rise (no volcano's) in radiative forcing. 1910-1940 RF increase ~0.5, delta T 0.5oC 1980-2003 RF increase ~2, delta T 0.6-0.7oC The numbers don't seem to add up.
    0 0
  46. re #18 Not quite sure what your difficulty is HumanityRules: 1880-current global temperature rise is around 0.85-09 oC (NASA Giss or Hadcrut3v). atmospheric CO2 rise from 290 ppm (mid-late 19th century) to 386 ppm (current), should give 1.24 oC at equilibrium within the mid-range of climate sensitivity (3 oC of warming per doubling of [CO2]). So we've had 0.85-0.9 oC of expected temperature response of ~ 1.25 oC. It's obvious (I would have thought) that the temperature response to enhanced radiative forcing is the equilibrium response. There shouldn't be a lag in the onset of the response of course, but the earth will take quite a while for the slow elements of the response, especially the accumulation of heat into the oceans, to come to equlibrium with the enhanced forcing. So the only "sleight of hand" would be to pretend that the earth should somehow miraculously come instantaneously to the new forced surface temperature. Even the most blatant efforts[*] to pursue that canard didn't go as far as to insinuate an instant temperature response to enhanced forcing. Perhaps you're having a general difficulty with the fact that the earth's temperature response to forcing, while not that complex, isn't amenable to simplistic interpretations. As several of us have pointed out on another thread, you do need to consider all of the forcings and their contributions (including anthropogenic aerosols, which have significantly countered anthropogenic greenhouse gas-induced warming). The question of the temporal response to enhanced forcing is difficult (there are obviously multiple time constants in the earth's response - atmosphere responds quite quickly, the surface and especially the oceans much more slowly), and that's the reason that determination of climate sensitivity is difficult based on analysis of (say) the 20th century response to enhanced greenhouse forcing... [*] e.g. (see Schwartz 2007) http://www.skepticalscience.com/climate-sensitivity.htm and his retraction and revision of the notion of a fast earth temperature response to external forcing
    0 0
  47. Chris I guess my point was made in #19. There is no evidence of lag in the early-mid century. The radiative forcing increase 1910-1940 coinsides with a delta T which leaves nothing "in the pipeline". "the earth should somehow miraculously come instantaneously to the new forced surface temperature" it seems miracles did happen 1910-1940. For the preposed system to work lag would have to be a late 20th century phenomenon only.
    0 0
  48. You're mistaking "lag" and "time constant"/"response time", HumanityRules (see my post #20) It's pretty straightforward: make a step change in a forcing to a new value. The earth starts to warm essentially immediately (no lag!). The time taken for the earth to come to equilibrium with the new forcing is a function of the time constants/response times of the system (rapid time response of a few years in the atmosphere; slower time constants for penetration of heat into the "deeper" elements of the climate system, with a very slow response time indeed for the vast oceans to come towards equilibrium with the forcing). It's the latter that gives the "heat in the pipeline" that you remarked upon. That's all very straightforward I think. The mistake is to think that the response of the surface temperature can be encapsulated within individual simple hived-off pieces of the whole. For example we could look at the temperature rise during the early 20th century. There was some very dramatic volcanic activity in the late 19th century/early 20th century and inspection of the global temperature record [*] shows that this knocked back the surface temperature by quite a large amount (0.2-0.3 oC) during a period of 20-odd years. However volcanic forcings are temporary; they have a significant short term effect on the surface temperature, which can be prolonged if there is a period of sustained volcanic activity [as in the period 1883 (Krakatoa) through to Soufriere, Santa Maria Mt Pelee in 1902], and so their effects don't penetrate "deeply" into the climate system. So much of the earth's surface temperature suppression due to volcanic forcing was recovered relatively quickly through the period 1910-1930's. There was also a small solar contribution and an enhanced greenhouse effect contribution to the early 20th century temerature rise. The earth responds to these again without lag, but the full response to these persistent in the long term forcings will take a long time to saturate the elements of the climate system that have a high intertia to change (i.e. the oceans). The earth still hasn't come fully to equilibrium with the enhanced forcing as it stood in 1940 (say), let alone with the forcing as it stands at this particular point in time. Obviously, 'though, if we want to attribute the contributions to the 20th century temperature evolution, we have to consider all of these (including the negative forcing contributions like anthropogenic aerosols), and the manner that the earth responds to these. It's not that complex. However it does require thinking (modelling) of the system in it's entirety. One can't insist on cutting everything right back to individual components and simplistic responses and then complain that reality doesn't conform to a grossly oversimplified view - that's essentially to use straw-man argumentation!
    0 0
  49. re #19 "The numbers don't seem to add up" The numbers add up pretty well if one considers the system in it's entirety (all the forcings and a realistic assessment of climate response times). So, for example, the 20th century global temperature evolution can be reproduced rather well by incorporating all of the contributions and climate response times [*](see Figure 1): [*] http://pubs.giss.nasa.gov/docs/2005/2005_Hansen_etal_1.pdf It's possible to illustrate part of the difficulty with your analysis by considering the global temperature from the late 19th century to the mid 20th century [**]. The global warming during this period wasn't more than around 0.2-0.3 oC overall. It's just that the surface temperature was knocked back quite a bit for a while (see post just above) by volcanic activity. So the net warming in response to your net forcing of 0.5 W/m2 1910-1940 likely wasn't more than 0.2-0.3 oC (perhaps even a bit less, if there was a significant contribution from ocean current effects of the sort that Tsonis and Swanson have discussed). But the bottom line is that the nett effect can only be assessed by a realistic incorporation of all of the contributions and the earth's responses to these.... [**] http://www.cru.uea.ac.uk/cru/data/temperature/nhshgl.gif
    0 0
  50. Back to the original claim. It is getting pretty cool in the Arctic (-35°C, -31°F) http://ocean.dmi.dk/arctic/meant80n.uk.php Still, it is not terribly hot elsewhere around it. I've just walked my dog in the park (lat=47.4717672, lon=19.0426755) and he was anxious to get back which is rather unusual. It is -10°C (14°F) here right now. US http://www.wunderground.com/US/Region/US/2xpxTemperature.html Alaska http://www.wunderground.com/US/Region/Alaska/2xpxTemperature.html Canada http://www.wunderground.com/global/Region/CN/2xpxTemperature.html Europe http://www.wunderground.com/global/Region/EU/2xpxTemperature.html
    0 0

Prev  1  2  3  Next

You need to be logged in to post a comment. Login via the left margin or if you're new, register here.


The Consensus Project Website

THE ESCALATOR

(free to republish)


© Copyright 2024 John Cook
Home | Translations | About Us | Privacy | Contact Us