


 Arguments


Global climate impacts of a potential volcanic eruption of Mount Agung
Posted on 4 October 2017 by Guest Author
Guest post by:
Flavio Lehner (flehner@ucar.edu) and John Fasullo
National Center for Atmospheric Research, Boulder, CO, USA
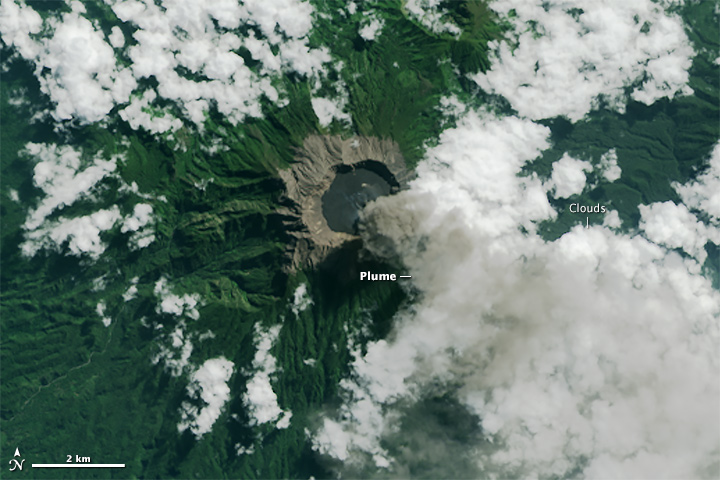
An example of a stratovolcano eruption (note: not Mt. Agung). On July 13, 2015, the Operational Land Imager (OLI) on Landsat 8 took a close up of Mount Raung's summit caldera (on the Indonesian island of Java). Visible is afternoon cloud cover and an eruption plume. Image courtesy of NASA.
Recent weeks have seen an increase in the number of earthquakes happening below Mount Agung, a 9,944ft (3,031m) high volcano in eastern Bali, Indonesia. Authorities have evacuated nearly 50,000 people in the vicinity of the volcano in light of a potential eruption. In addition to concern for people’s lives and infrastructure, the tourism industry fears the potential for disrupted flight plans.
Mount Agung erupted last in 1963, killing over 1,000 people. As is common with large explosive eruptions, it also injected significant amounts of sulfur dioxide into the stratosphere (at least 16-18km above the surface). There, sulfur dioxide combined with water to form sulfuric acid aerosols. These aerosols reflect incoming solar radiation, causing cooling of the Earth’s climate. In fact, volcanic eruptions have been the most important external driver of interannual to decadal variability in global mean surface temperature for at least the past millennium1.
The cooling of global mean temperature from the 1963 eruption amounted to about 0.2 to 0.3°C, although it is difficult to precisely quantify from the noisy observational record where temperature variations unrelated to the volcanic eruption can occur simultaneously2. After such eruptions, global temperature eventually recovers to pre-eruption levels, but both the peak cooling and the recovery time depend on the magnitude and evolution of the eruption; that is, the amount of sulfur dioxide that is emitted and the duration of the eruption.
The second half of the 20th century has seen only two other large eruptions of comparable magnitude: El Chichón in 1982, and Pinatubo in 1991. As with the 1963 Agung eruption, all left significant imprints on climate, most prominently in global temperature but also in global ocean heat content and sea level3, the carbon cycle4, precipitation and streamflow5.
Scientists have been analyzing the precious data that emerged from these rare events for decades. For example, these eruptions serve as test beds for climate models and their ability to simulate the response to energy balance perturbations such as those arising from the reduced incoming solar radiation after volcanic eruptions6. However, it has been over 26 years since the last large eruption and the observing systems in place at that time were relatively primitive. Now, there are a number of new observing systems in place (most notably satellites such as the NASA A-Train and ARGO floats that measure ocean conditions at depth) that have never been tested during such an eruption. These systems could provide critical new measurements to improve our understanding of volcanic impacts on climate and the Earth system, which in turn will serve as an important test of climate models.
Coincidently, the three major eruptions since 1950 were contemporaneous with the warm phase of the El Niño-Southern Oscillation (ENSO), called El Niño events. During these natural events, large amounts of energy are redistributed from the tropical Pacific Ocean around the world, typically leading to a bump in global temperature of about +0.1 to 0.2°C.
While it remains debated whether volcanic eruptions themselves are able to trigger El Niño events, scientists recognized the tendency for volcanic cooling to be balanced by a warming El Niño event in the last about 60 years. Using climate models, such confounding effects have been estimated and removed7,8, revealing that when such effects are taken into account, climate models are significantly better at simulating the global temperature response to eruptions than was previously thought8.
So what should we expect global temperature to do if Mount Agung erupts again within the coming months? While the general forecasting of volcanic eruptions has improved greatly over recent decades – saving many lives like on Bali today – we still cannot predict when exactly an eruption will occur, what its strength will be, and how long it will last. These are all critical factors that determine the response of temperature and other climate aspects to a potential eruption and thus we cannot currently make reliable climate forecasts associated with it. We can think through possible scenarios, though.
The NOAA Climate Prediction Center in its latest ENSO forecast advisory (2nd October 2017) gave a 55-60% chance for the development of a La Niña during this coming winter. La Niña is the counterpart to El Niño and typically causes global mean temperature to be lower than it would be if ENSO conditions were neutral.
One scenario to think through could thus be a major eruption occurring during a La Niña this coming winter. Using the Community Earth System Model Large Ensemble9 (CESM) we can estimate, at least with a climate model, how much the volcanic cooling might be amplified through the coincidental occurrence of a La Niña. The CESM simulations consist of 40 historical simulations, all of which include a representation of the three volcanic eruptions as they occurred in 1963, 1982, and 1991. While imperfect, the CESM does a decent job of simulating the global mean temperature response to recent volcanic eruptions8. We then subsample the 40 historical simulations of the CESM according to whether the eruptions occurred during an El Niño or a La Niña.
Here we use the model information from all three late 20th Century eruptions even though Pinatubo and El Chichón are obviously located in different parts of the world, and erupted with somewhat different strength than Agung. However, they are all located in the tropics close to the Equator, which allows the sulfur dioxide injected into the stratosphere to spread easily across the hemisphere, thus maximizing its impact on global climate. Research has shown that the location and season of an eruption can also influence the characteristics of its climate impact, although decisively less than the eruption strength and duration10,11.
As expected, the CESM suggests that an eruption comparable in magnitude to the 1963 Mount Agung eruption occurring during a La Niña would lead to significantly more cooling than if ENSO neutral conditions coincided with it (Figure 1). Similarly, such an eruption would cool significantly less if it happened during an El Niño. The CESM on average suggests almost 0.3°C cooling for an eruption during a La Niña and less than 0.1°C during an El Niño.
The model also suggests that for an eruption of this strength, global temperature should return to pre-eruption levels within about 5 years, irrespective of which ENSO state prevails during the eruption (Figure 1).

Figure 1: (Left) Composite global mean surface temperature anomaly from the Community Earth System Model Large Ensemble (CESM) during the three volcanic eruptions Agung 1963, El Chichón 1982, and Pinatubo 1991. Anomalies are relative to the 5-year mean preceding the eruption. The CESM simulations have 40 members, yielding 120 simulations of the 3 eruptions. Once the 120 simulations are subsampled according to ENSO state during the eruption, they reveal how El Niños dampen and La Niñas exacerbate the volcanic cooling. Time series are filtered with a 1-2-1 filter, the shading shows 5-95% uncertainty range, the lines are the ensemble mean, and the blue and red bars indicate when the ‘El Niño’ and ‘La Niña’ cases differ significantly from the ‘All’ cases. (Right) Scenarios of annual mean global temperature evolution if an Agung-like eruption occurred in 2017, constructed by adding the ensemble of temperature anomalies from the left panel to random ensemble members from CESM in 2017. Observations are from the Berkley Earth Surface Temperature (BEST) dataset.
These cooling estimates need to be kept in mind when we turn to other comparisons of climate models with reality. For example, in the heated debate over whether climate models are overestimating the global warming response to increased greenhouse gas concentrations, such nuances become important. CMIP5 and the last IPCC assessment were based on simulations that were forced, among other things, with observed volcanic eruptions up until 2005. At the time, that was all that was available and climate models did not therefore include volcanic eruptions after 2005. In reality, however, a number of smaller eruptions did occur after 2005 and thus caused some expected discrepancy with the model simulations12.
To address this issue, scientists are now producing climate projections that include hypothetical future volcanic eruptions, which enables us to answer more quantitatively the question of whether we should expect the effect of volcanic eruptions on climate to be different in a warmer future compared to the past13,14.
Current forecasts, whether statistical or dynamical, as to how warm the years 2017 and 2018 will be, would clearly be affected by a new eruption of Mount Agung (at least if it is similar in strength and duration to the three largest late 20th century eruptions). As illustrated in Figure 1, global temperatures within the next two years could easily drop as low as what they were in 2012 at the end of the infamous "global warming slowdown". Further, given the recovery time of global temperature after an eruption, some discrepancies with CMIP5 model projections until the beginning of the 2020s might also be expected.
This example also shows that global temperature, albeit popular, is not the most robust quantity to measure changes in Earth’s climate. Even absent a strong external forcing, global temperature can vary substantially from year to year, making it difficult to separate the signal from the noise in case of a volcanic eruption or increasing greenhouse gas concentrations. Instead, scientists propose to look at quantities such as global sea level or ocean heat content to take the pulse of our planet15. Those quantities integrate the response of the climate system over very large volumes, thus beating down the noise relative to the signal.
References
1. Schurer, A. P., Hegerl, G. C., Mann, M. E., Tett, S. F. B. & Phipps, S. J. Separating forced from chaotic climate variability over the past millennium. J. Clim. 26, 6954–6973 (2013).
2. Thompson, D. W. J., Wallace, J. M., Jones, P. D. & Kennedy, J. J. Identifying signatures of natural climate variability in time series of global-mean surface temperature: Methodology and insights. J. Clim. 22, 6120–6141 (2009).
3. Fasullo, J. T., Nerem, R. S. & Hamlington, B. Is the detection of accelerated sea level rise imminent? Sci. Rep. 6, 31245 (2016).
4. Frölicher, T. L., Joos, F., Raible, C. C. & Sarmiento, J. L. Atmospheric CO2 response to volcanic eruptions: The role of ENSO, season, and variability. Global Biogeochem. Cycles 27, 239–251 (2013).
5. Iles, C. E. & Hegerl, G. C. Systematic change in global patterns of streamflow following volcanic eruptions. Nat. Geosci. 8, 838–842 (2015).
6. Hansen, J., Wang, W. & Lacis, A. Mount Agung Eruption Provides Test of a Global Climatic Perturbation. Science 199, 1065–1068 (1978).
7. Kirchner, I. & Graf, H.-F. Volcanos and El Niño: signal separation in Northern Hemisphere winter. Climate Dynamics 11, 341–358 (1995).
8. Lehner, F., Schurer, A. P., Hegerl, G. C., Deser, C. & Frölicher, T. L. The importance of ENSO phase during volcanic eruptions for detection and attribution. Geophysical Research Letters (2016). doi:10.1002/2016GL067935
9. Kay, J. E. et al. The Community Earth System Model (CESM) Large Ensemble Project: A Community Resource for Studying Climate Change in the Presence of Internal Climate Variability. Bull. Am. Meteorol. Soc. 141119125353005 (2014). doi:10.1175/BAMS-D-13-00255.1
10. Colose, C. M., LeGrande, A. N. & Vuille, M. Hemispherically asymmetric volcanic forcing of tropical hydroclimate during the last millennium. Earth Syst. Dyn. 7, 681–696 (2016).
11. Stevenson, S., Fasullo, J. T., Otto-Bliesner, B. L., Tomas, R. A. & Gao, C. Role of eruption season in reconciling model and proxy responses to tropical volcanism. Proc. Natl. Acad. Sci. 114, 201612505 (2017).
12. Santer, B. D. et al. Volcanic contribution to decadal changes in tropospheric temperature. Nat. Geosci. 7, 185–189 (2014).
13. Bethke, I. et al. Potential volcanic impacts on future climate variability. Nat. Clim. Chang. (2017). doi:10.1038/nclimate3394
14. Fasullo, J. T. et al. The Amplifying Influence of Increased Ocean Stratification on A Future Year Without A Summer. Nat. Commun. (2017).
15. Cheng, L. et al. Taking the pulse of the planet. Eos (Washington. DC). 98, (2017).


Im no chemist, but it's just several articles and research papers say SO2 converts to sulphuric acid and is a big factor in cooling, along with dust. I'm reluctant to think that would be wrong, unless someone has compelling evidence. Basic chemistry like this is rarely wrong
SO2 can convert in gaseous form to SO3, and to sulphuric acid, its just very slow and probably not hugely significant. Most of the conversion would be another quicker easier pathway through water, I go along with that. Don't volcanoes blow out a lot of water vapour pretty high up?