


 Arguments


2012 Shatters the US Temperature Record. Fox, Watts, and Spencer Respond by Denying Reality
Posted on 14 January 2013 by dana1981
The National Oceanic and Atmospheric Administration's National Climatic Data Center (NCDC) recently announced that 2012 broke the record for the hottest average annual surface temperature for the contiguous United States by a wide margin – a full degree Fahrenheit (Figure 1). Given that this is a very inconvenient fact for certain groups, we should perhaps not be surprised that the NCDC has come under attack for reporting this year's record.
Most prominently, Fox News ran a story quoting Roy Spencer (a contrarian climate scientist at the University of Alabama at Huntsville [UAH]), Anthony Watts (a blogger and broadcast meteorologist), and Steven Goddard (a pseudonym for a climate blogger who goes to the extreme in denying human-caused global warming), all of whom directly or indirectly accused the NCDC of somehow fudging the data to introduce a false warming trend and make 2012 the record hottest year.
The biggest irony of all is that 2012 is the hottest year on record for the USA in Spencer's own UAH lower atmosphere temperature dataset, and yet just a week after this announcement he accused NCDC of improper adjustments when their results matched his own. Without those adjustments, the NCDC record would not match Spencer's UAH dataset nearly as closely. The UAH continental USA warming trend from 1979 to 2012 is 0.24°C per decade, while the trend in maximum daily unadjusted NCDC data over the same timeframe is just 0.11°C per decade. Once the adjustments Spencer criticizes are implemented, the NCDC trend becomes much closer to the UAH trend, at 0.21°C per decade (Figure 1).
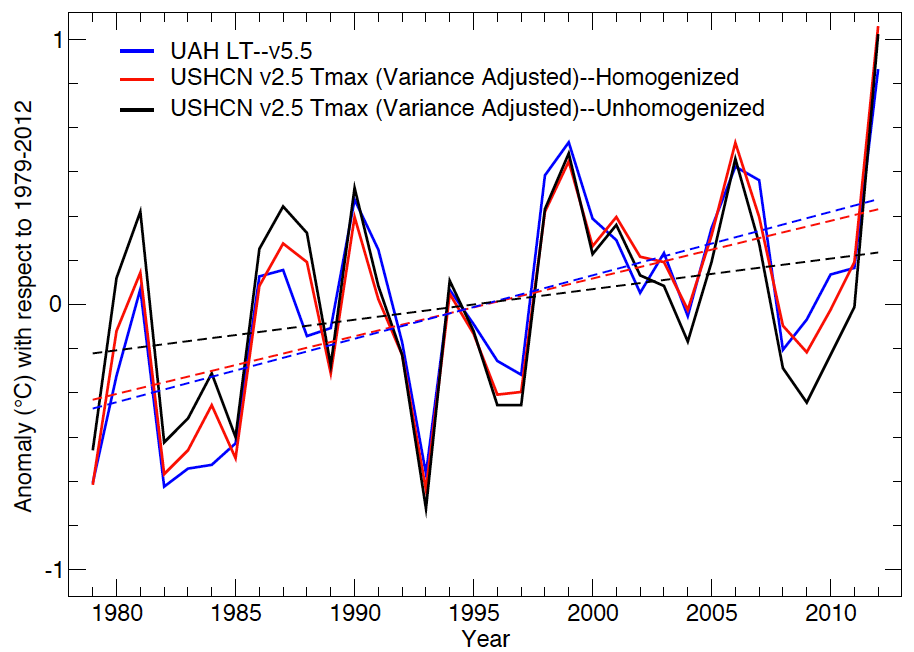
Figure 1: UAH continental USA lower troposphere temperature product (version 5.5; blue) vs. NCDC continental USA maximum daily surface temperature unadjusted (black) and adjusted (version 2.5; red), with linear trends from 1979 to 2012 (dashed).
Another major irony is that while these contrarians treat "adjustment" as a bad word, in their own scientific research they admit that such adjustments are actually very important, and Roy Spencer frequently makes similar adjustments to his own UAH temperature dataset.
These are the latest in a long line of efforts by climate contrarians to cast doubt on the accuracy of the instrumental temperature record, because if the temperature record is wrong, then  – no more global warming to worry about. If only life were so simple.
How We Know the Temperature Record is Accurate
The accuracy of the instrumental surface temperature record, which is compiled from thousands of thermometers in temperature stations around the country and the planet, has been confirmed time and time again by a number of scientific studies using a variety of different approaches. Individuals have taken a do-it-yourself approach, comparing the raw, unadjusted temperature data to the final products from NCDC and other scientific organizations (Figure 2). Skeptical Science's Kevin C put together a do-it-yourself tool so that anybody can try this at home.
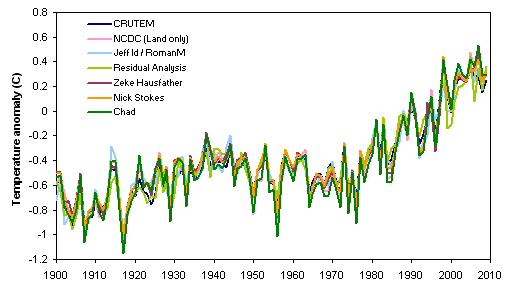
Figure 2: Comparison of land-only surface temperature reconstructions, 1900–2009
People have also compared the raw to the adjusted data and found that the adjustments don't make a very big difference in the final temperature record product (Figure 3).
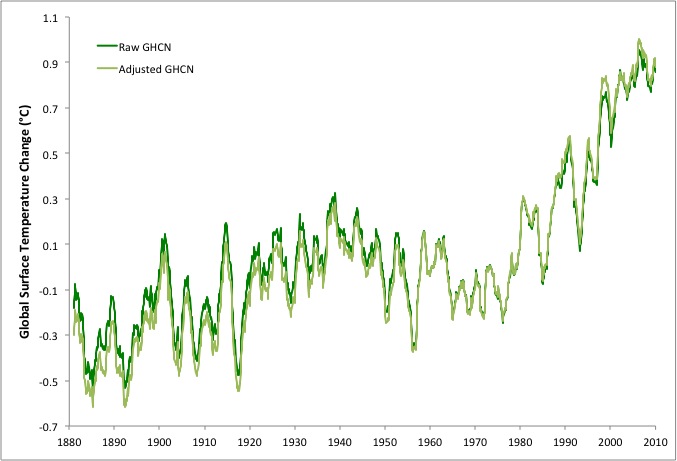
Figure 3: Comparison of global temperatures from raw (dark green) and adjusted (light green) Global Historical Climatology Network (GHCN) v3 data, 1880–2010 (analysis by Zeke Hausfather).
The Koch-funded Berkeley Earth Temperature Station (BEST) project also set out to test the surface temperature record accuracy by creating their own record using a novel and robust methodology (described in detail by Rohde et al.), and arrived at essentially the same result as NCDC (Figure 4).

Figure 4: Land temperature with 1- and 10-year running averages. The shaded regions are the one- and two-standard deviation uncertainties calculated including both statistical and spatial sampling errors. Prior land results from the other groups are also plotted, including NCDC in green.
Measurements made by satellites of the temperature of the lower atmosphere (the lower troposphere, or LT), including by Spencer's UAH group, are also very consistent with the measurements made by thermometers on the ground (Figure 5).
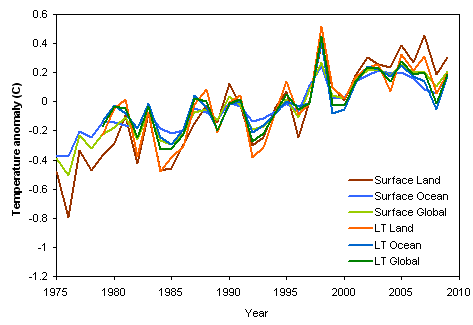
Figure 5: Comparison of temperatures from surface stations and satellite monitoring of the lower troposphere (LT).
The NCDC temperature record has been compared to a number of reanalysis products (climate or weather model simulations of the past that include data assimilation of historical observations) by Vose et al. (2012), which also confirmed its accuracy, concluding,
"For the conterminous United States, the trend in the adjusted [U.S. Historical Climatology Network] (0.327°C/decade) is generally comparable to the ensemble mean of the reanalyses (0.342°C/decade). It is also well within the range of the reanalysis trend estimates (0.280 to 0.437°C/decade)."
A paper by Anderson et al. (2012) also created a new global surface temperature record reconstruction using 173 records with some type of physical or biological link to global surface temperatures (corals, ice cores, speleothems, lake and ocean sediments, and historical documents). The study compared their reconstruction to the NCDC instrumental temperature record and found a strong correlation between the two, of 0.76 (Figure 6).
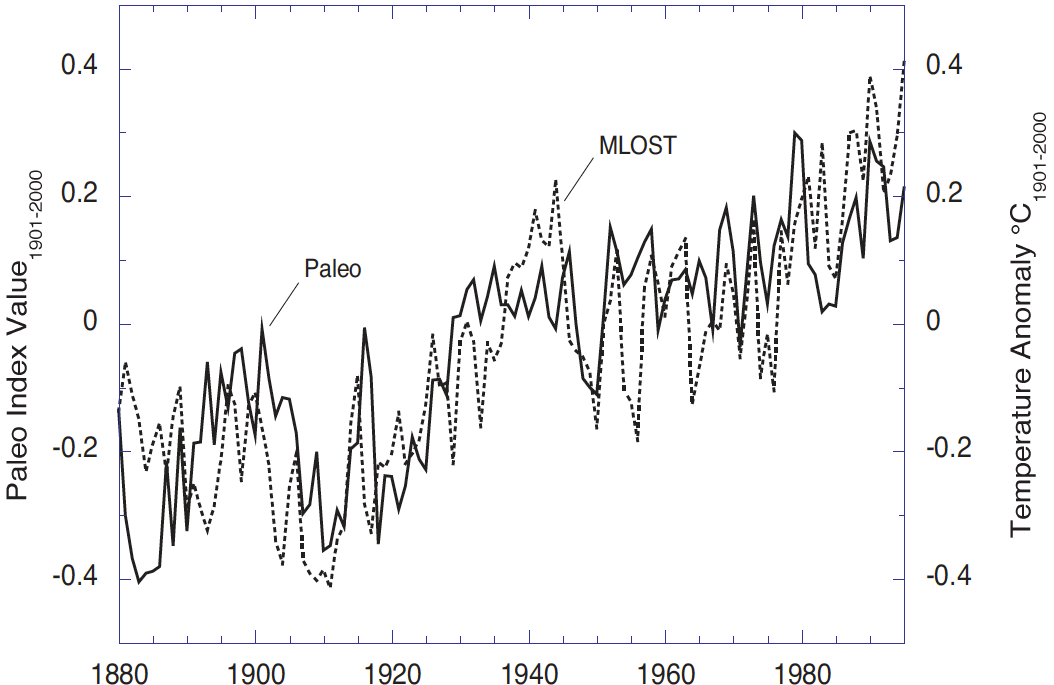
Figure 6: Anderson et al. (2012) Paleo Index (solid) and the merged land-ocean surface temperature anomalies (MLOST, dashed) relative to 1901-2000.
And of course natural thermometers clearly confirm the Earth's general warming trend – vanishing ice, rising oceans, species migrations, earlier arrival of spring, etc.
From these results, it's quite clear that NCDC is not introducing a fake warming trend. So where does this myth come from?
Critical Data Adjustments
There are a number of adjustments that scientific groups like NCDC have to make to the raw temperature data. For example, sometimes a temperature station will move, or the time of observation of the thermometer will change, or the type of temperature station will change. These changes can introduce biases into the instrumental record which are not representative of actual temperature changes, so they must be accounted for and removed in order to get an accurate measurement of actual surface temperature changes. For further details, see this post and Glenn Tamblyn's excellent four-part series on the surface temperature record.
Coincidentally, a number of these factors have introduced a cooling bias into the surface temperature record in recent decades, and NCDC removes this cool bias with its adjustment methodology. Certain individuals who want to deny that global warming is happening mischaracterize this removal of cool biases, claiming NCDC is introducing a false warming trend.
In reality the adjustments made by NCDC are based on sound science, and detailed in the peer-reviewed scientific literaure. Their version 2 temperature dataset and processing steps are described in detail in Menne et al. (2009) and on the NCDC website, and details regarding some recent and relatively small revisions for version 2.5 of their dataset are described in two technical reports (Williams et al. 2012a and 2012b) and on the same NCDC website.
The general effectiveness of these adjustments has been confirmed by Peterson et al. (2003), Menne et al. (2010), and Fall et al. (2011). Another paper currently in press, Hausfather et al. (2012), found that the NCDC adjustments are critical in removing the influence of artificial artificial heat sources on the thermometers (the urban heat island effect).
"...urbanization accounts for 14% to 21% of the rise in unadjusted minimum temperatures since 1895 and 6% to 9% since 1960. The USHCN-Version 2 homogenization process effectively removes this urban signal such that it becomes insignificant during the last 50-80 years."
In short, the adjustments made by NCDC to the raw temperature data are scientifically justified, very important, supported in the scientific literature, and their effectiveness has been confirmed by a wide variety of different approaches.
Watts' False Accusations Ignite the Myth
The specific accusations about NCDC falsifying data to make 2012 the hottest year on record in the USA originated on Anthony Watts' blog, where after finding discrepancies between temperatures listed in NCDC's past monthly State of the Climate reports, and those in its climate database. Watts immediately accused NCDC of "keep[ing] two separate sets of climate books for the USA", rather than simply contacting them to ask for an explanation.
That's what I did, and NCDC provided the following response, explaining that the discrepancy was due to the recent switch from version 2 to version 2.5 of their methodology in October 2012 (as discussed above):
"It is totally inappropriate to mix values from different data bases to identify records. This is exactly what Anthony Watts has done. He selected the mean monthly temperatures from an older data base (version 2 USHCN) and compared it to mean monthly temperatures in a newer data base (version 2.5 USHCN). This is a fatal error. For example, the US average temperature of July 2012 is the record warmest within both data bases. Values in version 2.5 are different from version 2.0 for two reasons. Different base periods are used in the two data bases to compute normals, which affect the monthly mean temperatures for all years. Second, an improved correction algorithm has been applied to the newer data base. NCDC has notified users on our web site back in September of 2012 of the differences in the two data sets. All of NOAA NCDC analyses are based on peer-reviewed published work. Please see [this website] for more details."
Contrarian Contradictions
Spencer's Own Adjustments
Ironically, Roy Spencer's own UAH temperature record adjustment methodology has undergone a large number of major revisions:
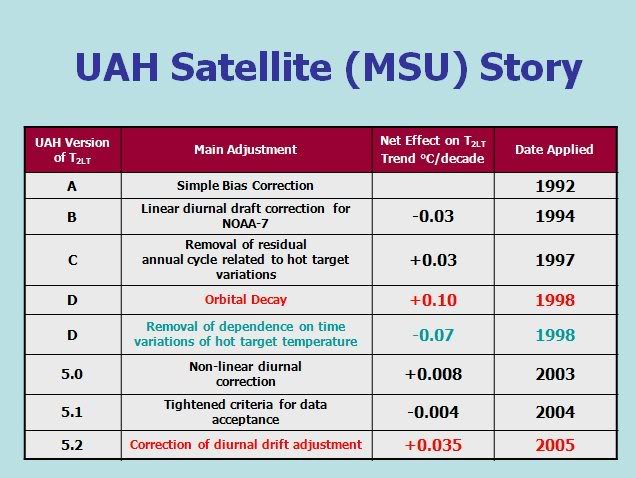
Major corrections to the UAH temperature trend over the years.
There is of course nothing wrong with making these adjustments; quite the contrary. Science advances, we learn, and we improve our understanding and methods. But for Spencer to criticize NCDC for making the same sorts of scientifically justified adjustments is hypocritical and self-contradictory.
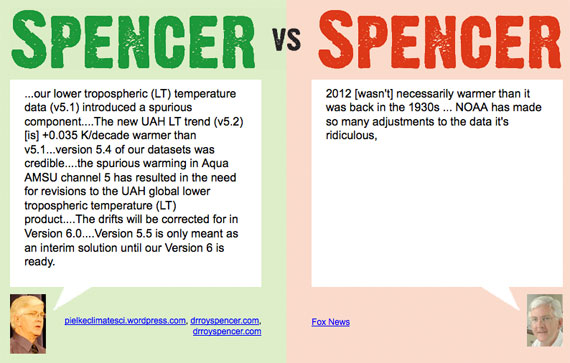
image created by John Cook
Watts' Criminal Accusations
For his part, Anthony Watts suggested to Fox that NCDC's adjustments are essentially criminal, even though he was a co-author on the Fall et al. (2011) paper which confirmed the general accuracy of the instrumental surface temperature record, and noted that the types of adjustments made by NCDC are necessary.
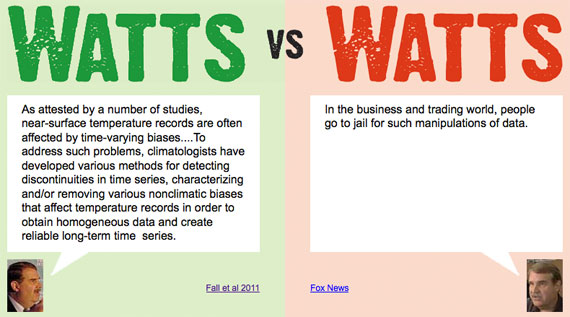
image created by John Cook
In both cases it would be hard to understand how these contradictory statements could come from the same person, except such contradictory arguments are the norm for climate contrarians.
Temperature Record is Reliable When Convenient
Additionally, the last mainstream media climate myth we addressed just last week incorrectly claimed that global warming has 'stalled', based almost exclusively on the instrumental surface temperature record (and a climate model run, which contrarians also claim are unreliable). Now contrarians are arguing that the temperature record is unreliable. Which is it? The instrumental temperature record can't be both the basis of an argument one week and completely unreliable the next week.
Yes, 2012 Was the Hottest Year on Record in the USA
To sum up,
- The accuracy of the surface temperature record has been confirmed time and time again by a wide variety of methods, including comparisons with do-it-yourself temperature analyses, with satellite measurements, and with natural thermometers.
- Scientific groups like NCDC make necessary, scientifically-justified adjustments to the raw data in order to remove biases introduced by factors like changes in temperature station locations, time of observations, and types of instrumentation.
- These adjustments are published in the peer-reviewed scientific literature, and their effectiveness has been confirmed by numerous peer-reviewed studies.
- Spencer's own UAH group has made many revisions to its own data adjustment methodology as well.
- If climate contrarians dispute the validity of any of the adjustments made by NCDC, they should subject their criticisms to the scientific peer-review process rather than making unsubstantiated and unjustified accusations of malfeasance in the mainstream media.
- The contrarians making these accusations are contradicting their own results and previous research, which support the effectiveness and importance of the adjustments made by NCDC.
Overall, the contrarians have given us no reason to doubt the accuracy of the instrumental surface temperature record or the fact that 2012 was the hottest year on record in the continental United States. In fact, this result is consistent with Roy Spencer's own UAH dataset. We are instead left with just another mainstream media article full of denial, unsubstantiated assertions, contradictions, and conspiracy theories, misinforming the general public, and delaying our efforts to actually solve the climate problem by denying the reality that it exists and is a grave threat.
Also see this excellent post on the subject by Josh Timmer at Ars Technica.


O.K. To do this (as in my comment 52 above about finding the actual version 2 data for CONUS as now archived) they told me I need to get into the business of handling large zipped files. I am going to plug away. I may or may not be able to do this, but will learn something in any case.
For reference, NCDC debunked this myth before it was even born. Here's their comparison of the global mean temperature from the unadjusted and adjusted data:
From this paper