


 Arguments


The two epochs of Marcott and the Wheelchair
Posted on 26 March 2013 by JosHagelaars
This is a re-post from OurChangingClimate
The big picture (or as some call it: the Wheelchair): Global average temperature since the last ice age (20,000 BC) up to the not-too distant future (2100) under a middle-of-the-road emission scenario.
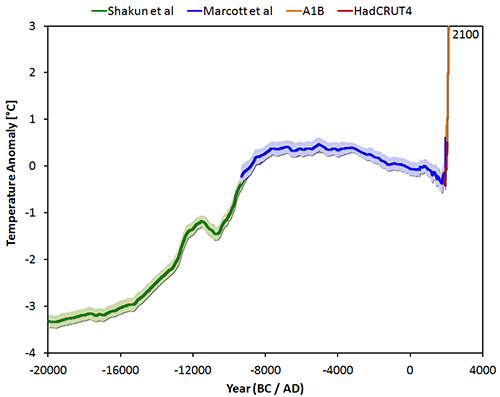
Figure 1: The temperature reconstruction of Shakun et al (green – shifted manually by 0.25 degrees), of Marcott et al (blue), combined with the instrumental period data from HadCRUT4 (red) and the model average of IPCC projections for the A1B scenario up to 2100 (orange).
Earlier this month an article was published in Science about a temperature reconstruction regarding the past 11,000 years. The lead author is Shaun Marcott from Oregon State University and the second author Jeremy Shakun, who may be familiar from the interesting study that was published last year on the relationship between CO2 and temperature during the last deglaciation. The temperature reconstruction of Marcott is the first one that covers the entire period of the Holocene. Naturally this reconstruction is not perfect, and some details will probably change in the future. A normal part of the scientific process.
The temperature reconstruction ends mid-20th century, so the rapid temperature rise since 1850 is clearly visible in the graphs presented in their study. And what do we see?
Again something that looks like a hockey stick as in the graph from Mann et al 2008.
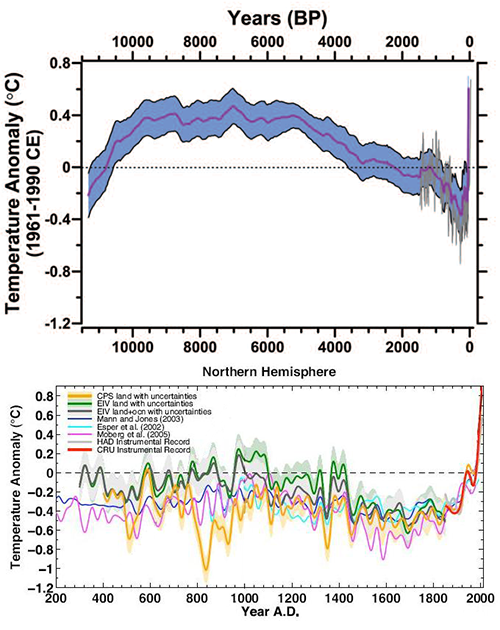
Figure 2: The temperature reconstruction of Marcott 2013 (past 11,000 years) and a collection of reconstructions (past 1800 years) as presented by Mann 2008.
Are the results from Marcott et al surprising?
Not really. The well-known graph of Holocene temperature variations on Global Warming Art, which is often encountered on the internet, is actually a comparable image. One could say that Marcott et al managed to scientifically confirm the average thick black line of the Global Warming Art image. See figure 3.
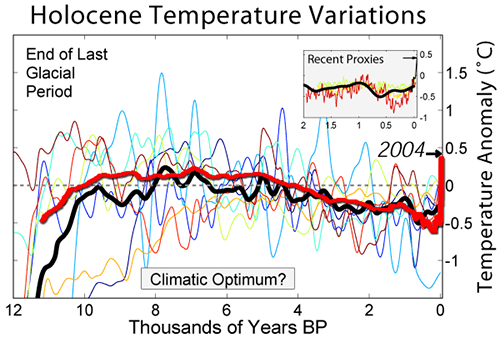
Figure 3: Holocene temperature variations from Global Warming Art, with the average in black, combined with the reconstruction of Marcott 2013 in red.
Patterns in temperature reconstructions which resemble a hockey stick, are fervently contested on climate skeptic websites. The Marcott et al reconstruction is no exception. For example, it is hard to keep track of the number of posts WUWT dedicated to this study, and the statistical wonderboy McIntyre is also energetically producing blog posts. Otherwise the general public might get the impression that humans are strongly influencing the climate and apparently that is not a desirable impression.
The study of Marcott suggests that the earth is warming rapidly from a historical perspective, though the authors warn that the low time resolution of about 120 years and subsequent smoothing preclude a hard statement on whether it is truly unprecedented. The study is about the Holocene, the geological period of 11,700 years ago until now. From the main image of Marcott 2013 it can be deduced that after the last ice age, earth's temperature has risen to about 7000 years ago, followed by a slow decline. The cause of the gradual cooling in recent millennia is a change in the distribution of solar radiation over the earth and over the seasons, known as Milankovitch cycles, which are responsible for the initiation and termination of ice ages.
After the year 1850, the influence of man-made emissions is clearly visible in Marcott's figure. The average temperature of the last decade was higher than the temperatures have been for 72% of the past 11,000 years:
Our results indicate that global mean temperature for the decade 2000–2009 has not yet exceeded the warmest temperatures of the early Holocene (5000 to 10,000 yr B.P.). These temperatures are, however, warmer than 82% of the Holocene distribution as represented by the Standard5×5 stack, or 72% after making plausible corrections for inherent smoothing of the high frequencies in the stack.
Epochs have a beginning and an end. From the main image of Marcott's study you could deduce that, regarding climate, a new epoch has begun about 150 years ago. A clear break in the trend over the past 11,000 years. The end of the Holocene was reached in 1850 and the Anthropocene has started, the epoch in which man asserts its influence on climate. This leads to disbelief in certain parts of the population, which was predicted at the start of the Anthropocene by Charles Dickens, who wrote in 1859:
It was the best of times, it was the worst of times,
it was the age of wisdom, it was the age of foolishness,
it was the epoch of belief, it was the epoch of incredulity
Figure 1 at the beginning of the blog post clearly shows that mankind is creating a new world with a climate that human civilization has never encountered before. If human greenhouse gas emissions continue unabated, the temperature will go up even further. According to the IPCC 2007 A1B scenario we will probably have temperatures in the year 2100 that are about +3.0 degrees above the average of 1961-1990. The expected jump in the atmospheric temperature from 1850 to 2100 is of the same order of magnitude as the rise in temperature from the last ice age to the Holocene, as derived from the Shakun 2012 data. The difference is that current and future increase in temperature occurs orders of magnitude faster.
Marcott et al also refer to the climate model projections of IPCC 2007:
Climate models project that temperatures are likely to exceed the full distribution of Holocene warmth by 2100 for all versions of the temperature stack, regardless of the greenhouse gas emission scenario considered (excluding the year 2000 constant composition scenario, which has already been exceeded). By 2100, global average temperatures will probably be 5 to 12 standard deviations above the Holocene temperature mean for the A1B scenario based on our Standard5×5 plus high-frequency addition stack.
i.e. unprecedented, as many as 5 to 12 standard deviations above the mean of the temperatures in the Holocene. Welcome to the Anthropocene!
A famous SF series from past times always began with:
"To boldly go where no man has gone before"
Indeed, we are boldly entering a new epoch where no man has gone before. I have some doubts whether our descendants will be so delighted about it.
[UPDATE 31 March 2013]
A summary and FAQ related to the study by Marcott et al (2013, Science), prepared by the authors, can be found at RealClimate.


Thanks KR, I will have a look at them.
KR @43:
I think you are missing the point of the monte carlo reconstructions. We know that there are errors in the temperature reconstruction and dating of the proxies. That means at some points the unperturbed reconstruction will be too low, or too high relative to reality. At those points, particular realizations in the Monte Carlo reconstructions which are low or high (respectively) are closer to reality. Not knowing the precise course of reality, we cannot know whether or not particular spike in a particular realization, whether high or low, maps reality closely or not.
One way you could approach the general problem would be to do 20,000 monte carlo realizations and to prune away all realizations with an overal probability relative the the original data and errors of less than 5%. That will leave you with approximately 1000 realizations all of which could plausibly be the real history of temperature over the Holocene. You could then examine those thousand plausible realizations to see if any contained Tamino style spikes. If not, then the data excludes such spikes. If they do, the data does not.
As it happens, Marcott et al did not prune their realizations based on global probability. Consequently about 50 of their realizations are not plausible temperature reconstructions. Importantly, though, even plausible reconstructions will contain short intervals which are implausible given the data. Indeed, about 5% of their length, on average will be implausible based on the data. Therefore we cannot look at a single peak and conclude from the fact that the realization is clearly an outlier in that time period, that the realization is an outlier over the entire holocene. You need the entire realization to come to that conclusion, and due to the nature of 1000 realization spagheti graphs, we do not have the entire history of any realization.
So, for all we know from the spaghetti graph, there are plausible realizations containing Tamino style spikes within it. In fact, what we can conclude from the Marcott et al realizations is that:
1) With very high probability, the real temperature history does not follow the mean of the monte carlo reconstructions;
2) With very high probability, the 300 year mean of the real temperature history lies within 0.27 C of the mean 95% approximately 95% of the time; but that
3) With high probability the 300 year mean of the real temperature history is further than 0.27C from the mean about 5% of the time.
The question is whether the approximately 275 years we expect the 300 year mean of the real temperature to be over 0.27 C above the mean is the result of a sustained multicentury warmth, or whether it could be from a Tamino style spike. (Note, a Tamino style spike as a 300 year mean temperature increase of 0.3 C.) On information todate, the later is improbable, but not excluded.
Well, yes, they don't show global anything because they are regional proxies. I assume you mean stacks of such proxies. Well, consider the only two high resolution (20 year) proxies used by Marcot et al over the period 8 to 9 Kya:
In particular consider the spike of 3 C at 8.39 Kya in the Dome C icecore, which is matched by a 1.5 C spike in the Agassiz-Renland icecore. That looks suspiciously like a Tamino style spike. Or consider the 3 C trough at 8.15 Kya in the Aggassiz-Renland icecore and the 2 C trough at 8.23 K in Dome C. Although the resolution of these ice cores is actually annual, at 8 Kya plus years, the 1 sigma error of age estimate relative to 1950 is greater than 150 years. Ergo it is quite possible those two troughs should align, creating a Tamino style trough.
These two possible candidates do not show up in the mean of the Marcott et al reconstruction.
It would certainly be possible for somebody to go through and make a maximum variability alignment of idividual proxies as constrained by uncertainties in temporal probability. If that were done, and no convincing, global Tamino style spikes existed in that record, that would be convincing evidence that no such spikes existed. But until it is done, there is sufficient variability in individual regional proxies that we cannot make the claim that the individual proxies exclude that possibility.
Sphaerica @48, I assume you do not think I am following the steps to denial.
The fact is that some people, most notably Tamino who at least has made a check of the claim, are claiming that the Marcott et al. reconstruction excludes Tamino style spikes. That is more than is claimed by the authors of the paper. Before we can accept that Marcot et al does exclude such spikes, we need to check the evidence. So far the evidence is tantalizing but far from conclusive. Ergo we should not use that claim as evidence in rebutting AGW skepticism. When "skeptics" get to step two, we need only point out (truthfully) that they are over interpreting Marcot et al's remark about frequency and that they have not shown that such a spike could exist and not be shown in the Marcot et al reconstruction. In short, they have no evidence for their claim at step two. Although many AGW "skeptics" like to treat an absence of refutation of their position as proof their position is true, we need not accept such irrationality and cannot reach those who continue to accept it once it is pointed out to them.
However, this discussion is indeed a distraction and absent a significantly new argument or evidence that changes my opinion, I shall withdraw from further discussion of this point.
Tom Curtis - To clarify my earlier comments regarding Monte Carlo analysis:
Given a set of proxies with date uncertainties, if there is a large (50 sigma?) signal involved, even if the initial dates are incorrect at least some of the realizations in the perterbation space will accurately reflect that spike, being shifted to reinforce each other. And some will show more than that spike, due to unrelated variations being date-shifted intot he same time period. The number, and density of the Monte Carlo probability function, will be dependent on the distance of the various date errors - but there will be a density function including the spike and more in the full realization space. This is very important - if an alignment that shows such a spike is possible under the uncertainty ranges, it is part of the Monte Carlo realization space.
1000 runs is going to sample that space very thoroughly. And nowhere in the 1000 Marcott runs pre-19th century do you see a density function excursion of this nature.
[ Side note - pruning the Monte Carlo distribution would be completely inappropriate - the entire set of realizations contributes to the density function pointing to the maximum likelyhood mean, and pruning induces error. Even extreme variations are part of the probability density function (PDF). The mean in the Marcott case is clearly plotted; "Just what were the mean values for the thousand years before and after that spike in that realization? Clearly you cannot say as its hidden in the spaghetti." is thereby answered. ]
I disagree entirely. That is indeed the maximum likelihood of the history, based upon the date and temperature uncertainties. And the more data you have, the closer the Monte Carlo reconstruction will be to the actuality. Exactly? No, of course not, reconstructions are never exact. But quite close. Monte Carlo (MC) reconstructions are an excellent and well tested method of establishing the PDF of otherwise ill-formed or non-analytic functions.
That is exactly what a MC exploration of date and temperature uncertainties performs. No such excursions are seen in any of the 1000 realizations. Meanwhile, the rather smaller +/- excursions over the last 1000 years are quite visible, as is the 8.2 Kya event of 2-4 centuries (and yes, it's visible as a ~0.1-0.15 C drop in Marcott). I believe it is clear that the Marcott data would show a larger 0.9 C global two-century spike event if it existed - and it does not show.
Forgive me if I havent been following this closely enough, but surely no spike in global temperatures is possible unless there are spikes of the appropriately same magnitude in individual proxies. So one question, is there any spikes of centennial scale with size of modern warming evident in individual proxies (like ice core) that have sub-century age resolution? If there are none, then it hardly matters about the nicities of the multi-proxy processing surely?
scaddenp @55, are there large spikes in individual proxies? Yes, and there are also large spikes in multiple individual proxies simultaneiously to within temporal error (see my 53).
KR @54:
1) A 0.9 C spike is approximately a 2 sigma spike, not a fifty sigma spike. That is, the 300 year average of an interval containing that spike will be 0.3 C (approx 2 SD) above the mean. If you want to argue it is more than that you actually have to report the frequency of such spikes in the unpruned Monte Carlo realizations. Marcott et al did not report it (although I wish they had), and nobody else has reproduced it and reported it so we just don't know.
2) We don't see any density function excursions in the Monte Carlo realizations because:
a) Marcott et al did not plot the PDF of centenial trends in the realizations (or their absolute values); and
b) In the spahhetti graph you cannot see enough to track individual realizations over their length to determine their properties.
Perhaps you are forgetting that the realizations are reconstructions with all their flaws, including the low resolution in time. That means a Tamino style spike in the realization will be equivalent in magnitude to his unperturbed reconstruction, not the full 0.9 C spike. As such, such a spike starting from the mean temperature for an interval would not even rise sufficiently above other realizations to be visible in the spaghetti graph.
3) Pruning the realizations is a statistical blunder if you are plotting the PDF for any property. It is not a blunder, or wrong in any way if you want to see if a statistically defined subset of realizations have a particular property.
4) If I throw two fair dice the maximum likilihood result of the sum of the dice is seven. That does not mean I will always get a seven each time over one hundred throws. In fact, with high probability, over one hundred throws I will get a 7 only 17 times (16.66%). Also with significant probability, I will get a 12 about 3 times. As it happens, the probability of a realization lying on the mean of the realizations at any time is about 5%. Ergo, about 95% of the time for any particular realization it will not lie on the mean, but be above it or below it. Most realizations will lie on the mean more frequently than any other temperature, but on no temperature relative to the mean very oftern at all.
That is the reason Marcott et al compare modern temperatures to the PDF of temperatures in the realizations rather than the mean. Directly comparing with the mean is, unfortunately, tempting, but wrong. So also is treating the mean as the course of temperature over the Holocene. Rather it is a path that statistically constrains what Holocence temperatures could have been given what we know.
Tom Curtis - "That is the reason Marcott et al compare modern temperatures to the PDF of temperatures in the realizations rather than the mean."
Comparing PDF's is indeed the appropriate method - and comparing the means of those PDF's is part of that analysis.
It may be, looking at his results, that Tamino failed to apply the averaging of sampling resolutions when inserting his spike into the proxy data - but given the median 120 year sampling, that would at most reduce such 200-year spikes by a factor of ~2; still large enough to be visible in the full realization.
WRT Monte Carlo analysis - the PDF of the full MC perturbed realization space in the presence of noise must include the raw data, and beyond, as at least some of the realizations will shift uncorrelated variations under the such a spike. The majority will blur a short spike by shifting proxies to not coincide, but will still pull up the mean in that area. That's true even given dating errors, as some of the perturbations will undo such errors. In the 1000 realization set (which should be a good exploration of the MC space) as shown by the 'spaghetti graph' - the outer bounds of those realizations do not include any such spikes.
Now, it may be that 1000 realizations is not a sufficient exploration of the MC set (unlikely, though), or that the combination of proxy smearing and MC low-pass filtering might make a small spike difficult to distinguish. I would disagree, but I haven't gone through the full exercise myself.
However - Isn't this all just a red herring? One initially raised by 'skeptics' in an attempt to dismiss the Marcott paper?
The Marcott et al paper is very interesting, it reinforces what we are already fairly certain of (that there is a lack of evidence for large spikes in temperature over the Holocene, that there is no physical basis for such spikes), and I expect their methods will be extended/improved by further work. But arguing about the potential existence of mythic and physically impossible spikes is an irrelevant distraction from the issues of current warming.
I think I will have to stop being lazy and dig out the data. 0.9C is a global average. For individual proxies (eg greenland), the change in temperature at the same location is much higher than 0.9. So when looking at individual proxies, a spike should be based on comparing the 20C change in temp at that location with the proxy. Eg for greenland, how common are spikes of 1.6C on a centennial scale?
scaddenp @58, the temperature increase in the 20th century has been matched by an approx 2.2 C increase in temperatures at the GISP2 site, only 1.5 C of which is captured in the ice core record (Kobashi et al, 2011). For comparison, the 8.2 Kya trough was approximately 3 C in the nearby Aggasizz-Renland core.
And contrary to KR, it does not show up in the Marcott reconstruction. Indeed, direct comparison with the data from the SI spreadsheet shows that at the time fo the dip, the reconstructed temperature is rising from a low point at 8.31 Kya to a high point at 8.05 Kya. The 8.2 (technically 8.17 in the Agassiz-Renland data) trough is at best matched by a 0.01 C inflection in that rise.
If the -1.5 C excursion at 8.25 Kya of the Dome C record was in reality the same event, this is possibly a global temperature excursion greater than 0.9 C. The 80 year differnce in time matches 1 SD of temporal error in the A-R record and 0.5 SD in the Dome C record so allignment in reality is certainly within the bounds of possibility. Indeed, it is probably that they, and similar troughs in the 50 odd proxies with data points in that interval align in at least one realization of the reconstruction, but with that many proxies, allignment across all would be rare so that such allignments would be washed out by the majority of realizations in which there is no alignment.