


 Arguments


Climate Models Show Remarkable Agreement with Recent Surface Warming
Posted on 28 March 2014 by Rob Painting
- Despite warming over the last 16 years, global surface temperatures have warmed at a slower rate than the previous 16 years and, at first glance, it appears that the climate models may have overestimated the amount of surface warming over this period.
- Climate models, however, cannot predict the timing and intensity of La Niña and El Niño, natural cycles that greatly affect global temperature in the short-term by dictating the amount of heat available at the ocean surface.
- Nor can the climate models predict the timing and duration of volcanic eruptions and industrial pollution, both of which eject light-scattering aerosols into the atmosphere and therefore reduce surface warming.
- By failing to account for these and other factors, the CMIP5 collection of climate models erroneously simulate more warming of Earth's surface than would be expected.
- When the input into the climate models is adjusted to take into consideration both the warming and cooling influences on the climate that actually occurred, the models demonstrate remarkable agreement with the observed surface warming in the last 16 years.
Figure 1 - The animation shows the CMIP5 model simulations compared to the HADCRUT4 surface temperature dataset. As allowances are made for better global coverage of temperature observations, El Niño/La Niña, solar radiation, and volcanic aerosols, the simulated surface temperature moves back toward the actual measured temperature over this period. Animation by Kevin C.
Still Warming After All These Years
When you consider all of Earth's reservoirs of heat; the oceans, land, ice and atmosphere together, global warming hasn't slowed down at all. In fact quite the opposite has happened, the Earth has warmed at a faster rate in the last 16 years than it did in the previous 16. Taken in isolation though, the atmosphere has bucked this trend - warming at a slower rate in the last 16 years than it did in the previous 16 years.
There was no prior scientific expectation that surface warming would progress in a linear manner, despite the ongoing build-up of heat within the Earth system, but this slower rate of surface warming comes at a time when industrial greenhouse gas emissions are larger than ever. Preying upon the seemingly common, but mistaken, public assumption of year-after-year surface warming, contrarians and some mainstream media outlets have used this opportunity to further misinform the public about global warming. One of the more popular climate myths that has emerged as a result of this counterintuitive build up of heat is that climate models have overestimated recent surface warming and therefore will overestimate future surface warming.
Climate models are computer-based mathematical calculations representing the physics of the real world, and so obviously are only rough approximations of the real Earth. It is certainly possible that they may have overestimated recent surface warming, but a closer examination of the evidence suggests any possible recent discrepancy between the models and observed surface temperatures may simply be a result of incorrect input into the models over the recent period in question. Garbage in equals garbage out (GIGO) as some might put it. Before venturing down that road, however, it's time to consider the relevant background context.
Future Weather and Climate: There Can Be Only One
Climate model projections typically involve a large number of individual model simulations which are spun-up well into the past and then run forward into the future to estimate climatic features of the Earth - such as global surface temperature trends. The timing of weather-related phenomena like El Niño and La Niña, which greatly affect surface temperatures in the short-term, cannot be accurately predicted and, because small changes in weather patterns allow the simulated weather to evolve along different pathways, there is a great deal of variation between the individual model runs. For example; a model run which simulates a predominance of La Niña over a given decade is going to exhibit cooler surface temperatures than another model run which displays El Niño dominance over the same decade. Over longer intervals, however, there may not be much difference in projected surface temperatures between the two model runs.
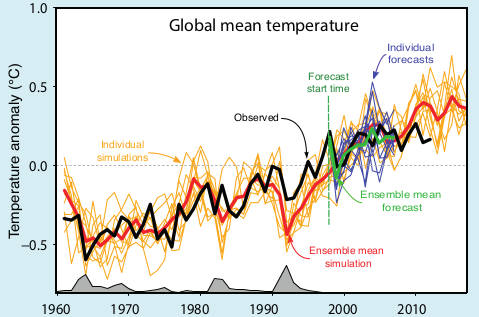
Figure 2 - A typical graphic displaying climate model simulations of global surface temperature. The spaghetti-like individual model runs are shown in orange lines. Image from the IPCC AR5 Box 11.1 Figure 1.
Multi-Model Averaging Obscures Natural Variation
Often when researchers plot the output of a batch of climate model simulations they do so by averaging all the individual runs together, known as the multi-model mean, and illustrate the uncertainty range of all the projections. The average of the model runs is shown as the thin blue line in Figure 1, and the uncertainty range of 5-95% is the blue band in the figure. The uncertainty range means that, based on all the model runs, model projections remain within the blue band 90% of the time, and 10% of the time they are either above (5%) or below (5%).
This is equivalent to some god-like experiment where we are able to run the Earth's weather forward in time over and over again, observe how global surface temperatures evolve, and then plot the output. Of course the Earth only gets one roll of the dice, so the real world is actually equivalent to only one realization of the many climate model simulations, and 90% of the time could be anywhere within the 5-95% uncertainty envelope. The multi-model mean is therefore somewhat misleading in that it obscures the inherent variability in surface temperatures in each individual model simulation. We simply do not expect temperatures at the surface in the real world to progress as smoothly as the multi-model mean would seem to imply.
Garbage In Equals Garbage Out
Due to the inability to predict the timing of natural changes within the climate system itself, such El Niño and La Niña, and factors external to the system, such as light-scattering aerosols from volcanic eruptions and industrial pollution, it becomes difficult to ascertain whether the climate model projections are diverging from reality or not. Not until the projected temperatures actually occur in the real world and persistently move outside the uncertainty range would we be aware that there was a problem.
One way to test usefulness of the climate models is to look at hindcasts - model simulations of the past where we have a reasonably good idea of what net forcing the Earth's climate was responding to. This isn't as simple as it might seem. For example; although we have a good idea of the forcing from industrial greenhouse gas emissions (which trap heat in the oceans and atmosphere), because of observational difficulties, we only have a very rough idea of the cooling effect of those tiny particles in the air called aerosols.
Not only do aerosols scatter incoming sunlight by wafting about in the atmosphere, but they also seed clouds with smaller-than-normal condensation nuclei - extending cloud lifetime. These smaller nuclei also make clouds whiter and thus more reflective to incoming sunlight. The changes in cloud characteristics imparted by aerosols (called the indirect effect) is their dominant influence and just so happens to be extraordinarily difficult to quantify. Add in the patchy and constantly changing global distribution of aerosols and it makes for a large amount of uncertainty on the forcing of surface temperatures.
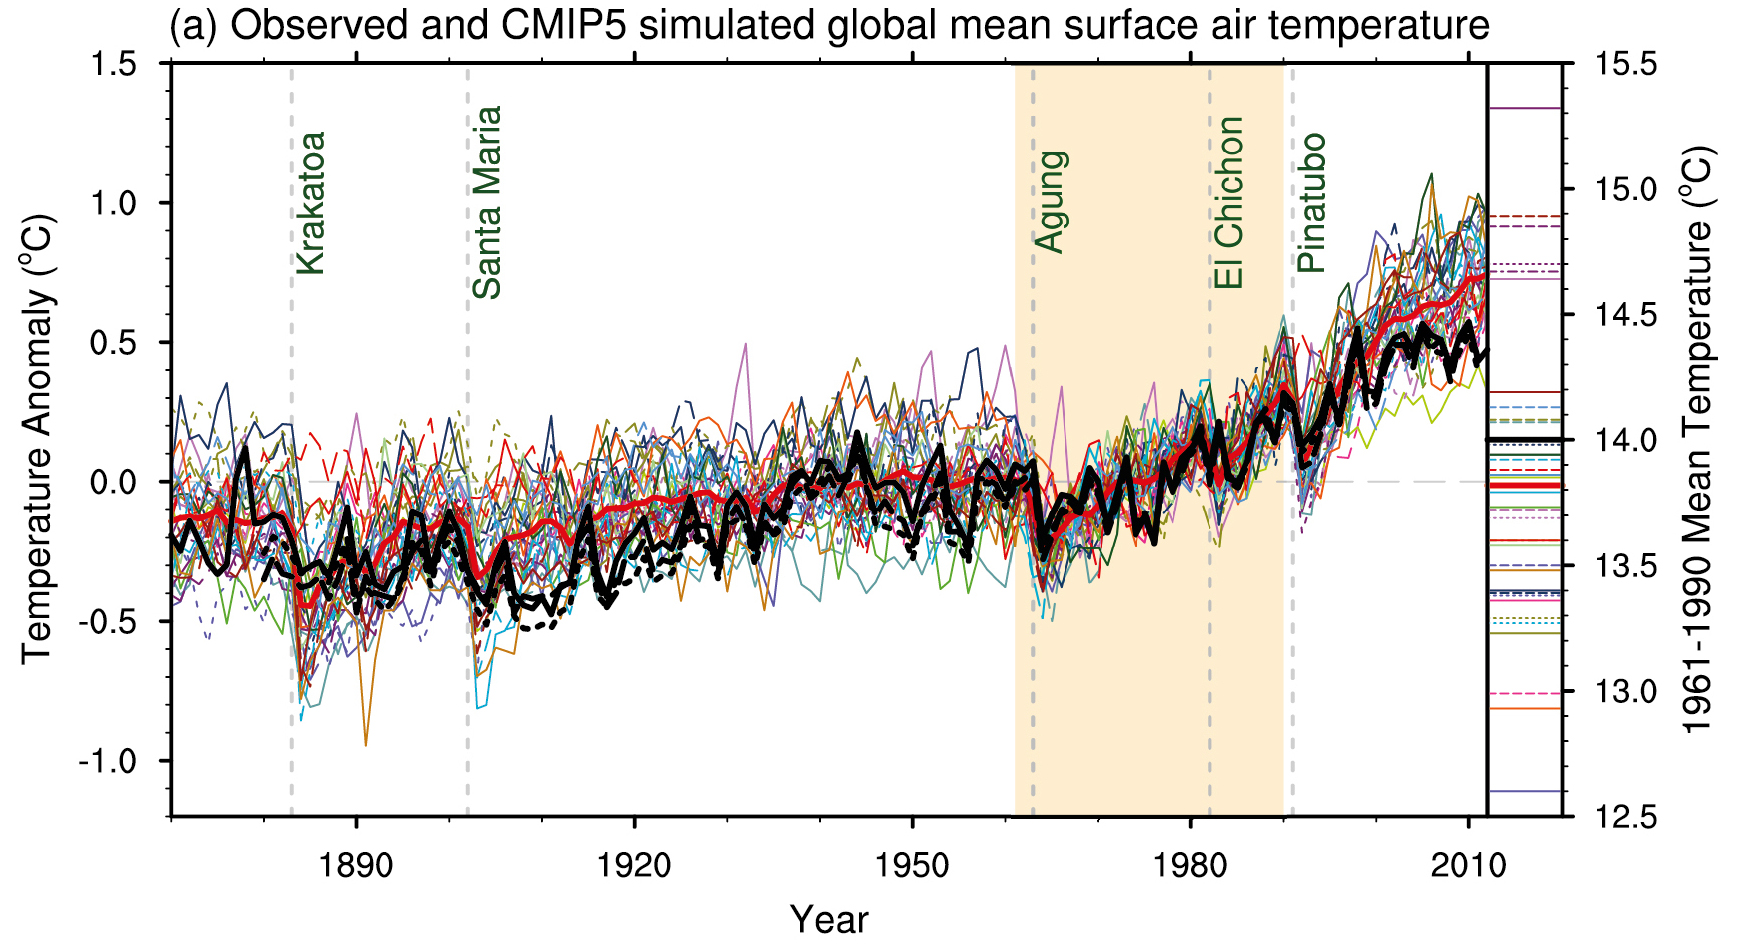
Figure 3 - CMIP5 simulations from the IPCC AR5 WG1 Figure 9.8. Black line indicates the observed global surface temperatures and the coloured lines are the climate model runs.
Schmidt (2014): Replacing CMIP5 Estimates With Better Ones
As shown in Figure 3, the collection of climate models used in the latest IPCC report (CMIP5) do a reasonable job of simulating the observed surface temperatures in the 20th century, but seem to be running too warm for the 21st century. An immediate reaction might be that the models are overestimating recent surface warming, however, given that they simulate the 20th century temperature trend with reasonable fidelity, this doesn't pass muster as a reasonable explanation. What about the long periods in the 20th century where the models do very well? And what about periods, such as the 1960's where the models run too cool? A more likely explanation is that the presumed forcings input into the model simulations, especially over the latter period could be the problem. A recently published research paper, Schmidt (2014), shows that this may indeed be the case.
When utilizing the climate models to project future surface temperature trends certain presumptions have to be made because of external influences on the climate system. Not only do industrial greenhouse gas emissions have to be estimated, but estimates are also made on the behaviour of solar radiation from the sun, and the amount and distribution of light-scattering aerosols in the atmosphere from both natural and human-made sources. In the CMIP5 simulations (shown in Figure 3) the estimated trends for the 21st century were based upon 20th century trends continuing on into 21st century (Taylor [2012], IPCC AR5), but the updated estimates and observations provided by Schmidt (2014) reveal that this did not happen. See figure 4 below.
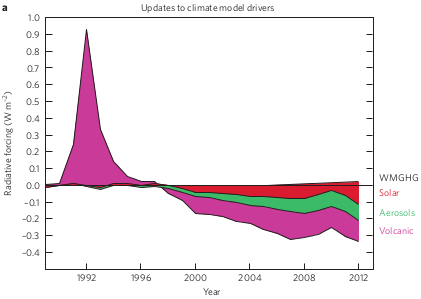
Figure 4 - updated forcing estimates of solar, volcanic, and industrial pollution for the CMIP5 climate model simulations. Image from Schmidt et al (2014).
Based on new observations, improved satellite retrievals, and reanalysis of older data, Schmidt (2014) discovered that the models overestimated the short-term cooling effect of the Mt Pinatubo eruption in 1991, and underestimated the cooling effect of increased volcanic eruptions, industrial pollution, and weaker-than-expected solar radiation in the 21st century. In comparison with the NASA surface temperature dataset, about 33% of the discrepancy in the last 16 years between the CMIP5 multi-model mean and Schmidt (2014) arises due underestimated volcanic emissions, around 15% due to weaker solar activity and El Niño/La Niña timing, and 25% due to industrial pollution.
CMIP5: The Warming That Never Was?
Rather than the models diverging from reality in recent times, as the CMIP5 models seemed to suggest, it turns out that the data fed into the simulations covering the last two decades was most likely wrong. Of course, this is not going to be the last word on the matter as the uncertainty of the size of the cooling effect of aerosols remains very large. Future observations and improved analysis could either enlarge or reduce the discrepancy further - only time will tell. As it currently stands, when corrected for the cooling and warming influences on Earth's climate, the climate models demonstrate a remarkable agreement with recent surface temperature warming trends.


@Tom Curtis #50:
I use NINO3.4 as my proxy for ENSO, not inverted SOI. Certainly this is a better metric in the satellite era since the SSTs are a direct forcing as opposed to SOI which is indirect. The Nino3.4 trend is in fact close to zero for the period 1916 to 1946 (my spreadsheets do use 30 year trends, i.e. Jan. 1917 to Dec. 1946, not 31, but I use the years only for shorthand). Anyway, I don't think I've made a mistake; the period in question is ENSO neutral by the NINO3.4 metric.
As for your ongoing comments about volcanoes; if you are saying they are some part of the reason for the discrepancy between CMIP5 and SAT, I can agree, but not the way you would like. Volcanoes are in fact modeled by CMIP5 so if you want to claim the models do a good job of modelling the volcanoes, then they are not part of this argument. Unlike ENSO, vulcanism affects both the models and the empirical data, supposedly equally, so they don't belong in this discussion. Either the major volcanoes are modeled well, meaning they are not part of the CMIP5/SAT discrepancy, or they are not modeled well in which case I would agree.
As for the 1969 to 1998 trend, the differences are modest compared to the current discrepancy which you accrue to ENSO error. Look at your own graph. The error just keeps getting bigger but the trend in NINO3.4 now is less in magnitude than 1998.
Klapper @51, IMO Nino 3.4 is clearly inferior to SOI as an ENSO index because it incorporates any global warming signal as a positive ENSO signal. That is, over time it will progressively inflate El Nino values and deflate La Nina values simply because the central Pacific SST are increasing in temperature due to global warming. If you are going to use a temperature based index, you should at least use the ratio of NINO 3.4 to the average of all tropical Pacific SST from + to - 15 degrees Latitude, and from the west coast of the Americas to the West tip of Sumatra so that any uniform warming across the Pacific is eliminated from the signal. Failure to do so renders any argument about the relative effect of ENSO and an underlying global warming trend futile in that you have incorporated the underlying trend in your ENSO signal. You will also have incorporated some part of the volcanic signal in your ENSO signal - again rendering discussion of relative influences futile.
I am not wedded to the SOI per se. An index based directly on the strength of the Walker circulation, or even better on relative Sea Levels in the Western and Eastern Pacific would also be good indices. However, we do not have accurate indices of those values extending back in time, wheras we do for the SOI.
Further, the volcanic trends are relevant to this discussion because:
a) It is quite possible that the model mean does not capture the actual temperature response to volcanoes; and certainly the observed temperature does not because there are confounding factors that cannot be eliminated (primarilly, but not exclusively, ENSO).
b) The large difference in thirty year trends between AR4 and AR5 are at least in part a simple consequence of the impact of volcanoes on the trend. As the impact of one of those volcanoes, and the one having the most influence on the trend for the last few years in the models, was scrubbed out by a concurrent El Nino in the observed record, any simplistic comparison between observed and model mean trends which does not factor in the effects of ENSO and volcanoes will come to mistaken conclusions.
c) Failure to recognize the impact of volcanism on the model mean trends will lead you to project any current inaccuracy into the future. However, that inaccuracy may be due to inadequate handling of volcanoes, but a correct determination of the underlying trend. In the later case, the underlying trend shown for the rest of the century will still be accurate.
@Tom Curtis #52:
There is no significant long term trend in the NINO3.4 data so either the data have been detrended by the originater or there is no warming in the east central Pacific over the last 100 years. Either way, it seems it's an OK metric to use as a proxy for ENSO. I do agree the pre-satellite era Nino3.4 data are suspect since they no doubt rely on Re-analysis to fill what are probably large holes in the data.
As for the disruption volcanoes pose to the CMIP5 vs SAT trend analysis, I'm having hard time discerning your logic. Do you think the CMIP5 models do a good or poor job of emulating the radiative forcing from large volcanoes? If you believe the former, then volcanoes can't be a significant reason for the CMIP5 to SAT 30 year trend error.
I can agree the recent 30 year trend in SAT has been suppressed by an ENSO bias, which the CMIP5 models don't emulate, but I'm surprised that you think volcanoes are also part of the discrepancy. In theory the models and empirical data are both influenced by these major volcanic events equally.
Summarizing my thoughts, the current discrepancy between model and empirical data 30 year trends is partially due to the models inability to emulate ENSO, and possibly some problems with the emulation of volcanic forcing, but most of the problem is that the models run too hot, that is they have some error in the feedbacks to GHG forcing, in addition to whatever problems they have with ENSO or volcanic aerosol forcing.
Klapper @53:
1) The data is not detrended, and nor has their been a lack of warming. Rather, the variation in SST in the NINO 3.4 region due to ENSO is very large relative to the warming due to global warming. The result is a large standard deviation of the values, and consequently the small trend due to global warming does not register as statistically significant. None-the-less, it is still there.
2) Re NINO 3.4 vs SOI, here is a direct comparison for the period over which we consistently have values for the SST in the NINO 3.4 region:
As a result of normalizing the values, it is easy to see that both are comparable as to ENSO values, and as to thirty year trends. It also allows a direct comparison of trends in units of standard deviations. Over the interval 1949-2012 inclusive (the period examined), the linear trend in NINO 3.4 is 30% larger than that for the SOI. That is consistent with a global warming trend being incorporated into the NINO 3.4 index (as it must be of necessity due to the nature of that index). Further, the consequences of including that trend are just as I predicted.
So, switching to NINO 3.4 does not significantly help your case; but it does have the disadvantage of incorporating a global warming signal in your ENSO index, thereby confusing the issue.
On a side note, from 1884 to 1949, blocks of up to six years data are missing from NINO 3.4. You may prefer NINO 3.4 for calculating the trend from 1916-1945, but that thirty year trend has ten years data missing from it, in two seperate blocks and is hardly reliable. This contrasts with the effectively complete record for the SOI.
3) Re volcanoes, the logic is very simple. Suppose you think models over state the temperature influence of volcanoes. From that supposition, it follows that the models will understate trends more relative to observations when it has a large number, or very large volcanoes in the last 15 years of the 30 year trend, and overstate them when the volcanoes are in the first 15 years of the 30 year trend. As the current thirty year trend has the influence of two large volcanoes in the first 15 years, that means if the models overstate volanic influence, then part of the discrepancy between models and observations is due to that problem rather than to the models running generally hot. It appears to me that you want to have your cake and eat it - it to state models overstate the influence of volcanoes, but also to interpret the full discrepancy between observed and modelled trends as due to models running hot.
For what it is worth, I am inclined to think that the models run slightly hot (about 15%), and that the models do overstate the cooling influence of volcanoes so that both factors are in play. However, regardless of what we think, you cannot assess how hot the models run in a period with trends significantly influenced by recent volcanism (such as the current period) without examining what effect the volcanoes have on the trend. You can, of course, take an average over periods when the volcanoes inflate model trends, and periods when they deflate the model trends to find the approximate average of how hot the models run with respect to the underlying trend, which brings us back to where we were eight days ago.
4) What your thoughts are do not matter. You have not provided evidence or reasoning to justify those thoughts. Indeed, your current position seems to be no different from that nine days ago when you though models ran 40-50% to hot based only on the most recent 30 year trend, and without regard to the influence of ENSO and volcanoes on that trend. Since then we have seen that:
1) Averaged accross many thirty year trends, models are on average 13-18% to hot;
2) ENSO has a substantial influence on thirty year trends, which is not reflected in the models;
3) Volcanism has a substantial influence on thirty year trends, which may differ between models and observations; and
4) If models overstate the cooling effect of volcanoes, then both ENSO and volcanic influences on the most recent thirty year trend tend to exagerate the discrepancy between models and observations - potentially by a large margin.
And you still show no willingness to revise down your estimate of how hot models run relative to observations!
Is there any point in continuing at this stage?
@Tom Curtis #53:
The trend in NINO3.4 for the last 100 years (Oct 1914 to Sep. 2013) is -0.002C/decade. There is no long term warming trend in ENSO. The data I'm using are HadSSTi downloaded from KMNI data explorer. I see zero trend in NINO3.4 over the last century so if you are finding trends, then they are likely driven by the PDO, another cycle which the models cannot emulate. The downloaded data show no missing months in the 144 year period available.
You can argue that this must be "re-analysis" data and therefore subject to high error, but the underlying warming trend in the central east Pacific appears to be statistically indistinguisable from zero. Hence I can't agree with your claim that there is an underlying warming trend in the NINO3.4 dataset.
As for your claim my "thoughts don't matter" I would point out you have not quantified your claim the models overcool during major volcanic events so you're doing a lot of hand waving but you haven't backed that claim up. Mind you I actually agree, but until you quantify this overcooling, statements like "potentially by a large margin" have no backup.
Klapper @55:
1) The HadISST1 (not HadSSTi) is an observational dataset with interpolation, not a reanalysis. It is currently based on the HadSST2 dataset, which has been superceded by the HadSST3 dataset, which I used. Dropping the default requirement from the KNMI explorer from 30% valid data points to 5% valid data points, I was able do download an almost continuous annual data series from 1914 onwards. It misses only the year 1946, but many years prior to 1949 have less than four months data, and many months have less than 30% valid data points. However, based on that I then calculated the trend from 1914-2013. It is 0.045 C per decade, with a standard deviation of the trend of 0.022 C per decade. That is, if you ignore the poor quality of the data prior to 1949, the trend is significant. Given that the interpolated data field based on an obsolete dataset does not even preserve the sign on that trend, I would say so much the worse for trusting the interpolation until they update the dataset used.
2) I don't need to quantify the overcooling. The point of this excercise it to determine by how much, if at all, climate models run warm with respect to observations for the underlying trend. I have quantified that by comparing a large number of thirty year trends over different periods so that positive and negative biases on the discrepancy due to ENSO and volcanism will have largely averaged out. The only thing I need to specifically point to the volcanism for is to demonstrate that estimates of the discrepancy based on a single 30 year trend are unreliable.
However, as you are basing your estimate of how warm the models are running based on a single trend, you do need to estimate the volanism induced discrepancy and the ENSO induced discrepancy, (and the differences in forcing induced disrepancy) to make that estimate. Instead you treat the naive estimate as if it were a reasonable indicater. I have shown it is not.
@Tom Curtis #56:
I checked the Hadisst1 dataset for the NINO3.4 region (165 to 120W, +5 to -5 North) instead of getting the NINO3.4 index directly from climate data explorer and got a very slightly different answer for the last 100 years (-0.0047C/decade), but still no warming trend is apparent. I think my point is this: the dataset I used has no gaps and also has no long term trend so I believe it to be a valid proxy for ENSO, although I could detrend HadSSTv3 detrend it and use that too except it's full of temporal holes.
As for your second point I'm not basing my hypothesis the models are running hot on a single trend. Before you had posted your rolling trend graph I had tried to do the same thing but when SKS said I had to "host" I didn't bother. I'm basing my hypothesis on approximately 120 trends since 2004 that show an increasing divergence between CMIP5 model projections and the empirical data. You are right I did my error calculations on only the last trend in this series however.
Klapper @57:
NINO 3.4:
1) Nino 3.4 is the SST in the region from 5 degrees North and 5 degrees south, and from 170 degrees West and 120 degrees West.
2) The full NINO 3.4 record (Jan 1870-Jan2014) shows a statistically significant warming trend of 0.014 +/- 0.008 C/decade (2 standard deviations confidence interval).
3) The 100 year record does not show a statistically significant warming trend because it start years fall conveniently on a cluster of El Nino years, while its end years fall on a cluster of La Nina years.
4) The underlying observations for HadISST1 do not properly correct for differences in methods of measurement of SST. That is the difference between HadSST3 and other SST products.
5) All of this is beside the point. Given that you are wedded to NINO 3.4 using HadISST1, here are the recent running 30 year trends for that record. As you can see, they show the same pattern as that from the SOI. The consequence is that, since November 2005, ENSO as measured by NINO 3.4 (HadISST1) causes observed temperature trends to fall further below modelled trends than would be the case without ENSO. With SOI annual values, since 2005 ENSO has the same effect. Perhaps next time you dispute a data source, you will show that your preffered data source actually make a difference to the point at hand, and is not simply a red herring as your introduction of NINO 3.4 (HadISST1) has been.
Trends:
I have shown conclusively that if models over estimate cooling from models, then there will be a divergence in model and observed trends due to recent volcanism on top of any baseline discrepancy. That divergence would start around 2002. I have also shown conclusively that ENSO will cause a further divergence in the same direction since about 2005. Yet you base your argument for a large baseline discrepancy between models and observations on the increasing divergence since 2004? Seriously?
I assume the cherry pick was accidental, but even you must now recognize that estimate the baseline divergence based on a period over the whole of which it is known that extraneious factors exagerate the observed discrepancy is not sound. If persisted it, it is not honest.
@Tom Curtis #58:
NINO3.4 from Hadisst1 is a perfectly fine proxy for ENSO. By your comments, it shows the same pattern as SOI, it has full temporal coverage, and no trend over the last 100 years which is all I looked at. Anyway, it was handy and met my criteria so I used it. The more pertinent fact is that it is a direct forcing as I've noted before, unlike SOI which is indirect.
Looking at your graph, I'm thinking that the pattern displayed is heavily influenced by the PDO. The peak ENSO "warm" trend looks to be a 30 year period ending in 1998. The error between CMIP5 and SAT in this period is 0.14 - .16C/decade = -0.02C/decade. However, the error now is much larger. The 30 year trend ending in 2014 is 0.17C/decade for SAT and 0.25C/decade, or +.08C/decade. I think you are implying that volcanic overcooling errors in the models account for the big difference in model error during the cool ENSO phase vs the warm ENSO phase.
I'm not sure what you mean by "models over estimate cooling from models"; I assume you mean volcanoes. You are right the models probably overcool during volcanic episodes, however since you don't quantify it's unclear whether the effect is large or small. We both agree on the sign of the bias for volcanoes, and the sign of the bias for ENSO over the last 30 years, but it seems we don't agree on the magnitude. With no numbers on the table perhaps we'll just wait a few more years and comment on the state of the divergence then.
Klapper @59:
HadISST1: ENSO (the El Nino Southern Oscilation) is no more directly measured by a pure El Nino/La Nina index than it is by a pure SOI index. Further, the El Nino fluctuations themselves are caused by changes in the strength of the Walker circuation, which is caused by changes in pressure between the Central and Western Pacific. Thus the SOI measures a direct link in the causal chain of El Ninos. The change in relative pressure may be caused in part by changes relative changes in temperature. Relative changes in temperature are no measurable by taking the average SST of a small area. Your claim that NINO 3.4 measures a direct forcing is false. Indeed, it is the SOI that measures a direct forcing, rather than NINO 3.4. Had you used the Trans Nino Index (TNI), you would at least have an arguable case ("arguable" in that it is not clear that the relevant areas are the best for measuring the causality).
PDO: The PDO is closely entwined with ENSO, but it is not clear in which direction the causation flows. It is also irrelevant in that once you have included the ENSO signal, you have de facto included the PDO signal on global warming as well (because they are so closely entwined). Therefore the PDO is a distraction in this discussion.
Error: If the baseline error results in models over stating warming, variations around that baseline will bring models and observations into close agreement, or great divergence. Thus, if the baseline trend in observations is 0.17 C/decade and that in models is 0.2 C/decade, a +/- 0.04 C/decade influence on the observed trend will result in discrepancies between -0.01 and + 0.07 C. Such variations are not arguments to think the baseline discrepancy is more than about 15%. Rather they are reasons to think that it is about 15% +/- 15% - where the +/- represents not the error in the estimate but the variation around the baseline discrepancy.
This is the last time I will make that point. If you cannot see that by now, it is because you will not see it. The possibility that the model error is not large is too uncomfortable for you to deal with, so you reject it regardless of the evidence.
""models over estimate cooling from models": Sorry for that. My previous post was written early in the morning after an entirely sleepless night due to insomnia. As a result a number of mistypings crept in.