


 Arguments


The latest global temperature data are breaking records
Posted on 15 June 2015 by John Abraham
Just today, NASA released its global temperature data for the month of May 2015. It was a scorching 0.71°C (1.3°F) above the long-term average. It is also the hottest first five months of any year ever recorded. As we look at climate patterns over the next year or so, it is likely that this year will set a new all-time record. In fact, as of now, 2015 is a whopping 0.1°C (0.17°F) hotter than last year, which itself was the hottest year on record.
Below, NASA’s annual temperatures are shown. Each year’s results are shown as black dots. Some years are warmer, some are cooler and we never want to put too much emphasis on any single year’s temperature. I have added a star to show where 2015 is so far this year, simply off the chart. The last 12 months are at record levels as well. So far June has been very hot as well, likely to end up warmer than May.

Global surface temperature estimates from NASA GISS.
So why talk about month temperatures or even annual temperatures? Isn’t climate about long-term trends?
First, there has been a lot of discussion of the so-called ‘pause.’ As I have pointed out many times here and in my own research, there has been no pause at all. We know this first by looking at the rate of energy gain within the oceans. But other recent publications, like ones I’ve written about have taken account of instrument and measurement quality and they too find no pause.
Second, there has been a lot of discussion of why models were running hotter than surface air temperatures. There was a real divergence for a while with most models suggesting more warming. Well with 2014 and 2015, we see that the models and actual surface temperatures are in very close agreement.
When we combine surface temperatures with ocean heat content, as seen below, a clear picture emerges. Warming is continuing at a rapid rate.
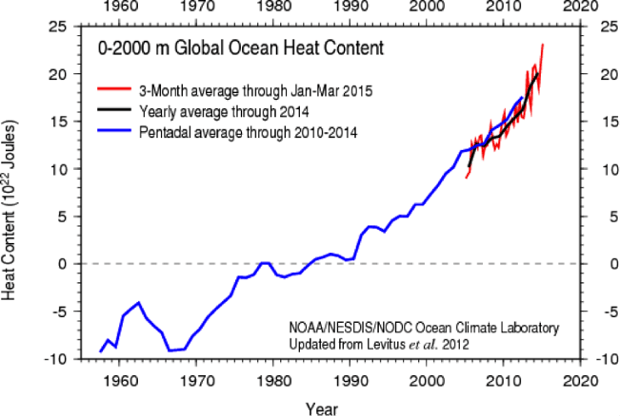
Global ocean heat content estimates from NOAA.
There is an emerging view that the so-called surface warming slowdown was caused from poor instrument coverage around the globe, volcanic eruptions, and a multi-year oscillation in the oceans. The issue of instrument coverage is being fixed as we speak.
But, any short term fluctuations can only temporarily influence the long term trend. In the ocean heat content image above, you might notice a slight change in the trend around 2005. The trend change has since disappeared; it was associated with the ocean oscillations I mentioned earlier.
The recent warming skyrocket has put the contrarians in a bad position. In 2013, when contrarian Christopher Monckton repeated a claim that temperatures might decrease by 0.5°C in two years, I challenged him to a $1000 bet. He never took that bet, but we can see he would have lost handily if he had.
More recently, contrarian Judith Curry was reported as warning about decades of cooling (or perhaps lack of warming) stretching out to the 2030s. We see that this prediction is not looking very likely. Other contrarians have made similar predictions and it makes one wonder how much evidence will have to pile up before they climb down.
Just a few months ago, Roy Spencer (another climate contrarian) claimed, “We are probably past the point of reaching a new peak temperature anomaly from the current El Niño, suggesting it was rather weak.” While it remains to be seen whether or not he is correct, his own data have shown an uptick in temperatures, and the most recent months have continued the very warm trend. Barring something really unusual, the trend will continue until the end of this year.
I asked climate expert Dr. Joe Romm, Founding Editor of Climate Progress for his thoughts. He reminds us,


50 comments later and no one has bothered to address my initial question.
Thanks a lot everybody. Really helpful.
[JH] Self-righteous comments like the above are not likely to encourage readers to respond to your questions.
Wili,
Perhaps others think you should do your own homework.
Going to the data linked in the first line of the OP, 1880-1900 averages about -.25 degrees (I used my calibrated eyeball). The first 5 months of 2015 are about +0.75C. Adding those together results in about 1.0 total increase since 1880-1900.
How can anyone suggest that climate sensitivity to CO2 can be as low as 1.5C per doubling when an increase from 270 to 400 gives us 1.0C without coming to equilibrium??
wili
Confusingly, there are several baselines that get used, and no single standard for pre-industrial temps (the chaps at the met office use 1861-1890). A reference in the IPCC's 2007 report gives numbers in respect to both 1961-1990 and pre-industrial baselines, and they differ by 0.3C.
Because HadCRUT uses the 1961-1990 baseline, If you want an officialish estimate of current temps with respect to pre-industrial times, just get the latest HadCRUT data and add 0.3C.
@michael
Because GHGs aren't the only climatic influences. All you have to do is overplay the role of the sun or unicorns or whatever and blame that for the warming.
wili @51.
So your question @1 wasn't rhetorical then.
Further to the comment following #51, the pre-industrial temperature is strangely seldom given a number which is remarkable given how often it is given as the baseline temperature. Then how do we know the global temperature in 1750?
The usual take on pre-industrial is to take the earilest part of the instrument record that is available, which for GISS (as in the graph in the post) yields perhaps an extra 0.3ºC on top of the 1951-1980 anomaly base (as per the centre of the green 'error bar' in the graph). I have seen this 0.3ºC inferred by the IPCC, but rather obscurely so. And the BEST land temperature record back to the mid 1700s (graphed here - usually 2 clicks to 'download your attachment') suggests 1880 isn't greatly misplaced as representative of pre-industrial. So 0.3ºC below a 1951-1980 average seems reasonable.
Therefore, if the last 12 months of GISS average +0.72ºC or 2015 so far averages +0.766ºC, that would put us +1.02ºC or +1.066ºC above pre-industrial respectively.
MA Rogers @ #55 worte: "So your question @1 wasn't rhetorical then."
No, apparently, I'm just not that subtle! '-)
Really, I'm sorry if it came off as self righteous. But it was actually intended to be a fairly sharp criticism of the whole thread and the whole site.
This site is supposed to be about c o m m u n i c a t i o n, right?
Well, everyone has heard about the '2 degrees C' that is the supposed limit that everyone in the world has agreed that we are not supposed to cross.
Well, if you are going to have a major article on where we are in the march toward that limit, it just kinda sorta seems like it just might be a tiny bit reasonable to expect someone sometime to connect the temperatures you are reporting to this universal baseline. Idn't it?.
If you don't do this, you just are not _com-mu-ni-ca-ting_.
Yeah, I could try look it up and guess at an interpretation as michael bravely tried to do above, and probably end up perveying some inaccuracy...
But really, really, shouldn't we have a very, very clear idea of the basic base line that most of us are using, and then shouldn't we always, always refer back to that base line if we are actually actually trying to communicate something consistent to the world here???
/rant
Delete if you can't tollerate any spec of criticism. It is aimed at me as much as anyone. I'm as guilty as all y'all.
ps. I really do appreciate the work everybody does here. But I think we do need to have a further discussion about some ground rules about priorities when presenting some of this most basic and most crucial information of all time!
Now I'm sure I will banned from this beautiful site forever. Best wishes to all. --wili
[JH] Spare us the histrionics and all will go well.
purveying
One last gasp...
Look good and wonderful people.
We need to have the whole world...the entire freaking world...riveted, glued, fixed fast to...just two or three numbers:
1) The concentration of CO2 in the atmosphere (just passing 400ppm)
2) The resulting global average temperature, which has generally and most publically been expressed in terms of degrees C above pre-industrial levels, as expressed in IPCC, major international agreements, books like "6 degrees," etc., etc...
If a major new finding came out about CO2 concentrations and people decided to express it in, I don't know, drams per stone or something rather than in parts per million like everyone else, wouldn't you expect, from the writers trying to publicize such finding, that they would at the very mininmally least somewhere translate their peculiar (to most) measure into the much more widely used one??
Please tell me what I'm missing, here, if I'm missing something glaringly obvious (it wouldn't be the first time).
wili @58, while the IPCC expresses targets in terms of degrees C above the preindustrial temperatures, it reports temperatures as anomalies with respect to various multidecade periods in the 20th century (depending on which temperaure record they are using). There is a very good reason for that. Nobody really knows what the temperature was in 1750, although we can make a reasonable guess.
MA Rodger @55 makes a guess based on the BEST 1750 land only temperature, but BEST land only in 1750 amounts to a few European thermometers only, and is a poor index of global temperatures. Consequently the errors on that temperature determination are approximately as large as the difference between 1750 and 2000 temperatures in that index. Treating the land only temperature as a global (land and sea) index would only increase that error. This just illustrates that there were simply not enough temperature records kept in the 18th century to reasonably estimate the temperature difference between preindustrial temperatures and modern temperatures.
An alternative approach is to use "natural thermometers" in the form of paleotemperature reconstructions. Of this, probably the best current global reconstruction in Mann 08 (EIV). That is expressed in terms of temperature anomalies indexed to the HadCRUT3 temperature series. Because of the method used to correlate reconstructed temperatures with the instrumental record, and because of the slight differences between different instrumental records, using a different instrumental record will result in a different estimate of 1750 temperatures relative to modern temperatures. This is true even if the records use the same base period. The difference will approximately scale with the difference in the trend over the calibration period (1850-1995), but an exact determination would require replicating the reconstruction with the different temperature index. Unfortunately, the NCDC and GISS temperature indices do not extend back past 1880 and so cannot be used in such a replication.
The upshot is that even using reconstructed preindustrial temperatures, we cannot determine the difference modern temperatures in general, and preindustrial temperatures. The most we can do is determine an temperature index specific comparison which can give a rough idea, but no precise values. And that is restricting ourselves to a particular set of paleo data for the reconstruction, and a particular methodology.
Given these difficulties, it is unsurprising that nobody has in fact made a determination of the difference between preindustrial and modern temperatures in precise enough a manner that the IPCC WG1 considers worth citing. Given that the role of SkS is to communicate the science, that means SkS should not give specific values for the difference no matter how convenient it would be to have them. To do so would be to go beyond the science.
Having said that, it is possible to make educated guesses as to what the difference is. Based on Mann 08 EIV, my best guess as to the difference between the 1741-1760 average and 2014 is, for three different temperature indices:
HadCRUT4: 1.01 C
NOAA: 1.06C
GISS: 1.04 C
The error for HadCRUT4 is on the order of 0.4 C, and due to the inability to determine an approximate calibration for NOAA and GISS, is likely over 0.5 C for GISS (although I have not calculated it explicitly). So, a 1 C temperature difference is a reasonable estimate, but the error is too large for differences of +/- 0.1 C to be meaningful in the estimate.
Addendum: I should note that the SkS team are volunteers, with none of them being paid for their contributions. In addition to the problem of not having an accurately determined scientific value for the figure you want reported, it should be recognized that volunteers have limited time. I, for one, am thankful for the amazing resource the volunteers have managed to provide. While constructive criticism and requests to improve articles are always appropriate, they should be made in the recognition that any response is in the nature of a favour, not something that can be demanded as a right.
So let me get this straight:
Not only is the 2 degree target almost surely set way too high;
Not only is the 2 degree target almost surely unattainable now;
But we also will not even be able to tell when we hit or exceed the 2 degree target, nor accurately track our 'progress' toward that dreaded goal?
Wow, I knew we were pretty totally lost, but I didn't realize how lost we were in even determinging how lost we are.
So all the people deciding to set a goal of two degrees have not come around to agree on one standard to measure our progress toward that limit? That just seems at ones unbelievable and all too typical. Yes there are difficuluties, but you pick one measure and stick with it unless it is found to be woefully inadequate, it seems to me.
In any case, by all of the three measure that Tom has so kindly provided, we seem to have passed the one degree mark now.
I know this is just an arbitrary place on the number line, but to most of us this looks like a pretty significant milestone, much lie the 400ppm mark, not to be wasted in minutiae of figuring what proxy is used for historical temperatures.
We need as many wake up calls as we can possibly get at this point, and it just seems to me that the climate communications community is squandering an important opportunity here.
Am I crazy?
OK, I know, yes, I'm crazy, and histrionic as well, apparently '-).
But is this idea wacko for some reason that I'm not seeing?
Wili... On RealClimate, Dr Stefan Rahmstorf makes a strong case that the 2C limit is not too high and is still achievable.
Limiting global warming to 2 °C – why Victor and Kennel are wrong
Willi, the 2 C limit is not a cliff. That is, the costs of reaching 2.1 C will not differ very greatly from that of reaching 2 C, or 1.9 C. Rather, costs will gradually increase with higher values. As a result, the 2 C target is a fuzzy estimate, set at 2 C (rather than 1.8 or 2.15) because it is convenient to communicate in round numbers. When uncertainty on the estimates are included, they show a similar range to the uncertainty in temperature change since the preindustrial. That means that with low probability we may have already reached the threshold of "dangerous" climate change; or that with equally low probability we may have a 2 C leeway. The central estimate (of about 1 C leeway ignoring warming "already in the pipeline") is, however, a reasonable estimate for policy.
Having said that, the uncertainty is sufficient that tracking every 0.1 C difference is largely irrelevant except that each 0.1 C increase is a step in the wrong direction. We can track those increases from temperature anomalies from the mid twentieth century (which are well known) more easilly than those from the preindustrial (which is not well known).
Finally, I agree with Rahmstorff (and Rob Honeycutt) on the validity and achievability of the 2 C target.
Tom Curtis @59.
The obscure IPCC inference I mention @55 for the pre-industrial tempeature being 0.3ºC below the 1951-1980 average, equivalent to 0.5ºC below 1990 levels comes from AR4 SPM5 "...a 1 to 2°C increase in global mean temperature above 1990 levels (about 1.5 to 2.5°C above pre-industrial)..." which concurs with what you brand as my "guess", and happily also concurs with your own "reasonable estimate".
MA Rodger @63, I noticed that. My specific claim was that WG1 of the IPCC has not explicitly established a benchmark. WG2 (and the SPM) of necessity have done so, but discussing the difficulties in making the estimate, and uncertainties are beyond the WG2's brief. Therefore their statement should be considered a useful benchmark but not authoratitive (IMO). The AR4 WG2's clearest statement on the issue is on Box 19.2:
From the wording (ie, "reflecting the best estimate for warming over the 20th century"), the method of the estimate seems to be simply to assume that preindustrial temperatures approximately equal early twentieth century temperatures. That may be an inaccurate perception, but no method is explicitly stated, nor paper discussing the issue cited.
For what it is worth, using that estimate and HadCRUT4, 2014 is 0.89 C above preindustrial temperatures.
Thanks for the discussion. And nice to know that somebody thinks that 2 degrees is both attainable and not too high.
Tom wrote: "it is convenient to communicate in round numbers"
I would say not just convenient, but effective. And that's most of my point. If we are about to or have already hit a round-number milepost (1 degree C above pre-industrial levels), we should be making more hay about it. Do people disagree with me on that?
No one knows what will wake up the folks that need waking up, but they need all the prodding they can get.
Tom Curtis @64.
The +0.6ºC conversion given in AR4 - pre-industrial temperature to HadCRUT4 anomaly 1990-2000 - does appear in various places in that report. In searching it out I was usually more pleased to at last have found something explicit and wasn't too bothered which Working Group was responsible. WG1AR5 Ch2SM.4.3.3 give the conversion of HadCRUT4 1850-1900 anomaly to the 1986-2005 reference period as of 0.61ºC which suggests the latter can be substituted as a worthy alternative to the WG2AR4 figure, which effectively is what WG1AR5 does, as does WG2AR5.
In terms of finding a more authoritative statement within WG1 on the issue of pre-industrial global temperature, the whole thing does manage to fall between the stools. AR5 WG1 SPM surely should provide the references but the two relevant places fail to deliver. SPM B makes no mention of the issue. SPM E makes the promising note that:-
But there the trail runs dry. WG2AR5 is the document that tells us how bad AGW will be at various levels of impact defined by WG1. WG2SPM presents us with the asertion "°C relative to 1850–1900, as an approximation of preindustrial levels" with reference then to WG1AR5 Chapter2.4.
If, as wili insists, we should be providing a number for 'temperature rise above pre-industrial to date' and singing it from the rooftops, there remains the question of what the pre-industrial (or 1850-1900 as a usable approximation) should be compared with. The last 12 months of HadCRUT4 yields 0.93ºC. But this surely could be accused of being cherry-picked. Ditto the last complete calendar year.The comparison used in WG1AR5 SMP B is the last 10 complete calendar years of the record which AR5 using 2003-12 puts at 0.78ºC. Today it would be a little higher at 0.81ºC.
And then HadCRUT4 has its critics. So for comparison, using Cowtan & Way 2.0 yields 1.00ºC for the last 12 months & 0.89ºC for the last 12 calendar years.