1990: Nelson Mandela is released from prison, the reunification of Germany is agreed and the UN Intergovernmental Panel on Climate Change (IPCC) releases its first scientific report on global warming. Two years later the climate skeptic Dr. Patrick Michaels published an opinion article in Aeronautics America explaining why he thought that global warming wasn't a problem.
20 years later we can see how science has moved on in the areas that a 1990s skeptic thought were important. We’ll look at what the IPCC said in 1990, then Michaels’ own words from the 1992 article, and provide a quick summary of what happened afterwards. Snazzy, coloured boxes contain everything you need to know, but if you're desperate for detail then they are followed by extra comments and graphs to provide background.
These were early days for GCMs and the latest round of simulations include more physics and now estimate that doubling CO2 would eventually cause 2.4 C to 4.7 C global warming, with an average of 3.5 C (Andres et al, 2012).
20 years of new evidence has allowed the scientific community to refine the value and find that some of the old computer models probably ran on the hot side. This evidence was included by the IPCC and used to improve our understanding.
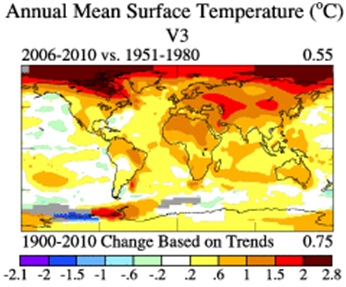
Figure 1 - NASA map comparing temperatures in 2006-2010 with 1951-1980 averages. Red means 2005-2010 was warmer, blue the opposite.
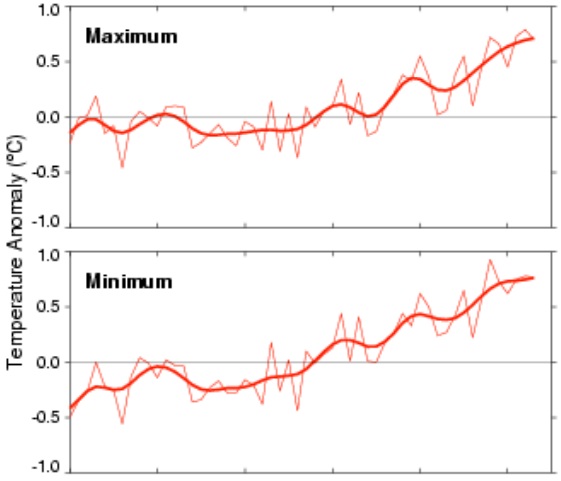
Figure 2 - Change in daytime maximum temperatures (top) and nighttime minimum temperatures (bottom) over land from Vose et al, 2005.
Because Earth is less efficient at cooling the surface at night, a stronger greenhouse effect should lead to more warming then, although other factors could be more important, like changing cloudiness (e.g. Trenberth & Dai, 2004) or air pollution (e.g. Forster & Solomon, 2003). The IPCC weren't sure whether nights would warm faster than days in the future, although in some countries that had been measured (Karl et al, 1991). This effect was later confirmed (Vose et al, 2005), although changes in weather station placement and equipment could affect the results (Fall et al, 2011).
Patrick Michaels suggested that there wouldn't be warming during the day, but the measurements show that days and nights have both been warming over land, as Figure 2 shows.
It's now more likely that we'll see severe heatwaves and droughts like in Europe (2003), Russia (2010) and Oklahoma/Texas (2011). These damaged food production, and now there's another heatwave/drought catastrophe in the US midwest that could cost $20 billion in crop insurance and cut corn productivity by 25%. This one hasn't been studied yet, but the others have all had their extreme heat linked to global warming (Peterson et al, 2012; Trenberth & Fasullo, 2011; Stott et al, 2004). Michaels was wrong, a tragedy for the tens of thousands dead in Europe and Russia, Texan and midwest farmers and anyone who suffers as food prices spike.
Figure 3 - GRACE satellite estimate of changes in the mass of the Greenland Ice Sheet in billions of tons (Professor John Wahr).
Greenland has warmed most in winter, but it's warmed in summer too (Box et al, 2010), and NASA recently confirmed that almost 100% of Greenland’s surface ice saw some melt this July, which for some places would be just the second time in 800 years (Alley and Anandakrishnan, 1995). By 2035, the IPCC expected 18 mm of sea level rise from Greenland’s melt. Satellite measurements show that from 2003-2010 the melt was going 50% faster than that (Jacob et al, 2012) thanks to recent acceleration (Rignot et al, 2011).
On top of that, Antarctica, which was expected in 1990 not to add to rising seas because of lower warming rates and increased snowfall, has also been melting (Zwally & Giovinetto, 2011).

Figure 4 - Sea level change from tide gauges (red), satellites (blue) and climate model expectations (grey area), taken from Allison et al, 2009.
The 1990 IPCC projections overestimated sea level rise slightly, but they didn't predict the effectiveness of the Montreal Protocol or changes in air pollution so they overestimated the amount of extra greenhouse effect that would be caused by human activity. In 2007, computer models expected 60 cm rise by 2100 but ignored some processes that could accelerate ice sheet melt.
Satellites measure seas rising right at the top of the IPCC predictions, as shown in Figure 4. Experiments using data from the past (Rahmstorf, 2007, Vermeer & Rahmstorf, 2009, Grinsted et al, 2010) conclude that sea level rise will probably be faster than expected. Another experiment gave a different, lower, answer (Siddall et al, 2009), but these results were withdrawn when they found errors.
Over 60% of responses to a recent expert poll said it was 'likely' or 'very likely' that oceans will rise faster than the 2007 IPCC projections, so maybe this new evidence is changing scientific opinion.
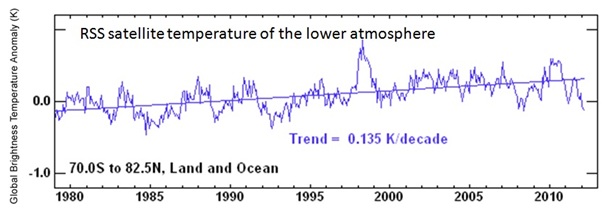
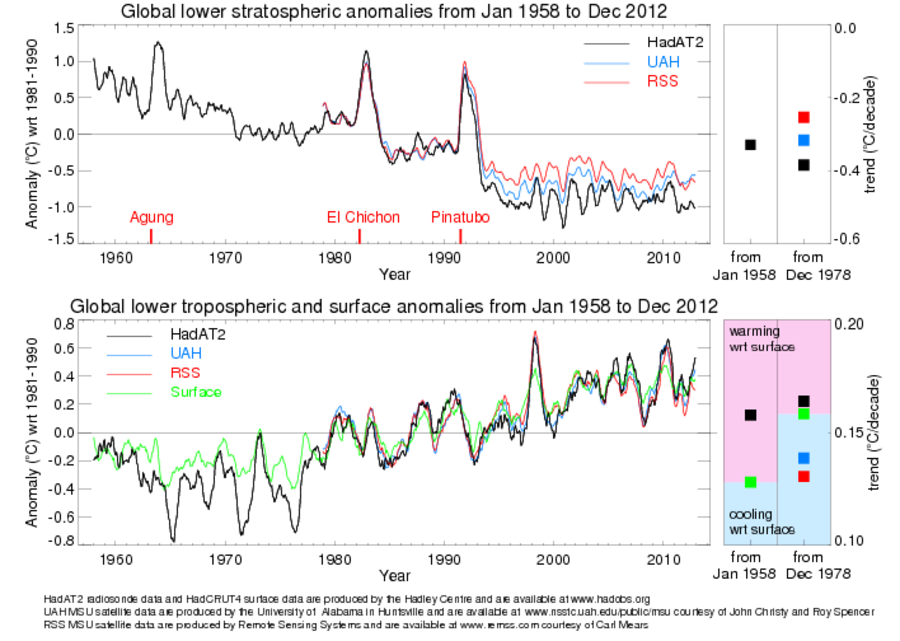
Figure 5 - Change in temperature of the lower atmosphere as reported by the RSS satellite record.
Michaels chose to ignore decades of thermometer and weather balloon measurements and focus on fewer years of satellite data. These were an unsolved mystery until the discovery of problems with the satellites, such as unexpected air resistance from the upper atmosphere which led to orbital decay (e.g. Wentz & Schabel, 1999, Mears & Wentz, 2005). With these problems fixed and new satellites with better design, the satellites clearly show global warming.
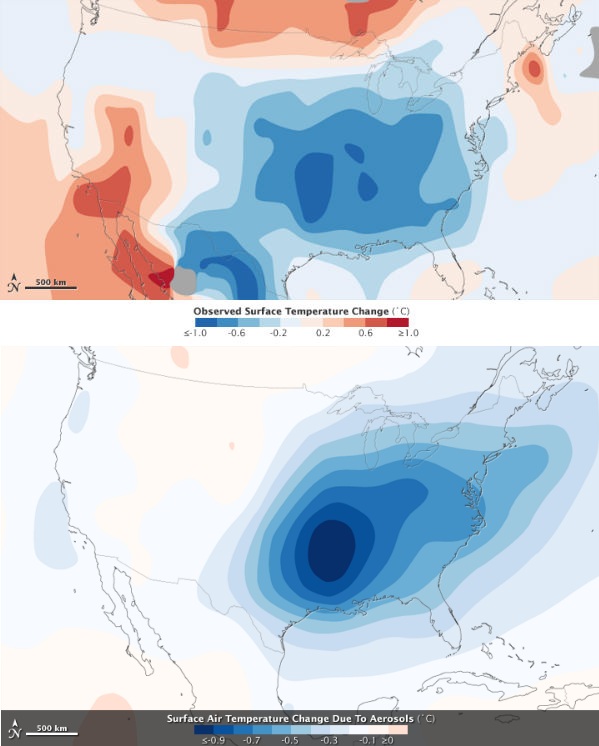
Figure 5 - (top) changes in temperature over the US from 1930 to 1990 when air pollution increased. The bottom graph shows how the distribution of air pollution affected the temperatures - the cooling in some regions of the US until 1990 was mostly caused by reflective air pollution which 'hid' the greenhouse warming (Leibensperger et al, 2012, and part 2).
In 1990, the IPCC didn't know whether the air pollution would cause more warming or cooling, but now scientists have calculated that it is a cooling effect that hides some of the greenhouse warming (e.g. IPCC, 2007, Murphy et al, 2007, Lohman et al, 2010, Koch et al, 2007).
We have measured dimming over polluted cities (e.g. Ramanathan et al, 2007) and the effects of volcanic eruptions that release the same particles (e.g. Stowe et al, 1992).
In the early 1990s we didn't know, but now we do: part of global warming is being hidden by this air pollution. In congressional testimony in November 2010, 3 years after the IPCC and a number of scientific papers concluded that this air pollution is slowing down global warming, Patrick Michaels effectively repeated his 1992 claim. Which must make you wonder whether this expert witness doesn't bother to read scientific research, or did he choose to mislead the US Congress?
It was the '90s and we knew a lot less than we do now; most of us didn't know about the internet, Harry Potter or Michael Phelps, it was reasonable to think back then that they didn't exist. But most of us now accept that they do because we have new evidence. It would be ridiculous if someone testified to the US Congress that they don't exist, using a presentation where they'd deleted evidence showing that they do, wouldn't it?
We have 20 years of data to compare what happened with Michaels' 1992 calls for caution. He suggested Greenland wouldn't melt, but it is. He suggested daytime temperatures wouldn't rise, but they are. He suggested concerns about sea level rise would vanish, but the seas are rising faster. He said that satellites didn't show global warming, but now they do. He critiqued models because they expected more warming over the Northern Hemisphere and he didn't see it, but that's exactly what happened.
Most scientists have taken the new evidence and used it to refine our understanding, which has refined our expectations of climate change.
Michaels still says that human caused global warming won't be a problem. His response to recent work has been to just pick the bits he likes and delete inconvenient data when he makes his presentations. In front of a Congressional hearing in November 2010 he continued to try to hide the fact that air pollution has a cooling effect. Professor Ben Santer was there and explained how "Dr Michaels' analysis is wrong, I'm sorry it's just completely incorrect". Michaels just ignored the last 20 years of science showing the effect of air pollution because it destroyed the argument he wanted to make.
Commitment to a cause is often laudable, and Michaels has been rewarded with fossil fuel money, a position with the anti-regulation Cato Institute, and his business interests are in publicising favourable scientific results and hiding and denying the existence of inconvenient ones via his company, New Hope Environmental Services. But science is about including new evidence and seeing if it changes your conclusions, not deleting, hiding and distorting the evidence you don't like. One should be careful, as Sherlock Holmes said, because if you aren't, then "Insensibly one begins to twist facts to suit theories, instead of theories to suit facts."
Posted by MarkR on Thursday, 23 August, 2012
 |
The Skeptical Science website by Skeptical Science is licensed under a Creative Commons Attribution 3.0 Unported License. |