Rather than responding to Peter Hadfield's devastating documentation of Christopher Monckton's constant misrepresentation of his sources, Monckton spent March 21st, 2012 giving a presentation to 5 California state legislators (of 120 who were invited) and approximately 75 predominantly climate denialist members of the public, plus me.
In Part 1 we examined Monckton's utterly absurd and alarmist claims regarding the cost of California's soon to be implemented carbon cap and trade system. Monckton flew in from abroad to try and tell Californians how we should address the problem of climate change, misinforming our public and policymakers by relying exclusively on one heavily-debunked economic paper.
Here in Part 2 we will examine Monckton's climate science claims in this same presentation, which as usual, misrepresented his sources. For those who wish to follow along, Monckton's slides can be downloaded here.
The main theme running throughout Monckton's presentation truthfully was not one of science, but rather of conspiracy theories. For example, at one point he made a joke about President Obama not being born in the United States - the birther conspiracy. Apparently it wasn't just a joke, because the next day on the Dennis Miller show, Monckton expanded on his birther conspiracy theory in much more detail.
Throughout the presentation Monckton accused climate scientists of fraud, data tampering, "bastardizations of science", "scientific voodoo", "naughty technique(s)", "fiddling with data", called mainstream climate science "a sham, a scam, and a scandal", referred to "enviromarxists of the hard left", and so forth. The rhetoric was extreme; all the while Monckton was the one consistently and constantly presenting distorted graphics and misinforming his audience.
To his credit, very similar to Fred Singer's recent comments, Monckton started out his presentation by establishing that CO2 is a greenhouse gas, and the human-caused atmospheric CO2 increase has caused some warming over the past century. While this shouldn't need to be said, unfortunately there are still quite a few climate denialists who dispute the greenhouse effect, and given the composition of the audience at this particular talk, I would not be surprised if a number of people in the audience denied this reality. Thus credit to Monckton for dispelling these myths up front.
Unfortunately the quality of the talk went downhill very quickly from there.
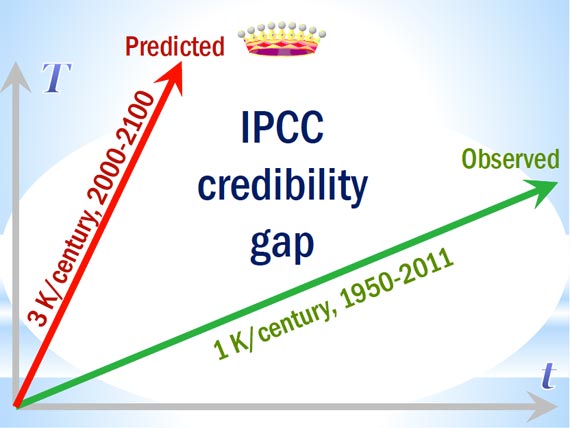
Monckton soon displayed a graphic of what he called "the IPCC credibility gap," which in fact completely undermined Monckton's own credibility (Figure 1).
Figure 1: Slide 3 from Monckton's California presentation, showing a purported "IPCC credibility gap"
In this slide, Monckton shows a graphic with the x-axis labeled "t" (time), and yet he shows the 1950-2011 trend beginning at the same point as the plotted IPCC 2000-2100 projected trend.
Being from the United Kingdom, perhaps Monckton borrowed Dr. Who's TARDIS, but for those of us who cannot travel through time, 1950 and 2000 are actually quite far apart, and thus plotting them at the same point on the x-axis as Monckton has done is erroneous and misleading. It is simply inappropriate to compare the observed warming thus far to the projected future warming, which is expected to accelerate in response to accelerating CO2 emissions, and claim that the difference between the two somehow reveals a "credibility gap." The only issue with credibility here is Monckton's for misleading his audience in this fashion.
Monckton next claimed that the magnitude and direction of climate feedbacks is "unsettled" and that there is no consensus on the issue. On the contrary, the many different lines of evidence are all consistent with the IPCC range of climate sensitivity, and thus net feedback estimates (Figure 2).

Figure 2: Distributions and ranges for climate sensitivity from different lines of evidence. The circle indicates the most likely value. The thin colored bars indicate very likely value (more than 90% probability). The thicker colored bars indicate likely values (more than 66% probability). Dashed lines indicate no robust constraint on an upper bound. The IPCC likely range (2 to 4.5°C) and most likely value (3°C) are indicated by the vertical grey bar and black line, respectively. Adapted from Knutti and Hegerl (2008)
Monckton also repeated his incorrect claim that climate sensitivity must be low because a positive feedback means runaway warming. Chris Colose did a nice job debunking that particular myth with great clarity here.
Monckton followed by repeating the same claim of a "fraudulent statistical technique" used by the IPCC which we previously debunked in detail here. However, in this presentation he made his argument much clearer, and thus even easier to debunk, comparing global temperature changes to a sine wave (Figure 3).
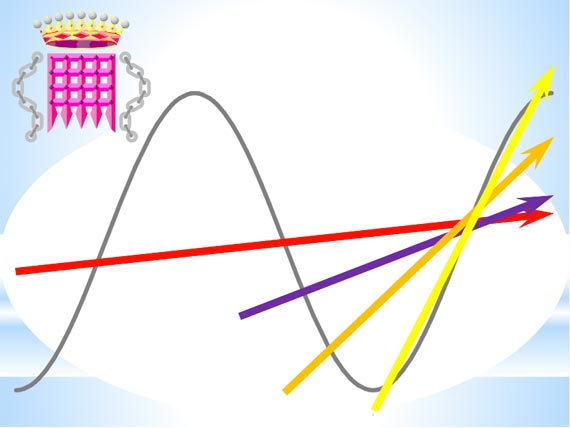
Figure 3: Slide 17 of Monckton's presentation showing the purported IPCC "fraudulent statistical technique"
Quite simply, while there are cyclical effects which influence the global temperature, the climate is not currently behaving as a sine wave. Rather the temperature is being forced upward by the global energy imbalance caused by human CO2 emissions. Monckton's accusation of fraud here assumes that like a sine wave, the global temperature has zero long-term trend and will start to cool any day now; thus the 25- to 150-year trends plotted by the IPCC are just short-term noise.
The faulty basis of this argument is quite self-evident. Based on this supposed "fraudulent statistical technique," Monckton asserted that we "should have no regard for the IPCC's findings." On the contrary, if Monckton makes such a basic error and then accuses the world's foremost climate scientists of fraud on the basis of his error, it is Monckton for whose findings we should have no regard.
Monckton also claimed that it warmed just as fast in 1860-1880 and 1910-1940 as it has in recent decades - a myth we have debunked here.
Monckton then repeated the myth that Ben Santer singlehandedly changed the 1995 IPCC report, which we debunked in Monckton Misrepresents Specific Situations (Part 2) and Monckton Myth #17: Debate vs. Denniss, Part 1. We wonder how many times we must debunk this myth for Monckton before he stops repeating it. The IPCC report is a consensus document which no single author can alter on their own. Monckton should stop trying to re-write history and start learning from it.
Speaking of rewriting history, Monckton also repeated the myth that the IPCC ‘disappeared’ the Medieval Warm Period (MWP), wrongfully asserting that the schematic diagram in the 1990 IPCC First Assessment Report (which was based on the Central England Temperature record, not global temperatures, and was published in 1966) was "the understanding" of global temperatures at the time. It was not - the figure was clearly labeled as a schematic, and was based on a single local temperature record. The horrendous Great Global Warming Swindle made a similar argument.
However, Monckton used this opportunity to launch into a diatribe against the Mann et al. 1998/1999 'hockey stick,' making all sorts of claims of fraud about that particular study. Rather than repeat them, I would simply recommend Michael Mann's The Hockey Stick and the Climate Wars, which explains the science involved far more accurately than Monckton, to say the least.
Regardless, Monckton is stuck 14 years in the past - all subsequent millennial temperature reconstructions (including by Mann and colleagues) show the MWP (and Little Ice Age), and also confirm the general 'hockey stick' shape of the temperature record, and the fact that the current rate of warming is unprecedented over the past 2,000 years.
Monckton then claimed that the IPCC global warming projections have been inaccurate, showing a figure created by computer modeler David Evans, whose shoddy work we have previously examined (Figure 4).
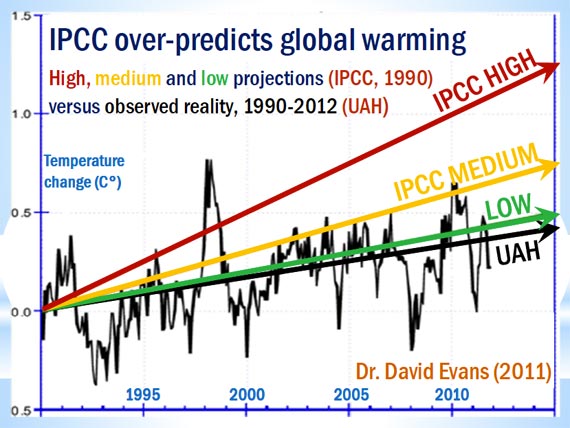
Figure 4: Slide 36 of Monckton's presentation showing purportedly inaccurate global temperature projections by the IPCC First Assessment Report (1990)
We don't know how Evans created this graphic, but we do know that plotting the University of Alabama at Huntsville (UAH) satellite atmosphere temperatures against the IPCC projected surface temperature means it is not an apples-to-apples comparison, and that when you do the apples-to-apples comparison, the graph actually looks like Figure 5.

Figure 5: IPCC FAR BAU "best" global warming projection reflecting the observed GHG changes (blue) vs. observed average global surface temperature change from GISTEMP (red) since 1990.
Details regarding how Figure 5 was created can be found here. In reality, the IPCC 'best' projection (2.5°C climate sensitivity for doubled atmospheric CO2) has been very close to observed surface temperature changes.
Monckton then proceeded to show a number of additional misleading graphs, mainly relying on short-term cherrypicked data to misinform his audience. The worst graph may have been his plot of global sea ice, whose extent Monckton claimed has remained "almost unchanged in 33 years" (Figure 6).
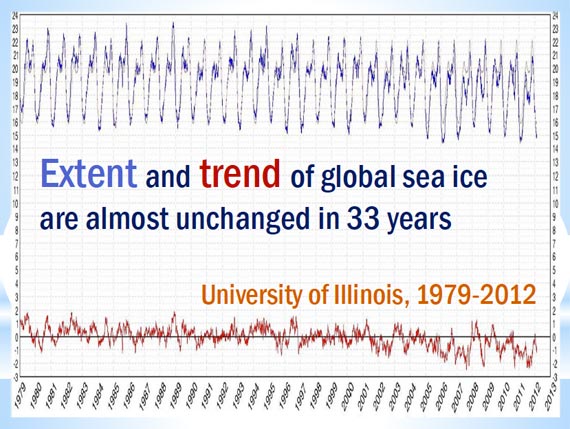
Figure 6: Slide 41 of Monckton's presentation showing purportedly "almost unchanged" global sea ice extent and trend
Reality, as usual, is quite different from Monckton's depiction (Figure 7).
Figure 7: National Snow and Ice Data Center (NSIDC) Antarctic, Arctic, and global (sum of the two) sea ice extents with linear trends. The data is smoothed with a 12-month running average.
Also see tamino's latest post on Arctic sea ice - how fake skeptics fool themselves (that title being a perfect descriptor of Monckton's presentation).
Monckton then made a very common error amongst climate denialists, claiming repeatedly that the potentially missing tropical troposphere "hot spot" is "the fingerprint of human-made global warming." This in fact is an error we have documented Monckton making time and time again (see here and here and here for a few examples). In fact Monckton has been making this erroenous argument for at least 4 years to this point. It almost seems as though Monckton is not interested in getting the facts and science right.
Let's once again be clear - the 'hot spot' is an expected result of any global warming and is not at all specific to human-caused global warming or an increased greenhouse effect. The 'hot spot' happens because any warming means more evaporation, which cools the surface. The vapour then travels up the atmosphere and condenses higher up, releasing latent heat and boosting warming there (Soden & Held, 2006).
After making his absurd and alarmist economic argument based on a single fundamentally-flawed and heavily-debunked paper (as we examined in Part 1), Monckton proceeded to attack renewable energy sources, claiming that they are "hundreds of times more expensive than fossil fuels." Likewise, this claim is utterly absurd and has no basis whatsoever in reality. In fact, if we take all costs into consideration, many renewable energy sources are already cheaper than fossil fuels.
Monckton also claimed that by implementing the proposed carbon cap and trade system, California will be diverting money which could be spent alleviating poverty in the Africa, and that we are thus kicking the poorest people in the teeth.
Have we used the word "absurd" too many times already? Even if the climate legislation were to have a significant adverse impact on California's economy - which we showed in Part 1 it will not - this is a false dichotemy. It should be self-evident that California is not taking money it would otherwise send to Africa in order to implement its climate legislation.
Ironically, the poorest nations (including many in Africa) are amongst those expected to be hardest-hit by climate change (and the least able to adapt due to their limited resources). Thus it is Monckton who is kicking the poor in the teeth by working to undermine efforts to mitigate climate change (Figure 8).
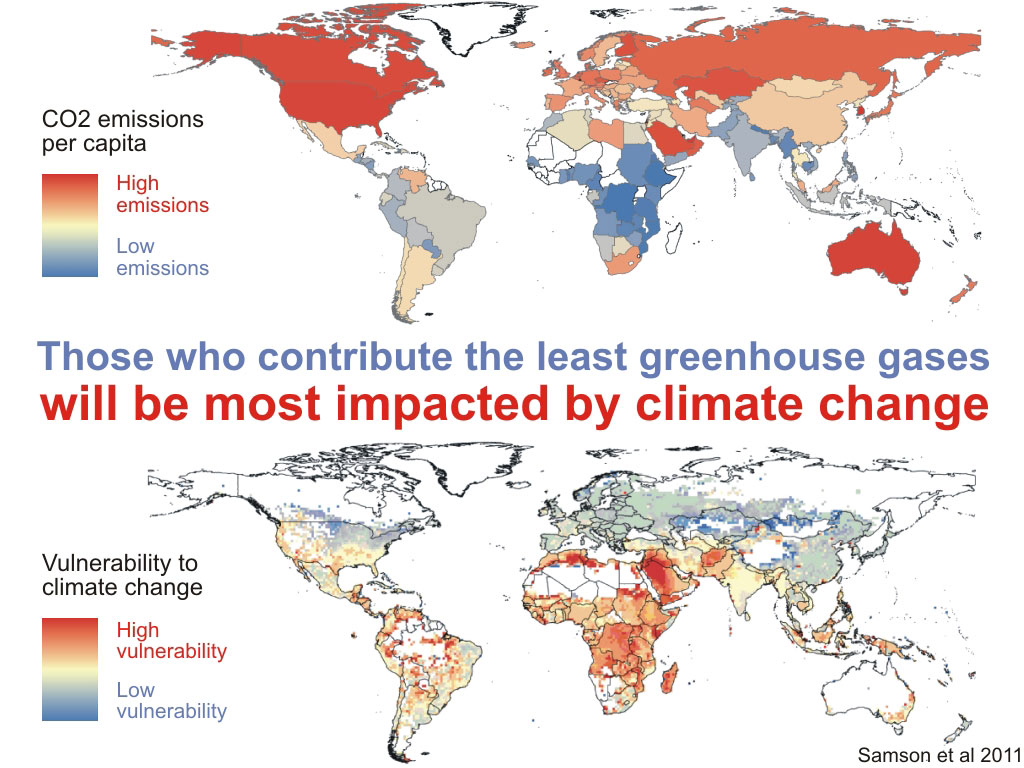
Figure 8: Per capita emissions vs. vulnerability to climate change, from Samson et al. (2011)
Believe it or not, there were several other misrepresentations in Monckton's talk which we did not cover in this post. In fact, it's hard to find a slide in his presentation that doesn't contain some sort of misrepresentation and/or outright falsehood.
Toward the end of the event, Monckton was asked what the "skeptics" can do to prevent governments from taking action to mitigate climate change. After making a comment about the "enviromarxist hard left," Monckton responded "get me in to meet the officials." Monckton believes he can convince lawmakers not to take action to mitigate climate change, and he probably has succeeded to convince a few to take a do-nothing stance.
And that is a problem. Monckton frankly has no business whatsoever speaking to policymakers about climate science. He has no expertise on the issue, and virtually every argument he makes is based on a misrepresentation of his sources. Monckton does not educate the public and policymakers; he misinforms them. Frankly it's a travesty that Monckton is treated as a climate expert and given the opportunity to misinform policymakers in the manner that I observed him doing to those 5 California state assembly members.
Posted by dana1981 on Thursday, 5 April, 2012
 |
The Skeptical Science website by Skeptical Science is licensed under a Creative Commons Attribution 3.0 Unported License. |